Detection of Very-High Energy Gamma-Rays from the BL Lac Object PG 1553+113 with the MAGIC Telescope
Abstract
The MAGIC telescope has observed very-high energy gamma-ray emission from the BL Lac object PG 1553+113 in 2005 and 2006 at an overall significance is . The light curve shows no significant flux variations on a daily timescale. The flux level during 2005 was, however, significantly higher as compared to 2006. The differential energy spectrum between 90 GeV and 500 GeV is well described by a power law with a spectral index of . The photon energy spectrum and spectral modeling allow to pose upper limits of and , respectively, on the yet undetermined redshift of PG 1553+113. Recent VLT observations of this blazar show featureless spectra in the near-IR, thus no direct redshift could be determined from these measurements.
1 Introduction
The active galactic nucleus (AGN) PG 1553+113 was first reported in the Palomar-Green catalog of UV-bright objects [1]. Its spectral characteristics are close to those of X-ray selected BL Lacs [2]. Despite several attempts, no emission or absorption lines have been found in the spectrum of PG 1553+113. Thus only indirect methods can be used to determine the redshift [3, 4]. Recently the H.E.S.S. [5] and MAGIC [6] collaborations have presented -ray signals at the and the level, respectively, making this source a confirmed VHE -ray emitter. Here we present the MAGIC observation results.
2 Observation and data analysis
PG 1553+113 was observed for 8.9 h in April/May 2005, and for 19 h from January to April 2006 with the MAGIC telescope [7], the currently largest Cerenkov telescope with a low trigger threshold of 60 GeV. Data taken during non-optimal weather conditions or affected by hardware problems were excluded from the analysis. Also, only data taken at small zenith angles ZA were used. After these selection cuts, 7.0 h and 11.8 h of good data remained for 2005 and 2006, respectively. Given the mean ZA of , -ray events above GeV have been used for the physics analysis. In addition, Off-data were taken on a nearby sky position with comparable ZA distribution and night sky conditions. These data were used to determine the background content in the signal region of the on-data. In total, 14.5 h of Off-data (6.5 h from 2005 and 8.0 h from 2006) were used for the analysis. Since the two off-samples were in good agreement we used the combined data to analyze the individual On-data samples. The data were analyzed using the standard MAGIC analysis chain [8, 9, 10]. The method for discrimination between hadron-induced and -ray-induced showers is based on the Random Forest (RF) method [11], which was trained on Off-data and Monte Carlo (MC) generated [12, 13] -ray events. The significance of any excess was calculated according to Eq. 17 in [14] where the On/Off ratio was derived, taking into account the smaller error from the Off-data fit. The RF method was also used for the energy estimation of the -ray showers, resulting in an average energy resolution of 24% RMS. Simultaneously with MAGIC, optical observations were performed with the KVA telescope.
3 Results
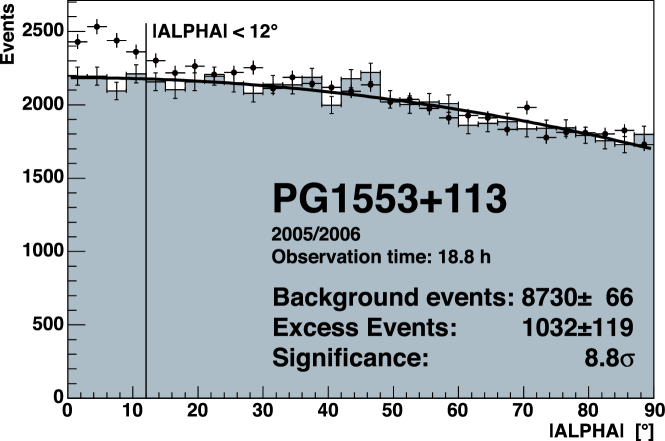
Combining the data from 2005 and 2006, a very clear signal is seen in the image parameter ALPHA, as shown in Fig. 1. Defining the signal region as ALPHA (containing about 90% of the -ray events), an excess of 1032 over 8730 background events yields a total significance of . The individual results for the years 2005 and 2006 are listed separately in Table 1.
| Year | on time | Non | Noff | on/off | sigma | photon index | |
|---|---|---|---|---|---|---|---|
| 2005 | 7.0 h | 3944 | 0.20 | ||||
| 2006 | 11.8 h | 5815 | 0.30 | ||||
| 2005+2006 | 18.8 h | 9761 | 0.49 |
The -ray, X-ray and optical light curve of PG 1553+113 are shown in Fig. 2. While the optical data show significant short term variability on the 25% level, the X-ray data are compatible with a constant emission (weighted mean of ). In -rays there is no evidence for short term variability, but a significant change in the flux level from 2005 to 2006 is found, given a systematic error of the analysis on the flux level of about 30%. The average integral flux between and is given as and (with given in units of ) for 2005 and 2006, respectively. On 2006 February 25, prior to the optical flare, a degree of optical linear polarization of and a polarization angle of was measured. Since the host galaxy cannot be resolved, the optical flux should correspond to the emission from the AGN core.

The combined 2005 and 2006 differential energy spectrum for PG 1553+113 is shown in Fig. 3. The integral fluxes above 200 GeV and the spectral slope coefficients for the different samples are listed in Tab. 1, taking into account the full instrumental resolution [15]. The energy spectrum is well described by a pure power law:
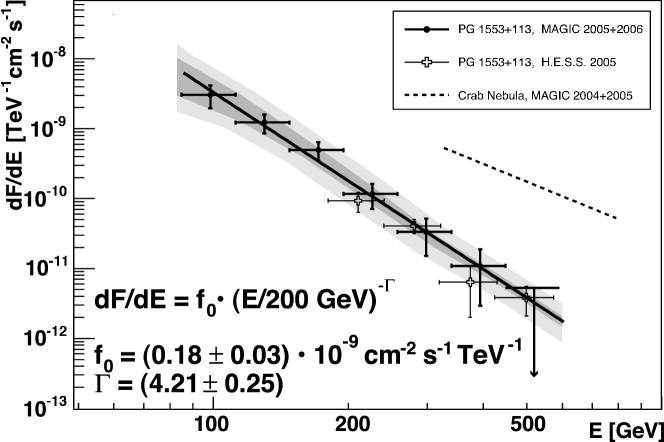
| (1) |
(in units of , ). The spectral slopes of the individual years are in good agreement although the flux level above is about a factor 3 larger in 2005 as compared to 2006. The estimated systematic error of the analysis (signal extraction, cut efficiencies etc.) is 25% (dark colored band in the figure) and 30% on the energy scale (light colored band).
4 Discussion
The MAGIC detection confirms the tentative signal seen by H.E.S.S. at a higher energy [5]. The agreement between the H.E.S.S. and MAGIC energy spectra is reasonably good. While the spectral slope is consistent within errors, the absolute flux above 200 GeV in 2005 is by a factor 4 larger compared to H.E.S.S. This difference may in part be explained by the systematic errors of both measurements but also by variations in the flux level of the source (the observations with H.E.S.S. were commenced after MAGIC). The observed energy spectrum is steeper than that of any other known BL Lac object. This may be an indication of a large redshift (), but can as well be attributed to intrinsic absorption at the AGN or, more naturally, to an inverse Compton peak position at lower energies. The spectrum can, however, be used to derive an upper limit on the source redshift from physical constrains on the intrinsic photon index () as discussed in [5]. Using the lower limit on the evolving EBL density from [16] we derived a upper limit on the redshift of , which agrees on the limit found in [5]. Other approaches to limit the redshift are given in [17, 18].
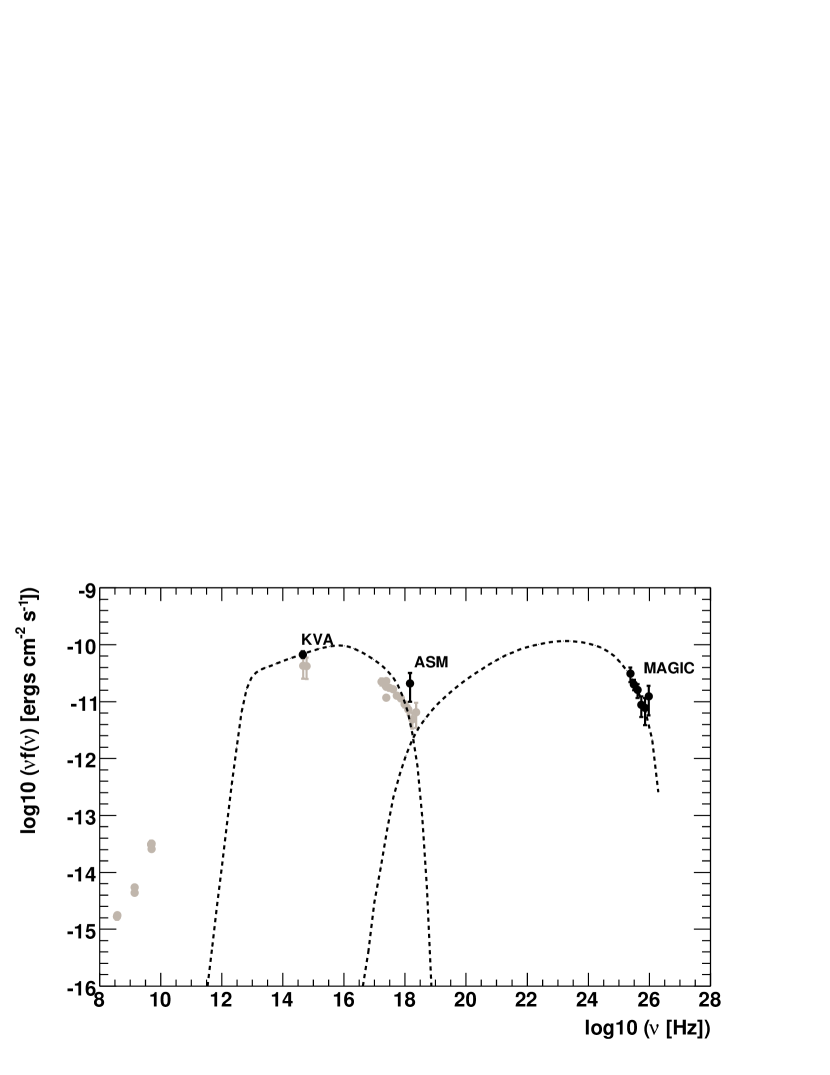
The spectral energy distribution (SED) of PG 1553+113 together with the results from a model calculation are shown in Fig. 4. The VHE data points correspond to the intrinsic spectrum of PG 1553+113 as derived for a redshift of . The black points at low energies denote the average optical and X-ray flux taken at the same time as the MAGIC observations. Non-simultaneous radio, optical and X-ray data were taken from [19]. The solid line shows the result of a model fit to the simultaneously recorded data (black points) using a homogeneous, one-zone Synchrotron Self-Compton (SSC) model provided by [20]. The -ray, X-ray and optical data are well described by the model. This is not the case for the radio data, where intrinsic absorption requires a much larger emitting volume compared to X-rays and -rays. Except for a somewhat smaller radius of the emitting region, identical model parameters as in [21] have been used: Doppler factor , magnetic field strength , radius of the emitting region , electron energy density , slope of the electron distribution for and for . The limits on some of these parameters indicate the change of the SED model parameters when varying the assumed redshift from up to (parameters without limits were kept constant for all fits). In the case of the SED model cannot accurately describe the data and, based on the obtained value for the SED fit, is excluded on the level.
PG 1553+113 was in a high state in the optical in both years showing a strong flare at the end of March 2006. The high linear polarization of the optical emission () indicates that a sizeable fraction of the optical flux is indeed synchrotron radiation. In -rays only a significant change in the flux level from 2005 to 2006 is found while there is no evidence for variability in X-rays. As a result, a possible correlation between the different energy bands cannot be established. A possible connection between the -ray detection and the optical high state can, however, not be excluded. The optical flare without X-ray or -ray counterpart may still be explained by external-inverse-Compton models which predict a time lag of the X-rays and -rays with respect to the optical emission.
5 SINFONI Near-IR Spectroscopy
Previous attempts to measure the redshift of PG 1553+113 were based on optical spectra. As in near-IR the nucleus outshines the galaxy’s spectral features less than in the optical, archival ESO data taken with the integral-field spectrograph SINFONI [22] at the VLT111Based on observations at the European Southern Observatory VLT (276.B-5036(A)), obtained from the ESO/ST-ECF Science Archive Facility were analyzed. The data were obtained without adaptive optics using the largest field of view ( arcsec) and the H+K grating during four nights in March 2006. We used 135 min of data obtained under good seeing conditions (PSF ) and carefully removed the strong sky background using [23]. No host galaxy was detected in the images and the spectra are featureless, thus no redshift can be determined.
Acknowledgments
We thank the IAC for the excellent working conditions in La Palma and the RXTE team for providing the ASM X-ray data. We further acknowledge the support of BMBF, MPG, INFN, and CICYT. This work was also supported by ETH Research Grant TH-34/04-3 and by Polish Grant MNiI 1P03D01028.
References
- [1] Green, R. F., Schmidt, M., & Liebert, J. 1986, ApJS, 61, 305
- [2] Falomo, R. & Treves, A. 1990, PASP, 102, 1120
- [3] Sbarufatti, B., Treves, A., & Falomo, R., 2005, ApJ, 635, 173;
- [4] Sbarufatti, B., et al., 2006, AJ, 132, 1
- [5] Aharonian, F. et al., 2006, A&A, 448, L19
- [6] Albert, J. et al., 2007 ApJ, 654, L119
- [7] Baixeras, C., et al., 2004, Nucl. Instrum. Meth., A518, 188; Cortina, J. et al., 2005, In 29th ICRC, Pune, India, 5, 359
- [8] Bretz, T. & Wagner, R., 2003, In 28th ICRC, Tsukuba, Japan, 5, 2947
- [9] Gaug, M. et al. 2005, In 29th ICRC, Pune, India, 5, 375 (arXiv:astro-ph/0508274)
- [10] Wagner, R. M., et al., 2005, In 29th ICRC, Pune, India, 4, 163 (arXiv:astro-ph/0508244)
- [11] Breiman, L. 2001, Machine Learning, 45, 5; Bock, R. K., et al., 2004, Nucl. Instrum. Meth., A516, 511
- [12] Knapp, J. & Heck, D., 2004, EAS Simulation with CORSIKA: A Users manual
- [13] Majumdar, P., et al., 2005, In 29th ICRC, Pune, India, 5, 203 (arXiv:astro-ph/0508274)
- [14] Li, T. & Ma, Y. 1983, ApJ, 272, 317
- [15] Mizobuchi, S., et al., 2005, In 29th ICRC, Pune, India, 5, 323 (arXiv:astro-ph/0508274)
- [16] Kneiske, T. M., et al., 2004, A&A, 413, 807
- [17] Wagner, R. M., these proceedings (#70) (arXiv:0706.4442 [astro-ph])
- [18] Mazin, D. & Goebel, F., these proc. (#940)
- [19] Giommi, P., Massaro, E., & Palumbo, G. 2002, In Blazar Astrophysics with BeppoSAX and other Observatories, 2002, 63, 100
- [20] Krawczynski, H., et al. 2004, ApJ, 601, 151
- [21] Costamante L. & Ghisellini, G. 2002, A&A, 384, 56
- [22] Eisenhauer, F., et al., 2003, SPIE, 4841, 1548
- [23] Davies, R. I., 2007, MNRAS, 375, 1099