Life in the last lane: Star formation and chemical evolution in an extremely gas-rich dwarf
Abstract
We present an analysis of HI, H, and oxygen abundance data for NGC 3741. This galaxy has a very extended gas disk ( 8.8 times the Holmberg radius), and a dark to luminous (i.e. stellar) mass ratio of , which makes it one of the “darkest” dwarf irregular galaxies known. However its ratio of baryons (i.e. gas + stellar) mass to dark mass is typical of that in galaxies. Our new high-resolution HI images of the galaxy show evidence for a large scale (purely gaseous) spiral arm and central bar. From our HI data, a rotation curve can be derived out to 37 44 disk scale lengths in the J and B band respectively. This is just slightly short of the radius at which one would expect an NFW type rotation curve to start falling. The galaxy has an integrated star formation rate of 0.0034 M⊙ yr-1, while the average star formation rate within the optical disk is 0.0049 M⊙ yr-1 kpc-2. Despite the gaseous spiral feature and the on-going star formation, we find that the global gas density in NGC 3741 is significantly lower than the Toomre instability criterion. This is consistent with the behaviour seen in other dwarf galaxies. We also find that the star formation rate is consistent with that expected from the observed correlations between HI mass and SFR and the global Kennicutt-Schmidt law respectively. We measure the oxygen abundance to be 12+ log(O/H)=7.660.10, which is consistent with that expected from the metallicity-luminosity relation, despite its extreme gas mass ratio. We also examine the issue of chemical evolution of NGC 3741 in the context of closed-box model of chemical evolution. The effective oxygen yield of NGC 3741 is consistent with recent model estimates of closed-box yields, provided one assumes that the gas has been efficiently mixed all the way to edge of the HI disk (i.e. times the optical radius). This seems a priori unlikely. On the other hand, using a sample of galaxies with both interferometric HI maps and chemical abundance measurements, we find that the effective yield is anti-correlated with the total dynamical mass, as expected in leaky box models.
keywords:
galaxies: dwarf - galaxies: kinematics and dynamics – galaxies: individual: NGC 3741 radio lines: galaxies1 Introduction
The processes that govern the conversion of gas to stars in galaxies are complicated and poorly understood. Nonetheless, there do exist empirical star formation recipes which are widely applied to models of galaxy evolution. Typically, these recipes allow one to compute a global star formation rate given the gas column density or, alternatively, some estimate of the dynamical timescale (e.g. the angular rotation frequency ). While the existence of such empirical relationships is fairly well established in large galaxies (e.g. Kennicutt 1998), it is unclear whether these are applicable to the smallest dwarf galaxies (e.g. Begum et al., 2006). However, star formation in such small galaxies is of particular interest in studies of galaxy formation, because, in hierarchical models of galaxy formation, small galaxies form first and then merge to form larger galaxies. Nearby, metal poor dwarf galaxies are, in this sense, analogs of first units of star formation in the universe. Detailed studies (at resolutions that are not achievable for high redshift objects) of the star formation in nearby dwarf galaxies could hence give some insight into the star formation processes occurring in primordial galaxies at high redshifts.
We have been conducting a systematic multi-wavelength survey (the Faint Irregular Galaxy GMRT Survey – FIGGS (Begum et al., 2006) of nearby dwarf galaxies. This survey revealed the truly unusual properties of NGC 3741, with an HI disk that extends to more than 8 times its Holmberg radius (Begum et al., 2005, henceforth Paper I). NGC 3741 has the most extended gas disk known. Further, with the observed M, NGC 3741 is also one of the most gas-rich dwarf galaxies known. In Paper I we presented a rotation curve for NGC 3741 that extended out to optical B band scale lengths (Bremnes et al. 2000) and showed that within the last measured point of the rotation curve, the dark matter in NGC 3741 contributes to 92 % of its total dynamical mass, whereas stars contribute only 1% of the total mass. On the other hand, we also found that its total baryonic (i.e. HI + stellar mass) to dark matter ratio of falls within the range that is typical of galaxies (; Paper I). NGC 3741 thus seems to be a case of inefficient star formation, that is worthy of further study.
In this paper we present new HI and H data for NGC 3741. We also estimate the gas-phase oxygen abundance of this galaxy using the spectrophotometric data from Moustakas & Kennicutt (2006). We use these data to study the the relationship between gas and star formation and abundance properties of this very gas-rich galaxy. Throughout the paper, we adopt a distance of 3.03 Mpc, as derived from the tip of the red giant branch (Karachentsev et al. 2003). At this distance 1′′ corresponds to 14.7 pc.
2 Observations and data reduction
2.1 HI Observations
HI observations of NGC 3741 were conducted at the GMRT (Giant Metrewave Radio Telescope), DRAO (Dominion Radio Astrophysical Observatory) Synthesis Telescope and WSRT (Westerbork Synthesis Radio Telescope). A combination of the data from these arrays provides sensitivity to the large-scale, low surface brightness component which could have been missed with the GMRT observations alone, because of missing short spacings at the GMRT. The GMRT observations have been described in detail in Paper I. Here we only note that the final visibility set had 128 spectral channels spread across a 1 MHz bandwidth, i.e. a channel spacing of kms-1. The DRAO observations were made in a ”complete survey” mode (Landecker (2000)). Twelve sets of spacings were used, giving baselines from 12.9 to 604.3 m at 4.3 m intervals. The DRAO data contained 256 spectral channels across a 1 MHz bandwidth, or a channel separation of km s-1. The WSRT observations consisted of a single 12hr observing run in the “maxi-short” configuration taken on 09th Oct, 2005. There were a total of 2048 spectral channels across a 10 MHz bandwidth, for a channel separation of km s-1. The flux calibration was performed using an observations of 3C147, while phase calibration was done using self-calibration on the continuum sources in the field.
A low resolution image was made from combining the GMRT, WSRT and DRAO data. This image was made as follows. After continuum subtraction (using AIPS (Astronomical Image Processing Systems) task UVSUB ) the GMRT, DRAO and WSRT visibility data were exported to MIRIAD where they were regridded onto a common velocity scale using the task “uvaver”. The channel width after regridding was 2.0 km s-1. The regridded visibility data were read back into AIPS and CLEAN cubes were made from each data set using the task IMAGR. The uv range and taper were adjusted for each data set, so as to give a circular beam of resolution. The CLEAN cubes were then corrected for the primary beam attenuation appropriate for each telescope using the task PBCOR in AIPS. These primary beam corrected cubes were then combined (using the weights determined by the rms noise in each cube) to a final combined data cube. Since the rms noises in the DRAO, GMRT and WSRT cubes was 13.6 mJy, 5.5 mJy and 0.96 mJy respectively, the weighted sum is dominated by the WSRT data. Emission in the combined cube is seen over the velocity range 166 293.7 km s-1. In contrast, in the GMRT data alone, emission is detectable only over the range 180.0 283.7 km s-1. In Paper I we only presented a resolution image made from the GMRT data. However since the GMRT has a hybrid configuration, higher resolution images can also be made from the same data. Here we present both and resolution images made from the same data. The rms noise in these data cubes is 1.6 mJy and 1.1 mJy respectively.
2.2 H Observations
Narrow-band H imaging of NGC 3741 was obtained as part of the 11 Mpc H and Ultraviolet Galaxy Survey (11HUGS; Kennicutt et al. 2005, Lee 2006). NGC 3741 was observed on 2001 March 31, using the 2K CCD imager on the Steward Observatory Bok 2.3 m telescope. The onband image was taken through a 3-cavity interference filter with central wavelength 658.5 nm and FWHM 6.6 nm, with an integration time of 1000s. For continuum subtraction the galaxy was observed with a Kron-Cousins filter, with an integration time of 200 s. Details of the observation and data reduction procedures can be found in Lee (2006) and Kennicutt et al. (2007, in preparation).
Raw images were reduced following standard procedures using IRAF111The Image Reduction and Analysis Facility (IRAF) is distributed by the National Optical Astronomy Observatories, which are operated by AURA, Inc. under cooperative agreement with the National Science Foundation.. Astrometric alignment and calibration was performed using reference stars from the USNO-A2 catalog, and flux calibration was performed using observations of spectrophotometric standard stars from Massey et al. (1988).
The processed narrow-band images contain contributions both from H and [NII] line emission as well as underlying stellar continuum (including H absorption). Net emission-line images were obtained by subtracting a scaled image from the narrow-band image, aligning the respective images using foreground stars. Additional small corrections for line emission in the -band image and the wavelength shift between filters were applied, as described in Lee (2006) and Kennicutt et al. (2007). Finally a small correction for [NII] contamination in the image was applied using an integrated spectrum of the galaxy obtained by Moustakas & Kennicutt (2006). The derived total H luminosity for NGC 3741 is erg s-1, which corresponds to a star formation rate (SFR) of 3.4 M⊙yr-1 (using the conversion factor from Kennicutt, 1998).
3 Results
3.1 HI distribution and kinematics
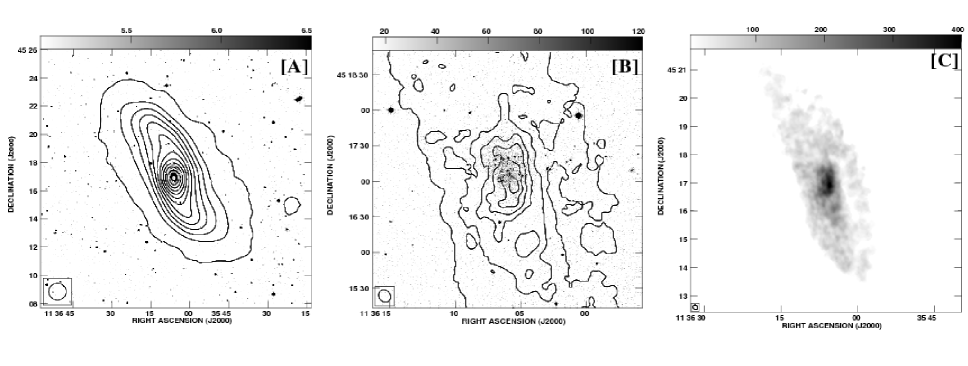
The integrated flux measured from the resolution data cube (see Fig. 1[A]) is Jy km s-1. The HI mass obtained from the integrated profile is , and the ratio is found to be in solar units. This estimate of the HI mass (which is dominated by the WSRT data) is slightly () lower than the value of that was obtained in Paper I. On comparing Fig. 1 with the map made using only the GMRT data (in Figure 1[A] of Paper I), we find that using the combined data set from WSRT, GMRT and DRAO, we could recover the faint, more extended outer envelope of HI distribution. The HI envelope extends to , at a level of cm-2 i.e. 8.8 times the Holmberg diameter, compared to times the Holmberg diameter measured with the GMRT data alone.
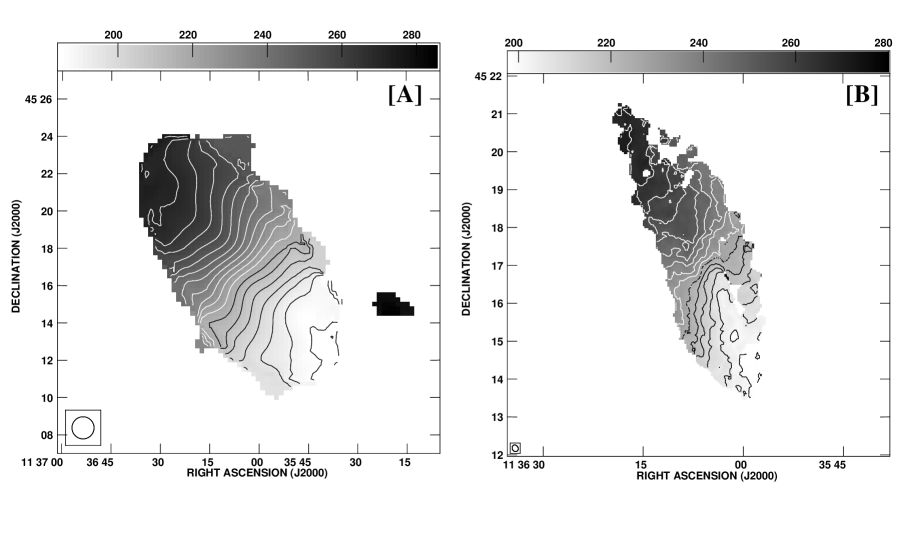
In Paper I we had noted that NGC 3741 seemed to have a central bar, but this is not apparent in the lower resolution image in Fig. 1. On the other hand, the 10 resolution image (Fig. 1[C]) shows the central bar clearly, and also shows a large one sided spiral arm of 9′ (with no stellar counter part) on the western side of the galaxy, emanating from a central bar like region. A presence of an HI bar is also evident in the high resolution velocity field (Figure 2[B] here and Figure.1[B] in Paper I) from the oval distortion of the isovelocity contours in the center of the galaxy. Further, Gentile et al.(2007) also found evidence for a bar at the centre of this galaxy based on a harmonic decomposition of the velocity field. On the other hand, near infra-red images of this galaxy shows no evidence for a stellar bar. Figure. 1[B] shows the 10 resolution HI distribution (contours) overlayed on the J band emission (greyscale) from Vaduvescu et al.(2005). Vaduvescu et al.(2005) estimated an ellipticity and PA of the near infra-red disk emission to be 0.26 and 23 deg respectively. On the other hand, PA and ellipticity of the HI bar derived from 10 resolution HI map is 105 deg and 0.65. Thus, while the optical morphology of NGC 3741 implies a disk structure (Vaduvescu et al.(2005)), our HI data suggest a bar configuration in the center of the galaxy. Such difference in the optical and HI morphology has been noted previously in a blue compact dwarf galaxy NGC 2915 (Meurer et al. 1996).
3.2 HI rotation curve

The rotation curve derived from the GMRT data was presented in Paper I. However, as our combined data reveals a more extended HI disk, we have re-derived the rotation curve for NGC 3741 from 71 resolution velocity field, using the tilted ring model. The derived rotation curve is shown in Fig. 3 as solid circles. Also shown in the figure is the rotation curve derived in Paper I (i.e. from the high resolution GMRT data alone). As can be seen, in the inner region of the galaxy, the rotation curve derived from the high resolution data is significantly steeper, most likely because of beam smearing in the low resolution image. The ‘hybrid’ rotation curve shown as a solid line in Fig. 3 consists of the rotation velocities derived from the high resolution GMRT data in the inner regions, and from the low resolution velocity field from the combined data in the outer regions. The “asymmetric drift correction” was found to be small compared to the errorbars at all radii and hence was ignored. The final adopted rotation curve is measured up to a record 37 44 disk scale lengths in J band and B band, respectively (Vaduvescu et al. 2005, Bremnes et al. 2000).
As noted in Paper I and in Section 3.1, the velocity field of NGC 3741 shows clear signs of non-circular motions. These have not been accounted for in our derivation of the rotation curve. Gentile et al. (2007) used the WSRT data to develop a kinematical model for NGC 3741 to account for the non-circular motions. We find that our rotation curve is systematically higher that Gentile et al. (2007) in the inner regions of the galaxy, but the two curves match within one sigma errorbars. For the remainder of our analysis we have used the ‘hybrid’ rotation curve in Fig. 3, though using the rotation curve by Gentile et al. (2007) does not make any significant difference to our results. The parameters for NGC 3741 derived from the last measured point of the rotation curve, along with other parameters are listed in Table 1. The stellar mass to light ratio in the B band, was derived from the observed colour (B-V)0.36 (Taylor et al. 2005), using from the low metallicity Bruzual Charlot SPS model from Bell de Jong (2001). As discussed in Paper I, there is considerable uncertainty in the mass modelling of NGC 3741 due to the presence of an HI bar in the galaxy, hence obtained from the mass modelling was not considered for obtaining the stellar mass. With MT/LB , NGC 3741 is one of the “darkest” known gas-rich galaxies.It is interesting to note that NGC 3741 belongs to a dwarf galaxy association which is also very dark matter dominant (assuming that the association is bound) (Tully et al. 2006).
| Parameters | Value |
|---|---|
| 1.69 M⊙ | |
| 2.7 L⊙ | |
| 6.26 | |
| Mass-to-light ratio, | 0.51 |
| Stellar mass | 1.38 M⊙ |
| 12.2 | |
| Total dynamical mass () | 4.03 M⊙ |
| 149 | |
| (%) | 95 |
It is interesting to note that for a maximum halo circular speed of 50 kms-1, comparable to the maximum velocity of NGC 3741, the scaling relations in Bullock et al. (2001) indicate that in an NFW type halo, the rotation curve for NGC 3741 would start to decline at a radius of 7.6 kpc. This is just beyond the last measured point of our rotation curve. However the expected decline is very gentle, and in the vicinity of 7.6 kpc is considerably smaller than the error in our rotation curve.
3.3 Star formation in NGC 3741


As discussed in Section 3.2, NGC 3741 has one of the highest known ratios (for a gas-rich galaxy) of total mass to blue luminosity. On the other hand, as discussed in Paper I, its ratio of total baryonic to total dynamical mass lies within the range that is typical for galaxies (Paper I). In this section we use the HI and H data to study the relationship between the star formation, gas distribution and gas kinematics in NGC 3741, in order to understand why the conversion of gas into stars in this galaxy is extremely inefficient.
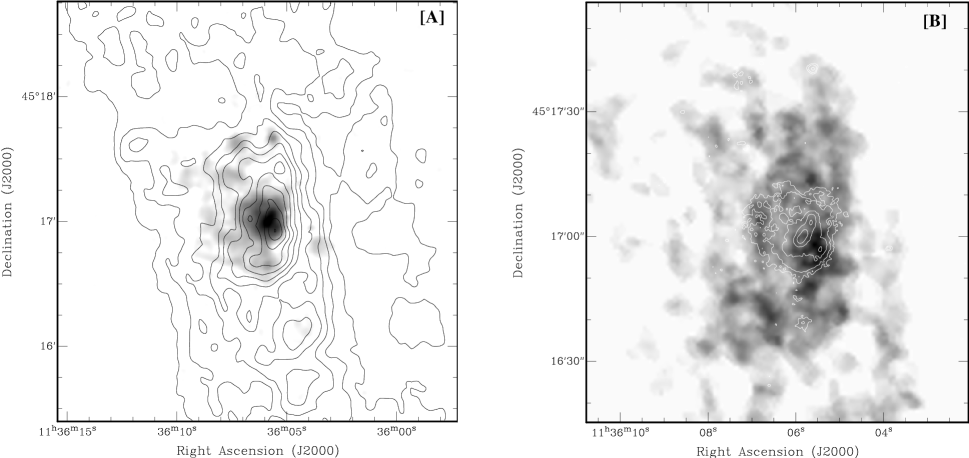
Figure 4[A] shows the HI column density distribution of NGC 3741 at a resolution of 11 (corresponding to a linear scale of 145 pc), overlayed on the H emission (smoothed to a resolution of ) from the galaxy. A broad correspondence between the H emission and high HI column density is seen in Figure 4[A], although the correspondence is far from being one to one. The contour which most closely matches the H emission corresponds to an observed HI column density of cm-2, or an inclination (and primordial He) corrected gas surface density of cm-2. This is similar to the threshold value seen in other dwarf galaxies (e.g. Taylor et al., 1994; Skillman, 1987). Thus, most of the gas disk of NGC 3741 is below the threshold column density required to induce star formation and this could be a reason why it was unable to convert most of its baryons into stars. However, what sets the threshold for star formation seen in NGC 3741?
The existence of a threshold surface gas density () for star formation in galactic disks is usually explained in terms of gravitational instabilities in thin rotating disk (i.e Toomre’s instability criterion; Toomre (1964), Kennicutt 1989), and is given as
| (1) |
where is the velocity dispersion of the gas, is the epicyclic frequency and is a dimensionless constant included to account for a more realistic disk. In order to determine for NGC 3741, we assumed to be 1 initially and determined its value from a comparison of the observed gas surface density and the threshold density. Figure. 6 shows the ratio of the azimuthally averaged gas surface density of NGC 3741, to the threshold density predicted from Toomre’s instability criterion. The gas surface density profile for the galaxy (shown in Fig. 5) has been derived from 11 resolution HI distribution and scaled by 1.3 to account for the primordial He fraction. No correction is made for the molecular gas. In deriving the threshold density, the velocity dispersion was assumed to be constant, and have a value of 8 km s-1, a typical value observed for such faint dwarf galaxies (Begum et al. 2006). As can be seen in Fig. 6, the ratio for NGC 3741 within the star forming disk. For comparison, Kennicutt (1989) for a sample of bright Sc spiral galaxies found 0.67, assuming =6.0 kms-1. Recomputing for spirals (using Eqn. 1), using of 8.0 kms-1 for NGC 3741 gives 0.5. Thus, NGC 3741’s star forming gas disk appears to be apparently 2 times more stable, compared to spiral galaxies, as per the Toomre’s criterion. This result suggest that, unlike spiral galaxies, Toomre’s instability does not trace star formation in NGC3741. This is consistent with the behaviour seen in other dwarf galaxies, e.g. vanZee et al. (1997); Hunter et al. (1998); Begum et al. (2006). The exclusion of molecular gas in our analysis may have caused an underestimation of . However, for Toomre’s criterion to work for NGC 3741 requires as much molecular gas as the atomic gas present within the star forming disk of this galaxy, which seems a priori unlikely. Sensitive observations of molecular gas in NGC 3741 are thus required to resolve this issue. Further, Toomre’s stability analysis is based on the assumption that the gas disk is thin, but this might not be the case for NGC 3741 as the outer gas disk is likely to be flaring in addition to being warped. However, in the case of more realistic thick disks, the column density threshold is predicted to be higher by a factor of 1.5, as compared to thin disks ((Hunter et al. 1998, Romeo 1992). Hence, if the gas disk of NGC 3741 is thick (which is more likely to be the case), it should be even more stable to star formation, compared to a thin disk case.
The average star formation rate of NGC 3741 within the optical radius (R25) is 4.86 , computed from the H image, while the average HI mass surface density within the same radius is . These values are consistent with those expected from the observed Kennicutt-Schmidt law for spiral galaxies (Kennicutt, 1998). Further, Taylor & Webster (2005) find that the star formation rate in dwarf galaxies correlates with the total HI mass, albeit with large (i.e. close to a factor of 10) scatter. Figure 7 shows the log of SFR plotted as a function of the HI mass for a sample of galaxies from Karachentsev & Kaisin (2007). NGC 3741 is shown as a solid point in the figure. As seen in the figure, while the total HI mass of M⊙ (see Section 3.1) for NGC 3741 means that it has a lower SFR than the average for dwarf galaxies, the large scatter in the SFR-MHI relation also means that it is not markedly deviant. In the SFR-MHI plane, NGC 3741 lies close to DDO 154 (shown as a open circle), another gas-rich dwarf with a large HI envelope (Carignan & Purton (1998)). Thus, we find that despite having a very extended gas disk, the global star formation properties of NGC 3741 are very similar to that of other dwarf galaxies.
Figure 4[B] shows HI image of NGC 3741 (greyscales) at 4 resolution (corresponding to a linear scale of pc), overlayed on the H emission (contours). At this resolution the HI emission shows substantial fine scale structure, with shell-like, filamentary and clumpy features. One can also see that the H emission is, by and large, offset from the high HI column density, with a general tendency for the H to be surrounded by clumps of high HI column density. This may be either because star formation has created a region of low local column density around it, or because the gas in these regions is either in an ionized or molecular phase.

3.4 Chemical evolution of NGC 3741
| Parameters | Value |
|---|---|
| [OII] 3727 | 1.67 0.20 |
| H (4861 Å) | 1.00 0.07 |
| 5007 | 1.680.11 |
| H (6563 Å) | 2.850.18 |
| 6584 | 0.05 0.20 |
| F(H) (ergs s-1 cm-2) | 123.7 |
| C(H) | 0.000.18 |
| log(R23) | 0.59 0.07 |
| log([OIII])/[OII]) | 0.130.11 |
| log(O/H) | 7.660.10 |
In this section we estimate the HII region (oxygen) abundance of NGC 3741 and study its chemical enrichment in light of the closed-box chemical evolution in galaxies. NGC 3741 has been observed as a part of a spectrophotometric survey of nearby star forming galaxies (Moustakas & Kennicutt, 2006, henceforth MK06). For the details of the spectrophotometric observations and analysis the interested readers are referred to MK06 paper. The integrated emission-line fluxes relative to H, corrected for foreground Galactic extinction and for underlying stellar absorption, as obtained by MK06 are listed in Table 2. To correct the observed line ratios for reddening, the intrinsic case B Balmer line ratios were taken from Osterbrock (1989) assuming n and T K. The value of the logarithmic extinction (or reddening coefficient) at H, C(H) was hence derived from the H/H ratio. The estimated reddening for NGC 3741 was found to be negligible (C(H)=2.6 ).
No [OIII]4363 was detected in NGC 3741, hence in the absence of the measurement of I([OIII]), the oxygen abundance of the galaxy was estimated using the bright emission lines [OII] and [OIII], using a grid of photo-ionization models developed by McGaugh (1991). In such models R23=[I([OII])+I([OIII])]/I(H) and [OIII]/[OII] ratios are used to derived an empirical estimate of the oxygen abundance. As R23 is double valued, the degeneracy of the R23 relation was broken by inspecting the value of [NII]/[OII] ratio (van Zee et al. 1998). For NGC 3741 log([NII]/[OII]), hence the low-abundance branch of the model grid of the R23 relation from McGaugh (1991) was considered. The derived ratios for NGC 3741 are listed in Table 2. The oxygen abundance derived using the bright line calibration was hence found to be 12+ log(O/H)= 7.660.10. The uncertainty in this estimate also includes the uncertainty in the model calibrations of the semiemperical relation between line strength and elemental abundance for log(O/H) (McGaugh 1991).

Figure 8 shows the absolute B magnitude for NGC 3741, plotted against the derived oxygen abundance. The same quantity is also plotted for a sample of galaxies compiled from literature; the sample from which these galaxies have been drawn are listed in the figure caption. The solid line with the slope and intercept of ( 0.110.01, 6.240.16) respectively, shows the best fit to the data. As can be seen NGC 3741 follows the metallicity-luminosity relation as defined by other dwarf galaxies.
We will now compare the derived oxygen abundance and gas fraction of NGC 3741 with expectations from the closed-box chemical evolution in galaxies. In a closed-box model the baryonic gas mass fraction (the ratio of the gas mass to the total mass in gas and stars) and the gas-phase abundance (Z) are related as
| (2) |
where p is the elemental yield by mass. The effective yield, peff, is defined as the yield that would be deduced if the galaxy was assumed to be a simple closed-box. In order to compute for estimating peff, we need to know the amount of gas that could participate in star formation. For galaxies with extended HI disks whether to compute using the entire HI mass or just the HI mass within the optical disk is an important issue (Garnett 2002). We computed peff for the two limiting cases i.e. (i) using the entire HI mass and (ii) using only the HI mass within the optical disk. The effective yield of oxygen for NGC 3741, using the entire HI mass, is found to be p (derived using the parameters in Table. 1). In the model used by vanZee & Haynes (2006) (henceforth VH06), this yield is consistent (within the errorbars) with the theoretically expected closed-box yield of p=0.0074 (Meynet & Maeder, 2002). On the other hand, using only the HI mass within the optical disk, the derived p is much lower than that expected from closed-box chemical evolution.


If interpreted literally, the above exercise would suggest that NGC 3741 is evolving as a closed-box model, provided that the gas-phase metallicity in the inner disk is the same as the outer disk, i.e. that there is an efficient mixing of the metals throughout the HI disk. However this seems unlikely, given the large size of the HI disk. Tassis et al. (2006) showed that the mixing length of metals in a galaxy increases with a decrease in the galaxy mass. However, whether there is mixing of metals even up to 14 times its optical extent is unclear. On the other hand, what evidence do we have for closed-box chemical evolution in dwarf galaxies ? And can one from the observational data try to make inferences about how much of the HI disk participates in the chemical evolution (i.e. is well mixed)? The gravitational binding energy of faint dwarf irregular galaxies is not much larger than the energy output from a few supernovae, hence a priori, one might expect that low mass galaxies would depart from the closed-box chemical evolution, since enriched material could escape via stellar winds and supernova ejecta (Brooks et al. 2007). We searched the literature for the HI interferometric images for the galaxies in VH06 sample and show in Fig. 9[A] the effective yield plotted as a function of the HI extent of a sample of galaxies in VH06 sample with available HI images (the sources of the HI images is given in the figure caption). The effective yield is computed by considering the entire gas mass. NGC 3741 and DDO154 are shown in the plot with extreme values of the HI extent. As can be seen, there are some galaxies in the sample which are consistent with the closed-box model. However there is no clear trend seen between the effective yield and the extent of the HI disk. Figure 9[B] shows the effective yield for the same sample of galaxies as shown in Fig. 9[A], however this time the effective yield is computed by considering the gas fraction within the Holmberg radius. As can be seen, if the effective yield is computed within the Holmberg radius, (as would be appropriate in the case of inefficient mixing) none of these galaxies follow a closed-box model.
The theoretically expected closed-box chemical yield depends on assumptions about the IMF, stellar rotation as well as in details of stellar evolution models (Meynet & Maeder, 2002). It may be more instructive hence to look for trends in the effective yield as a function of other galaxy properties, instead of comparing the observed yield against a model dependent expected yield. One possible parameter to use for such a correlation is the total dynamical mass. VH06 did not find any significant trend between the dynamical mass and effective yield for the galaxies in their sample, however they computed the dynamical mass using the HI global velocity widths. We recomputed the dynamical masses for the galaxies in VH06 sample for which rotation curves are available in literature. We show in Fig. 10 a plot of the effective yield against the total dynamical mass. The effective yield computed using the entire HI mass is shown as cross, while the effective yield computed using the HI mass within the Holmberg radius is shown as solid points. As can be seen, in both cases the effective yield increases with increasing dynamical mass. The correlation is tighter if one uses the only HI mass within the Holmberg radius (correlation coefficient is 0.59) compared to using the entire HI mass (correlation coefficient is 0.47), suggesting that, if this model were to be correct, only the gas within the optical disk participates in the chemical evolution of the galaxy. However we note that the total number of galaxies in our analysis is too small to make any statistical conclusion. Spectroscopic observations of a large sample of dwarf galaxies along with a knowledge of the gas distribution is hence required for a better understanding of chemical enrichment and mixing of enriched material in gas-rich, low mass galaxies.
In summary, we examine the dark and luminous matter in NGC 3741. Although this galaxy has one of the highest known ratios of dark to luminous (i.e. stellar) matter, its baryons to dark matter ratio is typical of that of galaxies. In its global star formation properties however, the galaxy appears to follow the trends defined by other dwarf galaxies. Given the large observed scatter about these mean trends, it is perhaps not very surprising that NGC 3741 is not very markedly discrepant. Finally we examine the issue of chemical evolution via a closed-box model. The effective oxygen yield of NGC 3741 is that expected from theoretical models, provided one assumes that there is efficient mixing of the gas times further than the end of the optical disk. This seems apriori unlikely. On the other hand, using a sample of galaxies with both interferometric HI maps and chemical abundance measurements, we find that the effective yield is anti-correlated with the total dynamical mass, as expected in leaky box models.
Acknowledgments
We are very thankful to Prof Liese van Zee for discussions regarding the effective yield of dwarf galaxies. We thank Dr. G. Gentile for providing the rotation curve of NGC 3741 derived from the WSRT data. Thanks to Dr Christy Tremonti and Dr Shoko Sakai for useful comments on this paper. Partial support for this work was provided by ILTP grant B-3.13. The Westerbork Synthesis Radio Telescope is operated by the ASTRON (Netherlands Foundation for Research in Astronomy) with support from the Netherlands Foundation for Scientific Research NWO. The GMRT is operated by the National Center for Radio Astrophysics of the Tata Institute of Fundamental Research.
References
- Begum et al. (2006) Begum, A., Chengalur, J. N., Karachentsev I. D., Kaisin, S. S. & Sharina, M. E. 2006, MNRAS, 365, 1220
- Begum et al. (2005) Begum, A., Chengalur, J. N. & Karachentsev I. D., 2005, A&A, 433, L1
- Begum & Chengalur (2003) Begum, A. & Chengalur, J. N., 2003, A&A, 409, 879
- Bell & de Jong (2001) Bell, E. F. & de Jong, R. S., 2001, ApJ, 550, 212
- Bremnes et al. (2000) Bremnes, T., Binggeli, B. & Prugniel, P., 2000, A&AS, 141, 211
- Brooks et al. (2007) Brooks et al. 2007, ApJ, 655, L17
- Bullock et al. (2001) Bullock, J. S., Dekel, A., Kolatt, T. S., Kravtsov, A. V., Klypin, A. A., Porciani, C. & Primack, J. R. 2001, ApJ, 555, 240
- Carignan & Purton (1998) Carignan C. & Purton C., 1998, ApJ, 506, 125
- Garnett (2002) Garnett, D. R., 2002, ApJ, 581, 1019
- Gentile et al. (2007) Gentile, G., Salucci, P., Klein, U. & Granato, G., 2007, MNRAS, 375, 199
- Hunter et al. (1998) Hunter, D. A., Elmegreen, B. G. & Baker, A. L., 1998, ApJ, 493, 595
- Karachentsev & Kaisin (2007) Karachentsev, I. D. & Kaisin, S. S., 2007, AJ, 133, 1883
- Karachentsev et al. (2003) Karachentsev et al., 2003, A&A, 398, 467
- Kennicutt et al. (2005) Kennicutt, R. C., Lee, J. C., Akiyama, S., Funes, J. G. & Sakai, S., 2005,AIP Conference Proceedings, 783, 3
- Kennicutt (1998) Kennicutt, R. C., 1998, ARA&A, 36, 189
- Kennicutt (1989) Kennicutt, R. C., 1989, ApJ, 344, 685
- Landecker et al. (2000) Landecker, T. L., et al. 2000, A&AS, 145, 509
- Lee et al. (2007) Lee, H., Zucker, D. B. & Grebel, E. K., 2007, MNRAS, 376, 820
- Lee (2006) Lee, J. C., 2006, PhD Thesis, University of Arizona
- Massey et al. (1998) Massey, P., Strobel, K., Bames, J. V. & Anderson, E., 1988, ApJ, 328, 315
- Meurer et al. (1996) Meurer, G. R., Carignan, C., Beaulieu, S. F. & Freeman, K. C., 1996, AJ, 111, 1551
- McGaugh (1991) McGaugh, S. S., 1991, ApJ, 380, 140
- Meynet & Maeder (2002) Maynet, G. & Maeder, A., 2002, A&A, 390, 561
- Moustakas & Kennicutt (2006) Moustakas, J. & Kennicutt, R. C., 2006, ApJS, 164, 81
- Osterbrock, D. E. (1989) Osterbrock, D. E., 1989, Astrophysics of Gaseous Nebulae and Active Galactic Nuclei (Mill Valley CA: University Science)
- Romeo, A. B. (1992) Romeo, A. B., 1992, MNRAS, 256, 307
- Skillman (1987) Skillman, E. D., 1987, in Star Formation in Galaxies, edited by C. J. Lonsdale Persson, NASA, 263
- Swaters et al. (2002) Swaters, R., van Albada, T. S., van der Hulst, J. M. & Sancisi, R., 2002, A&A, 390, 829
- Tassis et al. (2006) Tassis, K., Kravitsov, A. V. & Gnedin, N. Y., 2006, astro-ph/0609763
- Toomre (1964) Toomre, A., 1964, ApJ, 139, 1217
- Taylor et al. (2005) Taylor, V. A., Jansen, R. A., Windhorst, R. A., Odewahn, S. C. & Hibbard, J. E., 2005, ApJ, 630, 784
- Taylor & Webster (2005) Taylor, E. N. & Webster, R. L., 2005, ApJ, 634, 1067
- Taylor et al. (1994) Taylor C. L., Brinks E., Pogge R. W., Skillman E. D., 1994, AJ, 107, 971
- Tully et al. (2006) Tully et al. 2006, AJ, 132, 729
- Vaduvescu et al. (2005) Vaduvescu, O., McCall, M. L., Richer, M. G. & Fingerhut, R. L., 2005, AJ, 130, 1593
- vanZee & Haynes (2006) van Zee, L. & Haynes, M. P., 2006, ApJ, 636, 214
- vanZee et al. (1997) van Zee, L., Haynes, M. P., Salzer, J. J. & Broeils, A. H., 1997, AJ, 113 1618
- vanZee et al. (1998) van Zee, Salzer, J. J., Haynes, M. P., O’Donoghue, A. A. & Balonek, T. J., 1998, AJ, 116, 2805