Behavior of some characteristics of EAS in the region of knee and ankle of spectrum
Abstract
The energy dependence of such characteristics as a ratio of the total number of charged particles to the total flux of EAS Cherenkov radiation, a ratio of GeV muon flux density at the distance of m from a shower core to charged particle flux density, a ratio of the energy transferred to the electromagnetic component of EAS to the primary particle energy is presented. Their comparison with two-component mass composition of cosmic rays (p-Fe) in the framework of calculations by a QGSJET model is given.
I Introduction
The irregularities in the cosmic ray (CR) energy spectrum of “knee” type at eV and “ankle” type at eV found in ref1 ; ref2 are yet of special interest from the point of view of interpretation of these phenomena from the position of astrophysics. In recent years a few papers ref3 ; ref4 ; ref5 have been published which try to explain such a behavior of CR spectrum with the help of new models of generation and propagation of CRs. There exists also another namely a nuclear-physical point of view for the formation of irregularity at eV ref6 ; ref7 . In some sense, the answer to the problem on reasons of the formation of breaks is in the detailed study of different EAS characteristics in the region of the first and second irregularities in the spectrum. We have made such a work in ref8 ; ref9 ; ref10 ; ref11 ; ref12 ; ref13 .
II EAS characteristics in the superhigh energy region
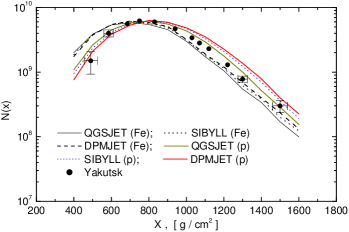
Longitudinal development
The cascade curves of EAS development in Fig.1 were reconstructed according to the method suggested in ref14 . It is seen from Fig.1 that the maximum depth of cascade curves depends on the primary particle mass composition as well as the hadron interaction model. It is seen from Fig.1 that to describe the experimental cascade curve (, ) the QGSJET model is better-suited ref15 . So we use this model for the estimation of mass composition of primary particles. Fig.2 presents the calculations of the maximum depth using the QGSJET model for the primary proton and iron nucleus, and experimental data obtained at the Yakutsk EAS array. It is seen that the velocity of shift of to sea level depends on the energy range. In the framework of the QGSJET model the experimental data are indicative of the change of mass composition of primary particles in the energy range eV and at eV.
Radial development
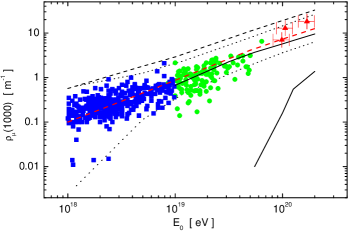
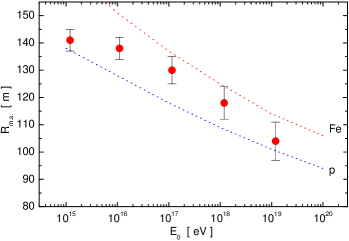
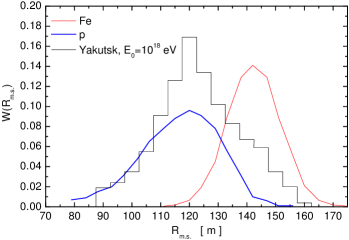
Fig.2 and Fig.3 present experimental data: a) the density of muons with GeV at a distance of 1000 m from the shower core ref11 , b) the root-mean-square radius of charged particle (LDF) ref12 . These data are compared with calculations using the QGSJET model. Protons, iron nuclei and -quanta are considered as primary particles. A confidence interval taken in calculations is . From Fig.3 it follows that in the energy range eV within the boundaries of confidence there are % of showers for the iron nucleus and % for the proton. At eV the portion of iron nuclei decreases, the per cent of protons and -quanta increases. It is seen from Fig.3 that the “heaviest” mass composition is observed at eV.
Correlation of EAS parameters
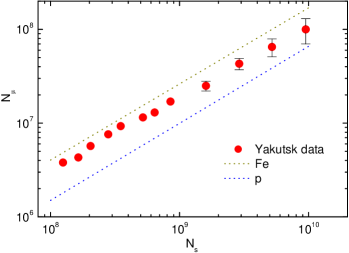
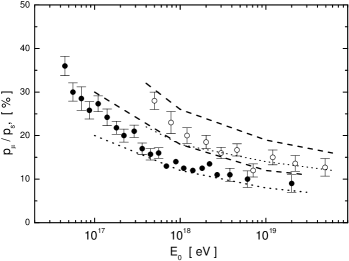
The most sensitive instrument for the model of hadron interactions and mass composition of primary particles is the EAS muon component. At the Yakutsk complex EAS array the muons with GeV are measured by a shower registration in 70 % cases. Fig.4 presents the correlation of parameters and Fig.5 gives the portion of muons (ratio of muons to all charged particles) at a distance of 300 m and 600 m from the shower core. In the same place the calculations by the QGSJET model are given. The tendency for an increase of light nuclei in the cosmic ray primary flux at eV is marked by these data.
Energetic EAS characteristics
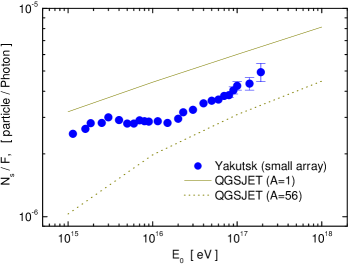
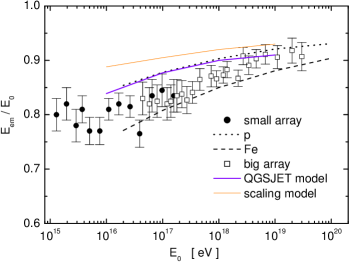
At the Yakutsk complex EAS array the shower energy is determined by measurements of the total flux of EAS Cherenkov light , the total number of charged particles, , and muons, , at sea level ref16 . Fig.6 presents the energy-dependence of ratio. It is seen from calculations that the ratio strongly depends on a mass composition. From comparison of the calculations by the QGSJET model for the proton, iron nucleus and experimental data it follows that the mass composition changes just after the first knee in the spectrum, i.e. in the interval eV. It is evident from Fig.7 where the portion of energy transmitted in to the electromagnetic EAS cascade is shown.
Fluctuations of some EAS parameters
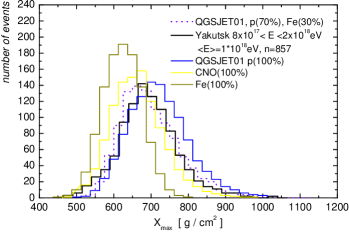
In this section we consider the fluctuations of and obtained by the measurement of Cherenkov EAS light and density of charged particle flux (see Fig.8 and Fig.9). In both cases at eV fluctuations are considerable and correspond to the mixed mass composition of primary particles. From comparison with calculations by the QGSJET model we have the following relationship: the light nuclei are % and heavy nuclei are % (see the dotted line in Fig.8).
III Results and Discussion
At the Yakutsk complex array for almost the 35-year period of continuous observations the unique experimental data on electron, muon and Cherenkov EAS components in the region of superhigh and ultrahigh energies have been accumulated. Results on longitudinal and radial development of EAS are presented in figures. From the total combination of data one can select two energy regions where, as is seen from Figures, the characteristics of EAS have the complex dependence on the energy. This is the energy ranges eV and eV. As is known, in these energy ranges the irregularities of “knee” and “ankle” in the energy spectrum of EAS are observed.
From the comparison of all experimental data with calculations by the QGSJET model in ref17 the results of the cosmic ray mass composition in the energy range eV have been obtained. It follows from the analysis that after the “knee” the mass composition becomes heavier and in the region of “ankle”, on the contrary, becomes lighter. Such a conclusion doesn’t contradict the hypothesis on a cosmic ray generation up to the energy eV in our Galaxy and their propagation according to the model of anomalous diffusion in the fractal interstellar medium. Beginning with eV the mass composition becomes lighter and it doesn’t contradict the presence of cosmic rays metagalactic origin in the total flux of cosmic rays.
References
- (1) S. N Vernov et al. Cosmic rays and cosmophysics problems. Novosibirsk: SO AN USSR, 1964, pp. 103–110. (in Russian)
- (2) M. N. Dyakonov et al. Izv. AN USSR, ser. iz. v. 42, p. 1449, 1978. (in Russian)
- (3) A. A. Lagutin et al. Proc. 27th ICRC (Hamburg). 2001. v. 5. pp 1896–1899.
- (4) E. G. Berezhko et al. Astron. and Astroph. p. 400. v. 971. 2003.
- (5) V. S. Berezinsky et al. arXiv:astro-ph/0403477; V. S. Berezinsky et al. arXiv:astro-ph/0410650
- (6) A. A. Petrukhin. Nucl. Phys. B(Proc. Suppl.) 151(2006) 57; A. A. Petrukhin. Nucl. Phys. B(Proc. Suppl.) 151(2006) 61.
- (7) Yu. V. Stenkin. Nucl. Phys. B (Proc. Suppl.) 151 (2006) 65 – 68.
- (8) S. P. Knurenko et al. Intern. Journ. of Modern Phys. A. Vol. 20, No. 29 (2005) 6894–6896; S. P. Knurenko et al Izv. RAN. Ser. fiz 69. 363. 2005 (in Russian).
- (9) S. P. Knurenko et al. Intern. Journ. of Modern Phys. A. Vol. 20, No. 29 (2005) 6897–6899.
- (10) S. P. Knurenko et al. Intern. Journ. of Modern Phys. A. Vol. 20, No. 29 (2005) 6900–6902.
- (11) S. P. Knurenko et al. Nucl. Phys. B (Proc. Suppl.) 151 (2006) 92–95.
- (12) S. P. Knurenko et al. arXiv:astro-ph/0611871
- (13) S. P. Knurenko et al. Izv. RAN. Ser. fiz. 69. 363. 2007 (in Russian).
- (14) S. P. Knurenko et al. Proc. 27th ICRC (Hamburg). 2001. V. 1. P. 157–160.
- (15) N. N. Kalmykov et al. Nucl. Phys. B (Proc. Suppl.). 52 (1997) 17–28.
- (16) S. P. Knurenko et al. Pisma v ZhETF. 2006, V.83, No. 11, p. 563–567.
- (17) S. P. Knurenko et al. Proc. 30th ICRC (Merida). He. 1. 2. A. 2007. (to be published).