Neutron Interactions as Seen by A Segmented Germanium Detector
Abstract
The GERmanium Detector Array, GERDA, is designed for the search for “neutrinoless double beta decay” (02) with germanium detectors enriched in 76Ge. An 18-fold segmented prototype detector for GERDA Phase II was exposed to an AmBe neutron source to improve the understanding of neutron induced backgrounds. Neutron interactions with the germanium isotopes themselves and in the surrounding materials were studied. Segment information is used to identify neutron induced peaks in the recorded energy spectra.
The Geant4 based simulation package MaGe is used to simulate the experiment. Though many photon peaks from germanium isotopes excited by neutrons are correctly described by Geant4, some physics processes were identified as being incorrectly treated or even missing.
keywords:
double beta decay , germanium detector , segmentation , neutron interactionPACS:
23.40.-s , 14.60Pq , 28.20.-v , 29.40.-n, , , , ,
1 Introduction
The GERDA (GERmanium Detector Array) experiment [1], designed for the search for “neutrinoless double beta decay” (02), is currently under construction in Hall A of the INFN Gran Sasso National Laboratory (LNGS), Italy. Neutrons produced near the germanium detectors by penetrating cosmic-ray muons can induce background events. In addition, neutrons from reactions in the surrounding rock are also a potential source of background. The study of neutron interactions with germanium isotopes as well as the surrounding materials is thus of great interest.
Segmented germanium detectors will be used in GERDA Phase II. It has been shown that segment information is very useful to identify photon induced background [2]. It is interesting to check if segment information can also help with the identification of neutron induced background.
In order to study the issues mentioned above, a GERDA Phase II 18-fold segmented prototype detector [3] was exposed to an AmBe neutron source. Energy spectra were recorded for each segment and the core. The segment information was used to identify peaks induced by neutron interactions.
2 Experimental Setup and Data Sets
The detector used is the first segmented GERDA prototype detector. The true coaxial cylindrical crystal has a height of 70 mm and a diameter of 75 mm with a 10 mm hole in the center. It is 18-fold segmented with a 6-fold segmentation in the azimuthal angle and a 3-fold segmentation in the height . It was operated in a conventional test cryostat. Details of the detector and its cryostat can be found in [3].
A 1.1 GBq isotropic AmBe neutron source was used in the experiment. The energy spectrum of the neutrons emitted from the 9BeC∗ nuclear reaction extends to 12 MeV. High resolution measurements of the neutron energy spectra of this kind of neutron source are presented in [8, 9]. The dependence of the emittance of photons from the de-excitation of 12C∗ on the neutron energy is described in [9].
The neutron source was located in a cylindrical paraffin collimator. The schematic experimental setup (not to scale) is shown in Fig. 1. The center of the collimator was vertically aligned to the center of the detector and the distance between source and detector center was about 1 m.
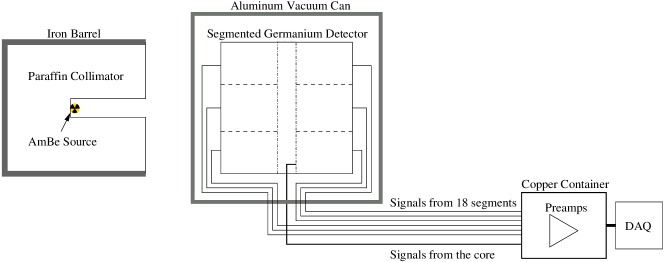
The core and segment electrodes were connected to charge sensitive pre-amplifiers. Their output was digitized using 14-bit ADCs in an XIA Pixie-4 data acquisition system [10] with a sampling rate of 75 MHz, and recorded separately when the core was triggered. Two different gain factors were chosen for four different measurements. The data sets are listed in Tab. 1. A low gain factor was chosen so that the energy range up to MeV could be covered. A high gain factor was chosen for measurements up to MeV.
Two measurements were performed with the AmBe source present. They are referred to as HGdat (High Gain data) and LGdat (Low Gain data). In order to determine the background from the laboratory environment two more measurements without the source were performed. They are referred to as HGbg (High Gain background) and LGbg (Low Gain background). The data samples with different gains were combined for the study below 3 MeV.
| With AmBe Source | Without AmBe Source | |||
|---|---|---|---|---|
| DAQ Gain | High Gain | Low Gain | High Gain | Low Gain |
| [MeV] | 3.5 | 11 | 3.5 | 11 |
| No. of Events | 7.1 M | 4.7 M | 1.5 M | 4.7 M |
| Name | HGdat | LGdat | HGbg | LGbg |
3 Core Spectra
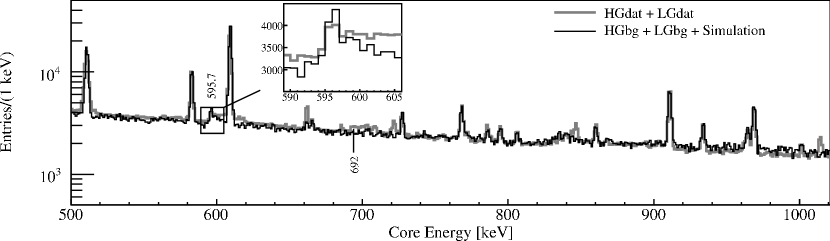
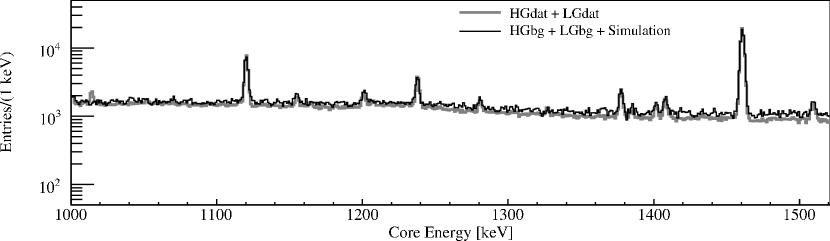
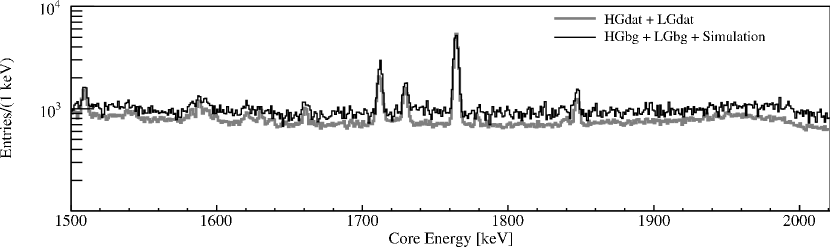
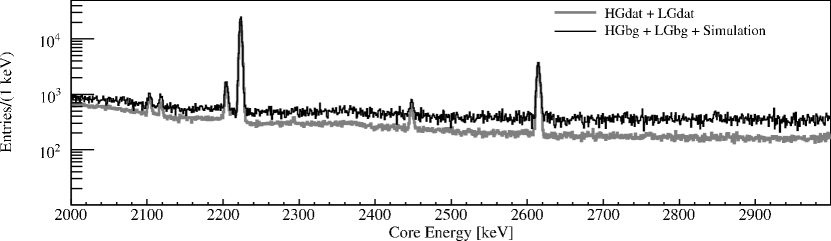
The total energy deposited in the germanium crystal was read out from the core electrode of the detector. Fig. 2 shows the core energy spectra for the data and background in the range of [0.08, 3] MeV. The thick line indicates the sum of HGdat and LGdat. The fine line represents the normalized sum of HGbg and LGbg. The trigger thresholds were set such that the spectra above 100 keV were not affected.
Eight photon peaks from the background were fitted with a Gaussian function plus a first order polynomial to normalize the background to the data. They are associated with the decays of 214Pb (352 keV), 214Bi (609 keV, 1120 keV, 1764 keV, 2448 keV), 228Ac (911 keV), 40K (1461 keV), and 208Tl (2615 keV). The numbers of events in the peaks determined by the fits were used to calculate the data to background ratios. The average of these ratios, , was then used to scale the background spectrum.
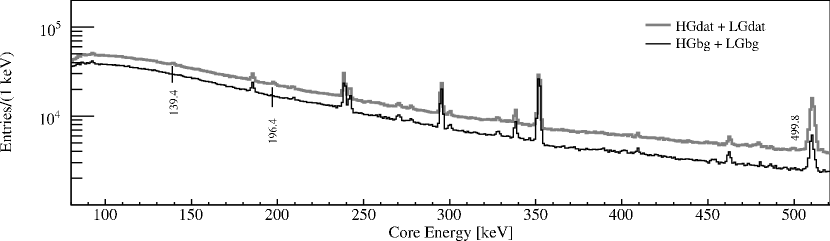
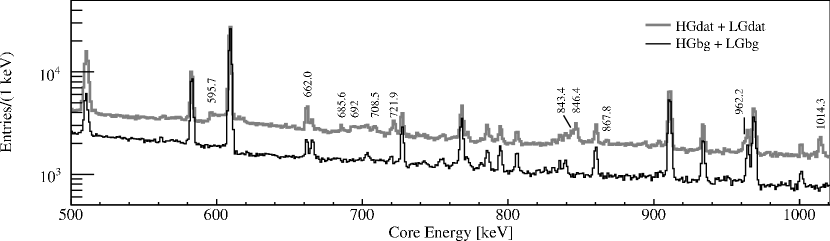
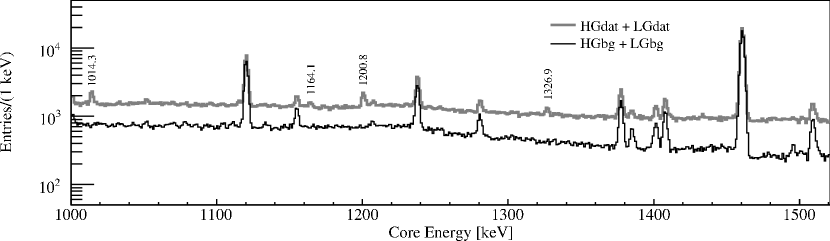
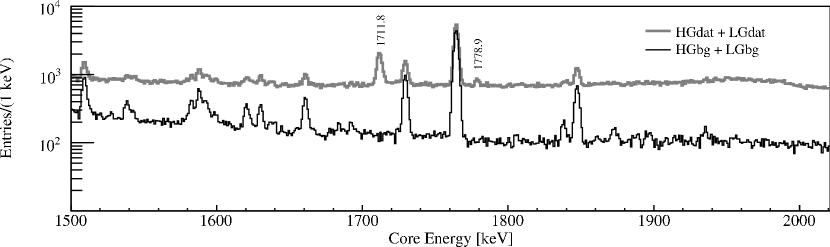
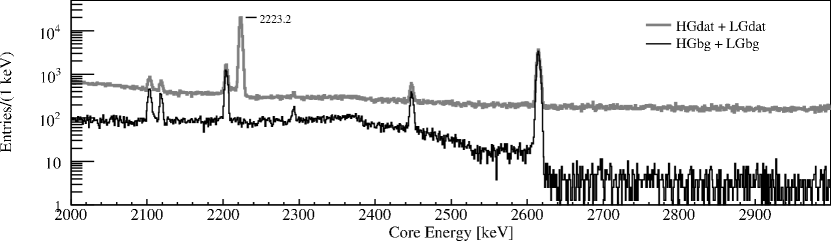
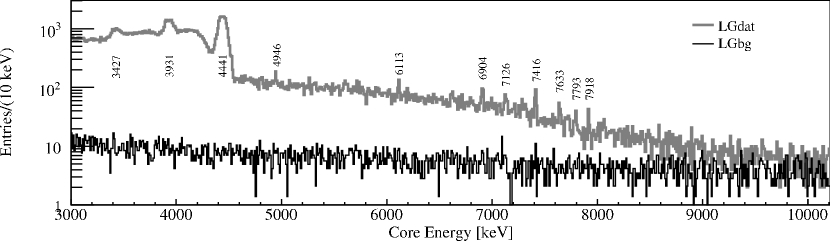
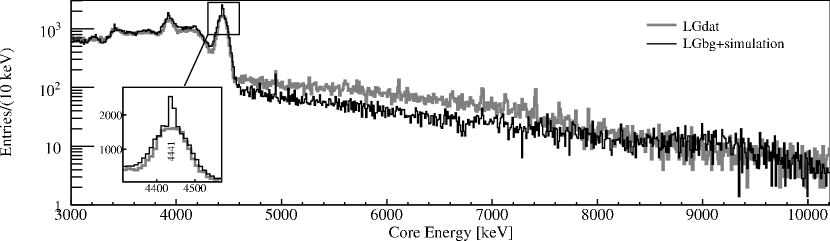
Fig. 3 shows the spectra in the range of [3, 10.2] MeV. In this energy range the background is small, as there are hardly any natural radioactive elements producing photons with such high energies.
4 Neutron Interactions as Seen by the Core
The main interaction mechanisms of neutrons with energies less than 12 MeV are thermal capture, inelastic and elastic scattering. Elastic scattering does not induce peaks that can be identified, because there is no photon emitted and the recoil energy distribution is too flat. Not only the production mechanism of the excited nucleus is important for the identification of a peak. The de-excitation mechanism has also to be taken into account. In most cases the nucleus de-excites instantaneously with the emission of one or more photons. However, it can also undergo internal conversion, in which case an electron from a lower shell is emitted instead of a photon. The excited nucleus can also be meta-stable and not de-excite instantaneously.
Table 2 lists the processes identified in the core energy spectrum. If inelastic scattering happens inside the germanium crystal, the nuclear recoil energy is recorded as well as the energies from some of the prompt photons. In case of instantaneous de-excitation they are summed up: . This causes an asymmetric peak with a long recoil tail on the high energy side. Internal conversions only create identifiable peaks, if they occur inside the crystal, otherwise the emitted electrons do not reach the detector.
| Production | De-excitation | Symbolic Notation | Short Form |
|---|---|---|---|
| instantaneous | ZZ | AZ | |
| thermal capture | meta-stable | ZZ, | AZ |
| (A+1)mZZ | |||
| inelastic | instantaneous | ZZ | AZ |
| scattering | internal conversion | GeGe | AGe |
Table 3, 4 list all the peaks observed in the core energy spectrum due to neutron interactions within the germanium crystal as well as within the surrounding materials: H, C, Cl in the paraffin collimator, iron barrel of the collimator, Al, Ce in the aluminum vacuum can, and copper container of the pre-amplifiers.
Pure photon peaks were fitted with a Gaussian function plus a first order polynomial to get the mean energies, FWHMs and the numbers of events in the peaks. The 596 keV peak from 74Ge does not have a Gaussian distribution. The treatment of this peak will be described in section 5. The 662 keV peak associated with 140Ce has a significant background contribution from 137Cs. This was subtracted. The 692 keV peak from 72Ge is hard to fit because it is asymmetric and broad. It is also contaminated by other peaks nearby. The number of events in this peak was estimated by integration.
The 4.4 MeV peak is due to photons from the de-excitation of 12C∗ created in the AmBe source by the interaction, 9BeC∗. It is Doppler broadened because of the movement of the 12C∗ nuclei. The width of this peak listed in Tab. 4 was determined by the fit. Above 5 MeV the widths of most of the peaks had to be fixed in the fitting procedure due to low statistics. The peaks that are not identified are marked with a question mark.
| Fitted Energy [keV] | Fitted FWHM [keV] | Interaction Type | No. of Events |
|---|---|---|---|
| 139.4 | 74Ge | ||
| 197.9 | 70Ge | ||
| 499.8 | 70Ge | ||
| 595.7 * | - | 74Ge | |
| 662.0 | 140Ce | ||
| 685.6 | ? | ||
| 692 | - | 72Ge | |
| 708.5 | 35ClClAr | ||
| 721.9 | ? | ||
| 843.4 | 27Al | ||
| 846.6 | 56Fe | ||
| 867.8 | 73Ge | ||
| 962.2 | 63Cu | ||
| 1014.3 | 27Al | ||
| 1164.1 | 35Cl | ||
| 1200.8 | DEP of 2223 | ||
| 1326.9 | 63Cu | ||
| 1711.8 | SEP of 2223 | ||
| 1778.9 | 27AlAlSi | ||
| 2223.2 | 1H |
* The fitting of the 596 keV peak is described in a later section.
The background contribution to the 662 keV peak was subtracted.
The number of events in the 692 keV peak was determined by integration.
SEP, DEP stand for Single Escape Peak and Double Escape Peak, respectively.
? The unidentified peaks are marked with a question mark.
| Fitted Energy [keV] | Fitted FWHM [keV] | Interaction Type | No. of Events |
|---|---|---|---|
| 3427 | DEP of 4441 | ||
| 3931 | SEP of 4441 | ||
| 4441 | 9BeC∗ | ||
| 4946 | 12C | ||
| 6113 | 7 | 35Cl | |
| 6904 | 7 | SEP of 7416 | |
| 7126 | 7 | ? | |
| 7416 | 7 | 35Cl | |
| 7633 | 7 | 56Fe | |
| 7793 | 35Cl | ||
| 7918 | 63Cu |
The widths were fixed during the fit.
SEP, DEP stand for Single Escape Peak and Double Escape Peak, respectively.
? The unidentified peaks are marked with a question mark.
5 Neutron Interactions as Seen by the Segments
The energies deposited in each of the segments are read out separately. This provides more information about the interactions inside the germanium crystal than can be extracted from the core signal alone.
For example, a photon with an energy of the order of one MeV has a mean free path of several centimeters in the germanium crystal. It most probably deposits energy in several different segments because of multiple Compton scattering. The result is a multi-segment event, in short MSE. In contrast, if there is only one segment with an energy deposition, it is called a single-segment event, in short SSE. The power of discrimination of MSE and SSE induced by photon using segmented germanium detectors has been shown in [2].
5.1 Neutron Inelastic Scattering
Compared to photon induced events, a special characteristic of neutron inelastic scattering in a germanium crystal is that not only the photon energy, but also the recoil energy, is recorded. The inelastic scattering peak in the core energy spectrum has a high energy recoil tail and, hence, is much less significant than a pure photon peak with the same number of events, as seen in Fig. 2. However, it is possible to partially separate out the recoil energy distribution using information from the individual segments. The disentangled photon peak is much more significant than the original peak. This is due to the way a segmented detector can provide information about event topologies.
Figure 4 shows the three types of events contributing to the inelastic scattering peak in the core spectrum. In all cases the scattered neutron escapes:
-
1.
The nuclear recoil energy and the prompt photon energy are deposited in the same segment;
-
2.
The nuclear recoil energy is deposited within one segment, the prompt photon deposits its energy in several other segments;
-
3.
The nuclear recoil energy is deposited within one segment while the prompt photon deposits its total energy within another segment.

In the first case, only one segment has a signal. The energies recorded by the core and the segment are the same, i.e. . Segmentation cannot help to disentangle the two energies. In the second case, the recoil energy can be observed in one segment. As the photon energy is shared between several segments, there is no peaked distribution in any single segment. This would partially be recovered by segment energy summation. In the third case, the recoil energy is observed in one segment, while the photon is observed in another segment. To disentangle the photon peak from the recoil energy distribution, energy spectra of all the segments are summed to get a spectrum of the energy deposited in any segment. In this spectrum, the type 1 events produce the same distribution as in the core spectrum and type 2 events form a flat distribution. The type 3 events, however, create a sharp photon peak at the original energy and an enhancement in the low energy region, the recoil energy distribution.
Figure 5 shows the any segment spectrum (fine line) together with the core spectrum (thick line) in the relevant energy ranges. Three peaks at 596 keV, 834 keV and 1039 keV, associated with inelastic scattering, 74Ge, 72Ge and 70Ge, respectively, are clearly visible in the any segment spectrum. The latter two are washed out in the core spectrum.
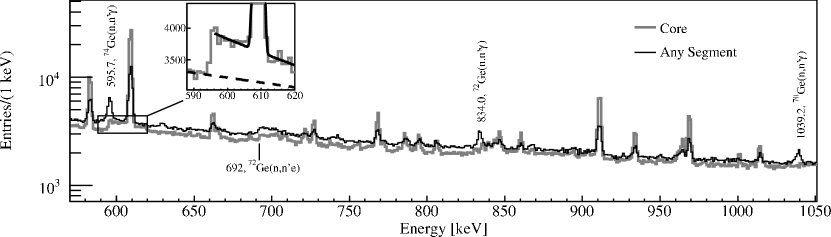
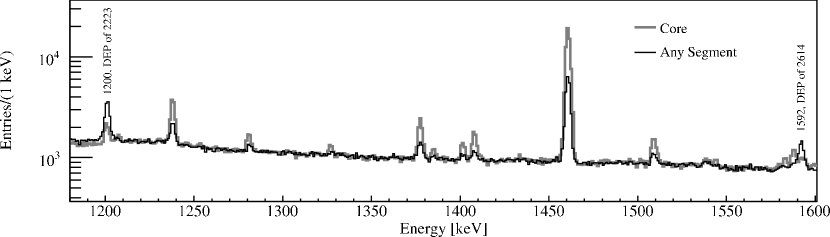
It is possible to extract the number of each type of events in the 596 keV peak. The core spectrum was used to determine the total number of events, . An exponential function was fitted to the shoulder of the peak associated with the nuclear recoil energy distribution. A Gaussian function was fitted to the 609 keV background photon peak on the shoulder simultaneously. The background below the recoil structure was obtained from interpolating the spectrum below and above the shoulder. The total number of events equals to the difference between the fitted exponential and the background. The error was estimated by assuming different levels and shapes of the background. The fit is shown in the inset of Fig. 5. The dashed line represents the background, the solid line shows the exponential plus the Gaussian function from the background peak.
The number of type 3 events, , was obtained by fitting a Gaussian function plus a first order polynomial to the 596 keV peak in the any segment spectrum. The small shoulder caused by the contamination with type 1 events does not change the results of the fit significantly.
The determination of the number of type 1 events requires the study of the peaks purely induced by photons. This provides the probability that a de-excitation photon deposits its energy in exactly one or in multiple segments. The relative strength of the peaks in the core and any segment spectrum, that is, , directly translates to the relative rate of the total number of inelastic scattering events to the sum of type 1 and type 3 events, that is, .
A Gaussian function plus a first order polynomial were fitted to eleven of the most prominent background photon induced peaks in the core and any segment spectra, respectively. The numbers of events in the peaks from the fits were used to calculate the ratio, . The points with error bars in Fig. 6 represent the ratios calculated at different energies. A second order polynomial was fitted to get an estimate of the ratio at any energy, . The number of type 1 events can be calculated as .
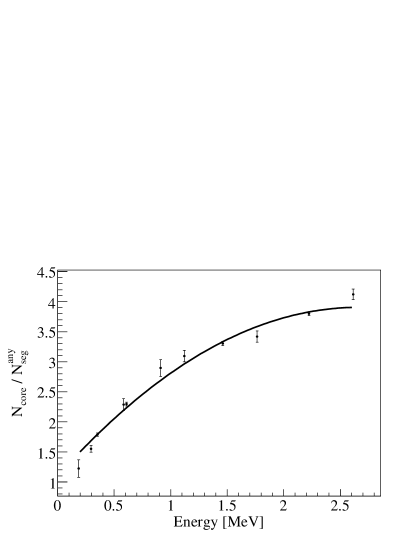
The number of type 2 events can then be calculated as . The results concerning event topologies in the 596 keV peak are listed in the second row of Tab. 5. The percentage of single-segment events, that is, , out of the total number of events is .
| E [keV] | ||||
|---|---|---|---|---|
| 595.8 | ||||
| 834.0 | [0, 380] | [4100, 4700] | [6700, 7700] | |
| 1039.2 | [0, 240] | [2700, 3100] | [4100, 4800] |
The numbers of type 3 events in the 834 keV and 1039 keV peaks were obtained by fitting the any segment spectrum. Since there is no peak at these two energies in the core spectrum, it is impossible to get from a fit. However, since the percentage decreases with energy, at 834 keV and 1039 keV should be less than (596 keV). Taking into account the relation, , the ranges of numbers of events in different topologies in the 834 keV and 1039 keV peaks were calculated. They are listed in Tab. 5 as well.
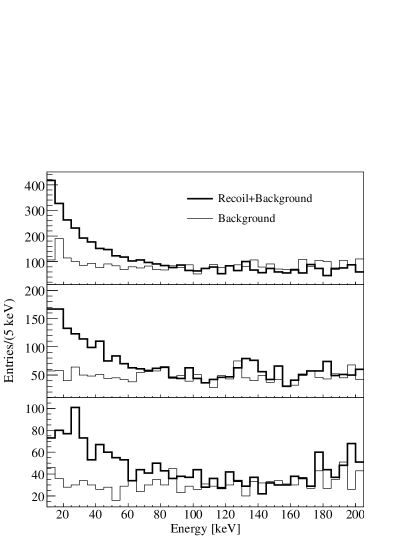
The following steps were used to disentangle the recoil energy spectrum of inelastic scattering with a prompt photon of energy :
-
1.
Exactly two segments having an energy deposition greater than 10 keV were required.
-
2.
If one segment had an energy deposition in the range , where was the detector energy resolution, the energy deposited in the other segment was used.
The following steps produced the background to the recoil spectrum:
-
1.
Exactly two segments having an energy deposition greater than 10 keV were required.
-
2.
Two energy side-bands, and were defined.
-
3.
If one segment had an energy deposition in the side-bands, the energy deposited in the other segment was used.
Fig. 7 shows the disentangled recoil spectra related to the 596 keV, 834 keV and 1039 keV photon peaks. The histograms start at 10 keV. The spectrum is dominated by the electronic noise below. The recoil spectra extending to keV are clearly visible above the background.
5.2 Internal Conversion
If the excited state of a nucleus has the same spin as the ground state, internal conversion [11, 12] is the predominant mode of the de-excitation. Since the mean free path of an electron emitted from internal conversion is about 1 mm in germanium, the energy of the electron and the recoil of the nucleus are deposited in the same segment. The core and the any segment spectra are the same. This is demonstrated in Fig. 5. The 692 keV peak from internal conversion, 72Ge, is neither changed nor suppressed in the any segment spectrum.
5.3 Double Escape Peaks
The double escape peaks are enhanced in the any segment spectrum, because many events from the single escape and full energy peaks in the core spectrum move to this peak. Two enhanced double escape peaks at 1200 keV and 1592 keV are clearly visible in Fig. 5. They originate from the 2223 keV peak of 1H and the 2614 keV peak of 208Tl.
6 Verification of Simulations
MaGe, a C++ simulation package developed by the Monte Carlo groups of the Majorana and Gerda collaborations, was used to simulate the experiment. It is based on Geant4 [4, 5]. The version Geant4 8.2 with patch-01 was used.
6.1 Generator, Geometry and Process
Figure 5 in [8] shows the measured neutron spectrum emitted from an AmBe source. It was normalized to a probability density function and used in the neutron generator to assign energies to the outgoing neutrons. The generator also produced 4.4 MeV photons from the 12C∗ de-excitation inside the AmBe source. The Doppler broadening of the 4.4 MeV peak was simulated by Gaussian smearing with the observed widths taken from Tab. 4.
The geometry of the experiment was implemented according to technical drawings. Approximations in the order of several centimeters had to be made regarding
-
•
the shape and size of the AmBe source and how it is held inside the paraffin collimator,
-
•
the exact relative position between the crystal and the paraffin collimator,
-
•
the exact geometry of the components inside the cryostat.
6.2 Core Spectrum
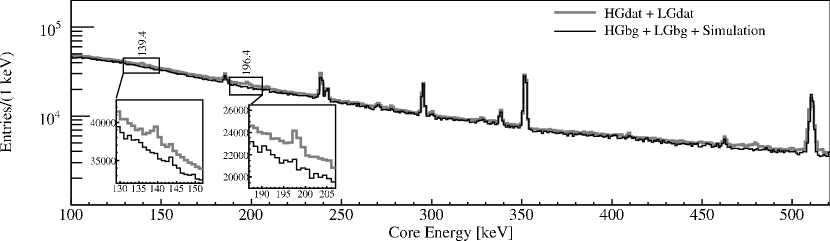
Fig. 8 compares the core spectra of the measurement and the simulation in the range of [0.1, 3] MeV. The threshold effects below 100 keV were not taken into account in the simulation. The thick line is the experimental data. The fine line is the sum of the simulation and measured background. The background was normalized to data as described in section 3. The simulation was normalized to data according to the relation, , where the s are the event numbers in the data, background and simulated spectra. Fig. 9 shows the same spectra in the range of [3, 10.2] MeV.
6.3 Discrepancies between Data and Simulation
The shapes of the continuous spectra from the simulation and data deviate due to the poor knowledge of the exact material and geometry of components between the source and the crystal.
There is a known bug [14] in Geant4 concerning neutron inelastic scatterings. The secondary particles are not boosted back to the laboratory frame after the calculations in the center of mass frame are completed. This causes two problems:
-
•
The simulated recoil energies of the germanium isotopes are wrong.
-
•
The photon peaks from the interactions are not broadened.
The first effect is demonstrated in the third inset of Fig. 8. The measured 596 keV peak from 74Ge has a long tail on the high energy side due to the nuclear recoil, while the simulated peak misses this feature.
The second effect is demonstrated in the inset of Fig. 9. The simulation generates a broad and a narrow peak, both at 4.4 MeV. The broad peak is due to the de-excitation of 12C∗ created in the source. The generator was adjusted according to the data. The narrow one is due to neutron inelastic scattering on carbon atoms in the paraffin collimator, 12C. In reality, the carbon atom can gain a velocity of up to causing a Doppler broadening of the order of 50 keV-100 keV. This is comparable to the broadening in the 12C∗ de-excitation peak, and can, thus, not be resolved in the measured spectrum.
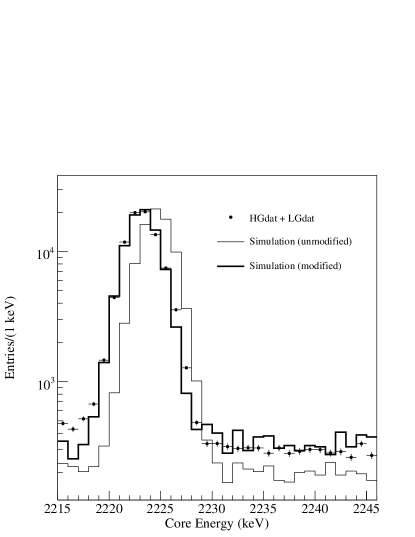
The mean value from the Gaussian fit to the measured 2223 keV photon peak is keV. The simulated peak centers at keV. This shifted value comes from the evaluated neutron data library. This problem has been reported to the Geant4 Problem Tracking System [15]. It was fixed for our studies by changing the value in the database to the measured energy. The result is shown in Fig. 10.
7 Conclusion and Outlook
An 18-fold segmented germanium detector was exposed to an AmBe neutron source and spectra were taken. A number of peaks from neutron interactions on germanium isotopes as well as the surrounding materials were identified. The segment information proved to be very helpful in identifying these peaks. Inelastic neutron scattering produces many events with energy depositions in more than one segment. Hence, the improved understanding of neutron induced interactions can also help to reduce the related background in the decay experiment, GERDA.
The Geant4 based simulation package, MaGe, was used to simulate the experiment. Several discrepancies between data and MC were found. Further verification and improvement of the related Geant4 codes are needed.
The experiment was not shielded from photons originating in the source. This resulted in a low signal (neutron induced peaks) to background (Compton shoulders of high energy photons) ratio. A new experiment including photon shields will be performed to suppress the photon induced background and further investigate the neutron interactions on germanium isotopes.
8 Acknowledgement
The authors would like to thank the GERDA and Majorana Monte Carlo groups for their fruitful collaboration and cooperation on the MaGe project.
References
- [1] S. Schönert et al. [GERDA Collaboration], Nucl. Phys. Proc. Suppl. 145 (2005) 242.
- [2] I. Abt et al., arXiv:nucl-ex/0701005v1, and references therein.
- [3] Iris Abt et al., Nucl. Inst. and Meth. A 577 (2007) 574.
- [4] S. Agostinelli et al., [Geant4 Collaboration], Nucl. Inst. and Meth. A 506 (2003) 250.
- [5] J. Allison et al., IEEE Trans. Nucl. Sci. 53 (2006) 207.
- [6] M. Bauer et al., Journal of Physics, Conf. Series. 39 (2006) 362.
- [7] C. E. Aalseth et al., [MAJORANA Collaboration], Nucl. Phys. B (Proc. Suppl.) 138 (2005) 217.
- [8] J. W. Marsh et all., Nucl. Inst. and Meth. A 366 (1995) 340.
- [9] K. W. Geiger, L. Van Der Zwan, Nucl. Inst. and Meth. 131 (1975) 315.
- [10] Digital Gamma Finder (DGF) PIXIE-4, User’s Manual, X-Ray Instrumentation Associates, http://www.xia.com.
- [11] D. Lister, A. B. Smith, Phys. Rev. 183 (1969) 954.
- [12] J. J. Kraushaar et al., Phys. Rev. 101 (1956) 139.
- [13] K. W. Geiger, L. Van Der Zwan, Nucl. Inst. and Meth. 131 (1975) 315.
- [14] ¡ltx:note¿R¡/ltx:note¿efer to “problem 675” in the Geant4 Problem Tracking System: http://bugzilla-geant4.kek.jp/.
- [15] ¡ltx:note¿R¡/ltx:note¿efer to “problem 955” in the Geant4 Problem Tracking System: http://bugzilla-geant4.kek.jp/.
- [16] ¡ltx:note¿R¡/ltx:note¿efer to “problem 956” in the Geant4 Problem Tracking System: http://bugzilla-geant4.kek.jp/.
- [17] ¡ltx:note¿R¡/ltx:note¿efer to “problem 957” in the Geant4 Problem Tracking System: http://bugzilla-geant4.kek.jp/.