Ignacio Taboada and Michelangelo V. D’Agostino
Physics Dept. University of California. Berkeley, CA 94720
itaboada@berkeley.edu
Abstract
It is standard in theoretical neutrino astrophysics to use a broken
power law approximation, based on the Band function, to describe the
average photon flux of the prompt emission of Gamma-Ray Bursts. We will
show that this approximation overestimates the contribution of high
energy -rays (and underestimates low energy -rays). As a
consequence models that rely on this approximation overestimate neutrino
event rate by a factor of 2 depending on Earth’s column density
in the direction of the GRB. Furthermore the characteristic energy of
neutrinos that trigger a km3 detector is typically 1016 eV,
higher than previously predicted. We also provide a new broken power law
approximation to the Band function and show that it properly represents
the photon spectra.
Gamma-Ray Burst, Neutrinos, Neutrino Telescopes
1 Introduction
It is commonly believed that prompt emission by GRBs is due to synchrotron
radiation by electrons accelerated in internal shocks associated with
relativistic jets (with a bulk Lorentz boost of 100-1000). A review
of the theoretical and observational status of GRBs is beyond the scope of
this paper. The reader is referred to Meszaros (2006). The average
prompt photon emission is often described by fitting a Band function
(Band et al, 1993). High energy neutrino emission by GRBs in
coincidence with the prompt -ray photons has been proposed as a
consequence of GRBs being a candidate to produce (UHE) ultra high energy (up
to 1020 eV) cosmic rays
(Waxman, 1995; Vietri, 1995).
Waxman & Bahcall (1997) have calculated the diffuse flux due to
GRBs. Their work has been further improved by calculating neutrino emission
for individual bursts (Guetta et al, 2004) and by performing detailed
GEANT4 simulations of proton-photon interactions in the internal shocks
(Murase & Nagataki, 2006). This body of work supports the hypothesis that
neutrino detection by km3 Cherenkov detectors will probably be in
coincidence with a handful of bright GRBs.
Previous studies have correlated photon emission with neutrino emission by
approximating the photon spectra with a broken power law. We will show that
this approximation overestimates the contribution of high energy photons (and
conversely underestimates the contribution from low energy photons). This has
consequences in the number of events expected by neutrino telescopes such as
IceCube (Achterberg et al, 2007c) and KM3NET (Kappes et al, 2007) and in the
characteristic energy of the neutrinos detected.
In section §2 we describe the Band function. In section §3 we follow the standard calculation of HE neutrinos
emission from GRBs. In section §4 we compare the Band
function with its broken power law approximation. In section §5 we calculate neutrino event rates. And in section §6 we discuss the consequences of the calculation shown
here.
2 Prompt photon spectra
The time-averaged prompt GRB photon flux is often described by fitting
a Band function (Band et al, 1993):
(1)
The parameters of the Band function are the amplitude , the
(asymptotic) low-energy spectral index , the high-energy
spectral index and the peak energy of the
distribution. Typical values for the parameters above are:
, , 30 keV–1000 keV and 0.001–1
photons cm-2 s-1 keV-1. The break energy
and the peak energy are related by:
(2)
3 Photo-pion production of neutrinos
There are many good descriptions of the processes that lead to HE neutrinos
from prompt GRB photons in the literature. We will not repeat the full
derivation here. Instead we refer the reader to Guetta et al (2004)
and we only present here the major features relevant to this paper.
Protons accelerated in internal shocks interact with GRB photons via the
process:
(3)
and
(4)
Because the photon-proton interaction has to create a resonance, given
a photon energy there is a minimum proton energy for which
Eqs.3 and 4 can take place. In Earth’s reference
frame:
(5)
Correspondingly the neutrinos resulting from Eq.3 have a
minimum energy:
(6)
where is the fraction of the energy
transferred to the charged pion from the initial proton energy and the factor
of 1/4 arises because on average each one of the four final leptons in
Eq.3 has the same energy.
It is customary to approximate the Band function fit to the average photon
spectra as a broken power law (which we label approximation A):
(7)
Supposing that protons have a power law spectrum , the
neutrino spectrum traces Eq.7:
(8)
where , and the
neutrino break energy is taken from the minimum
energy in Eq.6:
(9)
The spectrum is steeper above because of synchrotron energy
losses by charged pions. Typically eV. Muons
also suffer from synchrotron losses, but following usual approximations we
ignore this effect.
The neutrino flux normalization is obtained by supposing that the
neutrino fluence (ignoring synchrotron losses) is proportional to the
bolometric photon fluence, :
(10)
Here the choice of minimum neutrino energy, is
unimportant and the maximum neutrino energy can be set
so that the maximum proton energy is comparable to the highest energy cosmic
rays ( eV & eV ). Depending on the spectral indices and
, the neutrino normalization is independent or a very weak
function of .
It is possible to calculate the neutrino flux without approximating the Band
function. In this case the neutrino spectra is:
(11)
Here we have approximated the flux above the syncrhotron energy to a power
law. This approximation is correct as long as is sufficiently
larger than . The normalization, , is
obtained using Eq.10.
4 Approximations of the Band function
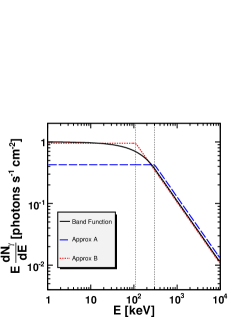
Figure 1 shows the Band function with the parameters:
, , keV and
photons cm-2 s-1 keV-1. Also shown is the
corresponding approximation A from Eq.7. The normalization
of approximation A has been chosen so that the bolometric fluence matches that
of the Band function. This is a natural choice for setting the normalization,
because the photon fluence is used in Eq.10.
It is quite clear that approximation A overestimates the contribution
from high energy photons and underestimates the contribution from low energy
photons. The reason why this occurs is because the break energy of the broken
power law has been forced to match that of the Band function.
It may be desirable (e.g. to simplify calculations) to have an alternative
broken power law approximation. Also we will use this new approximation,
B, to illustrate the deficiencies of approximation A. A
better choice for approximating the Band function is to require that the
asymptotic behavior (for very large and very small ) of the broken
power law matches the Band function, while leaving the break energy for the
broken power law a free parameter:
(12)
The value of the effective break energy is
given by the energy at which the two branches of the broken power law are
equal to each other:
(13)
Which results in an effective break energy that is independent of the spectral
indices:
(14)
where is Euler’s number. Figure 1 also shows approximation B
with the same parameters as before.
5 Effect of expected number of events
Given a neutrino spectrum , the expected number of events in a
neutrino telescope is:
(15)
where is the muon effective area (1 km2 for IceCube/KM3NET),
is the probability of a neutrino of energy
to produce a muon with energy equal or greater than the neutrino
telescope threshold (we assume 100 GeV) and
is Earth’s attenuation.The probability
is given by:
(16)
where is the average muon range given a
neutrino energy and a muon threshold . Earth’s
attenuation factor is given by:
(17)
where is Earth’s column density as a function of angle and
is the total -matter crossection.
We have calculated the expected number of events for a km3 detector. We
have used CTEQ5 for the neutrino-matter cross-section
(Lai et al, 2000). We follow the calculation by
(Lipari & Stanev, 1991) of average muon range. The Earth column density
is taken from the Preliminary Earth Reference Model
(Dziewonski & Anderson, 1981).
Using approximations A and B and the neutrino spectrum derived from the Band
function, we have studied a GRB with a photon break energy keV, located at a redshift z=1 and with Lorentz bulk boost
. We also set the spectral indices to and
. We have normalized the neutrino fluence of all three
spectra to the same (arbitrary) value as described in section §3. For this GRB the effective break energy is
keV. The neutrino break energy for approximation A
is 5.98 eV and for approximation B it’s 1.63 eV. For all cases we have fixed the synchrotron energy break at
1016 eV. Figure 2 shows the three neutrino spectra. Again
it is clear that approximation A is inadequate because it overestimates the
contribution of low energy neutrinos.
Figure 3 the ratio approximation A to B of expected number of
events as a function for this example GRB. For all GRB
locations in the sky we see that approximation A overestimates the expected
number of events. For steeper angles the ratio is larger, because for
approximation B the characteristic neutrino energy is higher and therefore
Earth’s attenuation is higher.
6 Discussion
We have shown that the usual choice to describe the photon spectra in the
calculation of neutrino fluxes from GRBs overestimates the contribution of
high energy photons (and therefore contribution of low energy neutrinos is
overestimated). This results in a higher exepected event rate by a factor of
2 for all models that make this assumption. The actual value of the
overestimation of the expected number of events depends on the matter column
depth that neutrinos must cross through Earth in the direction of the
GRB. Also we have shown that the typical neutrino energy is
1015 eV. The characteristic energy of neutrinos is a factor of
larger than the values obtained by Guetta et al (2004) and a
factor of 10 than the average value used by Waxman & Bahcall (1997). For
back of the envelope calculations we provide a new approximation to the Band
function that is adequate for the computation of neutrino spectra.
Kashti & Waxman (2005) have discussed the effects of muon and pion
energy losses leading to neutrino flavor flux ratios (at Earth) different than
1:1:1. Previous AMANDA searches for neutrinos
(Achterberg et al, 2007a, b), based on Waxman-Bahcall-like
assumptions have argued that this effect is not important experimentally
because the typical energy of the neutrinos detected is close to the neutrino
break energy. Because, as we have shown, the effective neutrino break
energy is close to the typical syncrhotron energy break, the effects described
by Kashti & Waxman (2005) must indeed be relevant.
I.T and M.V.D. were supported in part by NSF ANT-0554699.
References
Achterberg et al (2007a)
Achterberg A. et al.
ApJ 664:397, 2007
Achterberg et al (2007b)
Achterberg A. et al.
ApJ In press, 2007
Achterberg et al (2007c)
Achterberg A. et al.
Proc. of 30th Int. Cosmic Ray Conf. 2007. arXiv:0711.0353
Band et al (1993)
Band D. et al.
ApJ, 413:281, 1993.
Dziewonski & Anderson (1981)
Dziewonski A. M. and Anderson D. L.
Phys. Earth Plan. Int. 25:297, 1981
Guetta et al (2004)
Guetta D. et al.
Astroparticle Physics, 20:429, 2004.
Halzen & Hooper (1999)
Halzen F. and Hooper D. W.
ApJ, 527:L93, 1999.
Kashti & Waxman (2005)
Kashti T. and Waxman E.
Phys. Rev. Lett., 95:181101, 2005.
Kappes et al (2007)
Kappes A. et al.
Proc 6th Int Workshop on New Worlds in
Astropart. Phys. 2007. arXiv:0711.0563
Lai et al (2000)
Lai H. L. et al
European Physical Journal C, 12:375, 2000.
Lipari & Stanev (1991)
Lipari P. and Stanev T.
Phys. Rev. D 44:3543, 1991
Meszaros (2006)
Meszaros P.
Reports of Progress in Physics,69:2259, 2006
Murase & Nagataki (2006)
Murase K. and Nagataki S.
Phys. Rev. D, 73:063002, 2006.
Vietri (1995)
Vietri M.
ApJ, 453:883, 1995.
Waxman (1995)
Waxman E.
Phys. Rev. Lett., 75:386, 1995.
Waxman & Bahcall (1997)
Waxman E. and Bahcall J.
Phys. Rev. Lett., 78:2292, 1997.
Figure 1: The band function is compared to approximations A
and B. The three plots show , and . The Integral of (fluence) for approximations A and B
has been normalized to the fluence of the band function. For this example we
have chosen photons cm-2 s-1 keV-1,
, and keV. For each plot, the two vertical lines indicate
(right line) and (left line).Figure 2: Neutrino spectra corresponding to the Band
function, approximation A and B with the parameters used in
Fig.1. The normalization was chosen arbitrarily, but
for approximations A and B the neutrino fluence, ignoring synchrotron
radiation, is the same for all three spectra. The neutrino break energy is
5.98 eV for the neutrino spectra derived from the Band
funcition and for the one derived from approximation A and 1.62 eV for the one derived from approximation B. The synchrotron energy
loss has been arbitrarily set to 1016 eV.
Figure 3: Left: Ratio of expected number of events for
approximation A to the neutrino spectrum derived from the Band function as a
function of angle. The parameters chosen for the test GRB match those of
Fig.1 and 2. For neutrinos go
across Earth, while for neutrinos glance Earth along the
horizon. The structure in the plot is correlated with the density profile of
Earth as a function of depth, e.g. Earth’s core effect is seen between
-1 and -0.85. Right: Ratio of expected number of events for
approximation B to the spectrum derived using the Band function.