Diffuse interstellar medium and the formation of molecular clouds
1 Summary
The formation of molecular clouds (MCs) from the diffuse interstellar gas appears to be a necessary step for star formation, as young stars invariably occur within them. However, the mechanisms controlling the formation of MCs remain controversial. In this contribution, we focus on their formation in compressive flows driven by interstellar turbulence and large-scale gravitational instability.
Turbulent compression driven by supernovae appears insufficient to explain the bulk of cloud and star formation. Rather, gravity must be important at all scales, driving the compressive flows that form both clouds and cores. Cooling and thermal instability allow the formation of dense gas out of moderate, transonic compressions in the warm diffuse gas, and drive turbulence into the dense clouds. MCs may be produced by an overshoot beyond the thermal-pressure equilibrium between the cold and warm phases of atomic gas, caused by some combination of the ram pressure of compression and the self-gravity of the compressed gas.
In this case, properties of the clouds such as their mass, mass-to-magnetic flux ratio, and total kinetic and gravitational energies are in general time-variable quantities. MCs may never enter a quasi-equilibrium or virial equilibrium state but rather continuously collapse to stars. Gravitationally collapsing clouds exhibit a pseudo-virial energy balance , which however is representative of contraction rather than of virial equilibrium in this case. However, compression-driven cloud and core formation still involves significant delays as additional material accretes, leading to lifetimes longer than the free-fall time. In this case, the star formation efficiency (SFE) may be determined by the combined effect of the dispersive action of the early stellar products formed in the density fluctuations produced by the initial turbulence, and of magnetic support of large fractions of the volume of the MCs.
2 Large scale Interstellar Medium
At the scale of galactic disks, gravitational instability occurs not just in the gas alone (Goldreich & Lynden-Bell 1965), but in the combined medium of collisionless stars and collisional gas (Gammie 1992, Rafikov 2001). The combination is always more unstable than either component in isolation (Gammie 1992). In relatively gas-poor galaxies like the modern Milky Way, the instability of the stars and gas is often analyzed independently, in terms of gas flowing into stellar spiral arms (e.g. Roberts 1969). However, this is just an approximation to the general gravitational instability. Analysis of the instability must include both mass distributions (Yang et al. 2007).
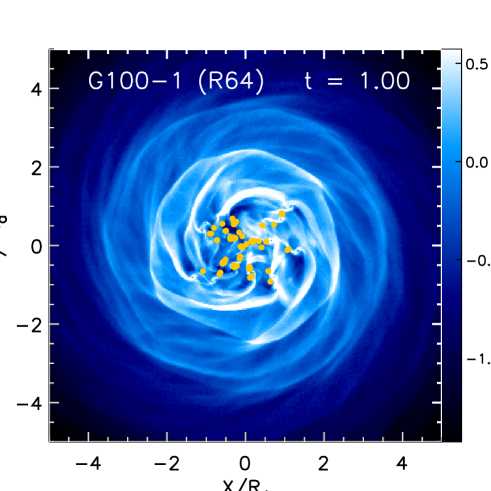
Numerical experiments on the behavior of the gravitational instability in disks have been done by Li et al. (2005), using isothermal gas, collisionless stars, and live dark matter halos computed with GADGET (Springel et al. 2001). They controlled the initial gravitational instability of the disk, and then computed its subsequent behaviour, as shown in Figure 1. Using sink particles, they measured the amount of gas that collapsed as a function of time, and related it to the initial instability, as expressed by the initial minimum Toomre parameter for stars and gas combined .
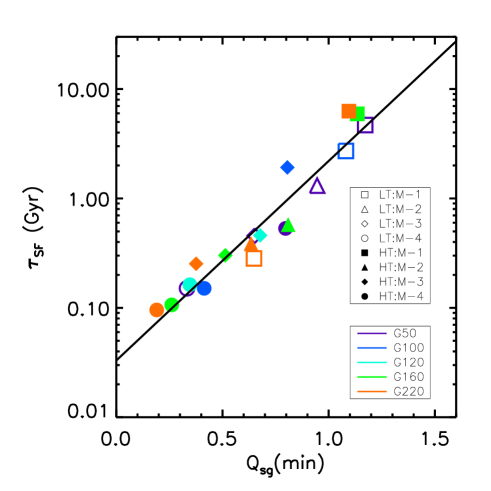
Li et al. (2005) measured the collapse timescale by fitting curves of the form , where the amount of collapsed mass is , the initial gas mass , and the elapsed time . Figure 2 shows that the collapse timescale depends exponentially on the initial strength of the instability
| (1) |
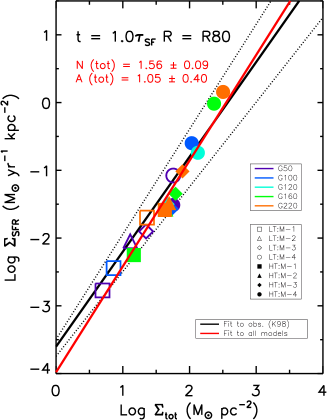
Kravtsov (2003) and Li et al. (2006) demonstrate that gravitational instability can explain the Schmidt law (Kennicutt 1998) as a natural outcome of the evolution of galactic disks. Kravtsov (2003) computed a cosmological volume and followed the star formation in individual disks, using a star formation law deliberately chosen to not automatically reproduce the Schmidt law, as compared to the frequently chosen . The sink particles used by Li et al. (2006) effectively give a similar star formation law, as they measure collapsed gas above a fixed threshold. Kravtsov (2003) found that including feedback made little difference so long as cooling was prevented below K, roughly the temperature chosen for their isothermal equation of state by Li et al. (2006). In Figure 3 the resulting Schmidt law is shown.
Gravitational instability drives compressive flows at the largest scales. Another candidate to drive compressive flows is turbulence driven by the expansion of H ii regions or supernovae. Substantial observational evidence exists for multiple generations of massive star formation in molecular clouds, apparently triggered by H ii regions and supernova explosions (see, for example, Elmegreen & Palouš 2007). However, supersonic driven turbulence inhibits collapse rather than enhancing it (Mac Low & Klessen 2004 and references therein).
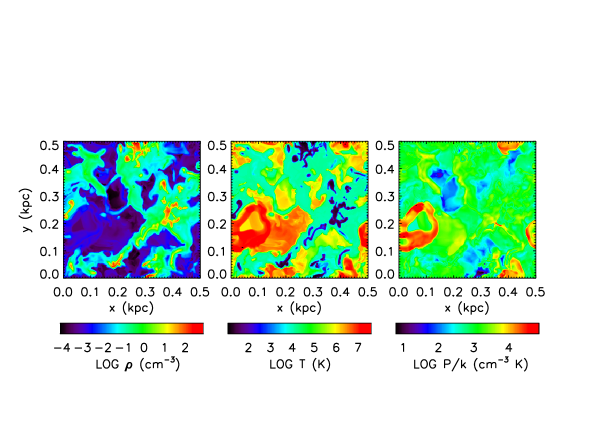
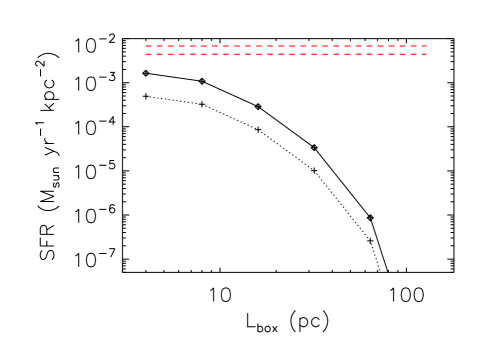
An examination of the triggering effect of H ii regions in the Milky Way by Mizuno et al. (2007) led to the conclusion that, although triggering does occur, only 10–30% of star formation occurs in triggered regions. A numerical model, shown in Figure 4, of large-scale, supernova-driven turbulence by Joung & Mac Low (2006) allowed them to reach a similar conclusion. They measured the mass of gas that was Jeans-unstable in their flow, allowing them to estimate the star formation rate that would be induced by the turbulent motions alone. They found that the corresponding star formation rate was an order of magnitude lower than the star formation rate required to maintain the assumed supernova rate (Fig. 5). This again suggests that triggering is a 10% effect.
Gravitational instability thus appears capable of explaining observed star formation rates, while turbulent compression alone seems to fail by roughly an order of magnitude. Considering galactic scale magnetic fields does not alter this conclusion. Parker instabilities alone appear insufficient to form giant molecular clouds (J. Kim et al. 2000, Santillán et al. 2000), but magneto-Jeans instabilities are effective (W.-T. Kim & Ostriker 2006).
The first consequence of gravitational instability at large scales, though, is large-scale compressive flows, first in the spiral arms that form the first manifestation of gravitational instability in disks, and then in smaller collapsing regions (Field et al. 2006). Therefore, a general physical understanding of molecular cloud formation in compressive flows is a vital link in understanding star formation.
3 Neutral Interstellar Medium
The interplay between compressible turbulence and heating and cooling processes in the neutral interstellar gas leads to the production of density fluctuations, including tiny-scale atomic structures cold atomic clouds, and ultimately molecular clouds.
Observationally, the neutral atomic hydrogen is mostly studied through the HI 21cm line, both in emission and in absorption (e.g. Dickey & Lockman 1990; Heiles & Troland 2005). These observations show that the interstellar atomic hydrogen spans a wide range of densities and temperatures, from what has traditionally been called the warm neutral medium (WNM), with – and – K, to what has been called the cold neutral medium (CNM), roughly times denser and colder, although a significant fraction of the gas mass (possibly up to 50%) lies at intermediate values of and (Heiles 2001). This picture is significantly more complex than the classical two-phase model of Field et al. (1969), which proposed the existence of discrete phases (the WNM and the CNM) in pressure equilibrium and mediated by contact discontinuities. In the remainder of this section, we discuss our present understanding of the extent to which this picture is modified by the presence of compressive turbulence in the atomic gas. This turbulence turns out to be transonic with respect to WNM sound speed but is supersonic with respect to CNM sound speed.
3.1 Thermal balance and thermal instability
The detailed thermal balance of the interstellar medium was first investigated by Field et al. (1969) and Dalgarno & McCray (1972), and more recently by Wolfire et al. (1995, 2003). The interstellar atomic hydrogen is thought to be mainly heated by ultraviolet and soft X-ray radiation through the photoelectric effect on small dust grains and polycyclic aromatic hydrocarbons. The heating term is therefore proportional to the gas number density, , and has a weak dependence on temperature. On the other hand, for temperatures larger than a few thousand Kelvins, the most important cooling mechanism is due to the Lyman- HI line and, at lower temperatures, to the [OI] and [CII] fine-structure lines. Since these lines are excited by collisions, the cooling term is proportional to . Thus the gas is thermally unstable when the cooling function varies slowly with the temperature, as is the case at a few thousand Kelvins, when the [OI] and [CII] lines are saturated, and thermally stable when the cooling function varies rapidly with the temperature, as happens in the wings of the atomic lines responsible for the cooling. This is the physical origin of the famous two-phase model for interstellar atomic hydrogen (Field et al. 1969).
Field (1965) showed that the criterion applicable to the atomic interstellar gas is the isobaric stability condition (see, e.g., the review by Vázquez-Semadeni et al. 2003), which can be written as
| (2) |
where is the loss function equal to the cooling minus heating terms. When the pressure along the cooling curve decreases with increasing density, a density fluctuation tends to be amplified because the surrounding gas has a larger thermal pressure and compresses it further.
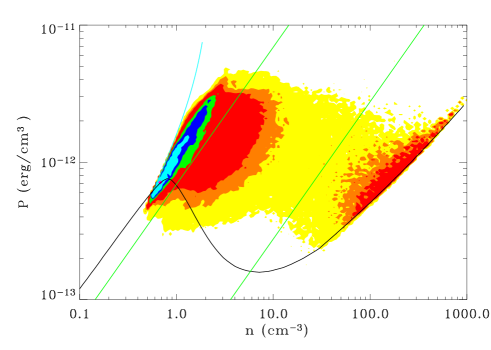
The cooling curve computed by Wolfire et al. (1995, 2003) presents in a pressure-density diagram, two branches of positive slope joined by one branch of negative slope. The WNM branch cannot exist at pressures higher than a certain critical value , and the CNM branch cannot exist at pressures lower than another critical value, (see Fig. 6). The density and temperature of the stable branches are in good agreement with the density and temperature ranges of the WNM and CNM inferred from observations.
3.2 Dynamical formation of cold atomic clouds
The influence of turbulence on the interstellar gas and its role on cloud formation was first investigated by Vázquez-Semadeni et al. (1995), who used a cooling curve that implied thermal stability at all temperatures, although still causing denser gas to be colder. They found that converging flows form strong density fluctuations even in relatively weak HII region driven turbulence, because of the strongly compressible nature of the flow. Such converging flows have been proposed to rapidly form molecular clouds (Ballesteros-Paredes et al. 1999b; Hartmann et al. 2001).
The influence of dynamical motions on the warm stable phase of a thermally bistable flow (i.e. the WNM) was considered in 1D by Hennebelle & Pérault (1999), Koyama & Inutsuka (2000) and Vázquez-Semadeni et al. (2006). These studies showed that either a shock or a converging flow can trigger the formation of a long-lived cold structure. The unperturbed incoming WNM flow undergoes a shock that heats the gas and throws it out of thermal equilibrium. Behind the shock, the gas continues to flow and cool, until finally, roughly one cooling length behind, it undergoes a transition to the cold phase, forming a thin, cold, dense layer. The phase transition occurs provided that the fluctuation amplitude is sufficiently strong to reach the pressure threshold and that the fluctuation lasts long enough for the gas to cool. Perturbations that fail to satisfy either of these conditions produce weak fluctuations of WNM instead. The response of the flow is therefore very nonlinear and depends sensitively on whether the perturbation is able to push the gas into the thermally unstable area.
The detailed evolution of density and velocity perturbations in a thermally unstable medium as a function of their associated crossing times was investigated further by Sánchez-Salcedo et al. (2002) and Vázquez-Semadeni et al. (2003) starting with initially thermally unstable gas. For density perturbations whose crossing time is shorter than the cooling time, the gas condenses more or less isobarically, while if the crossing time exceeds the cooling time, then the gas follows the thermal equilibrium curve while condensing. On the other hand, velocity perturbations with crossing times shorter than the cooling time tend to behave adiabatically, at least before the gas has time to cool.
In the 1D studies, once the cooling gas reaches the CNM branch, it cools and contracts along it, until the thermal pressure equals the ram pressure of the shocked warm incoming gas. When the perturbation has relaxed, the density within the structure, decreases until its internal pressure is equal to the thermal pressure of the surrounding WNM. The cold structure is then pressure confined, and therefore stable, unlike what happens in an isothermal medium. In 2D and 3D, however, the evolution is more complicated, as we describe below.
3.3 Front stability and thermal fragmentation
By performing a linear stability analysis, Inoue et al. (2006) show that evaporation fronts between cold and warm phases suffer instabilities similar to the Darrius-Landau instability that occurs in combustion fronts, rendering them unstable under corrugational deformations. On the other hand, condensation fronts are stable. The fastest growth rate of the evaporation front instability corresponds to wavelengths slightly larger than the Field length, while larger wavelengths grow proportionally to the wavenumber , and smaller wavelengths are stable. Numerical simulations performed by Kritsuk & Norman (2002) and Koyama & Inutsuka (2006) show that the nonlinear development of the instability can sustain weak turbulence. The source of energy is the heating term, which is not fully compensated by the cooling term within the thermal front.
Koyama & Inutsuka (2002) have also investigated the propagation of a shock through the WNM in 2D. They found that the post-shock gas is very unstable and fragments into many small CNM structures. Pittard et al. (2005) have shown that radiative shocks become more prone to overstability at a given upstream Mach number as the final postshock temperature is lower with respect to the upstream one. All of these results suggest that weak turbulence can easily be driven in the cold gas. Koyama & Inutsuka (2002) and Heitsch et al. (2005) have further shown that the CNM structures have a velocity dispersion that is a fraction of the sound speed of the warm phase, but still supersonic with respect to the internal sound speed of the CNM clumps.
Similar results for a shock-bounded layer in a radiatively cooling gas have been obtained by Walder & Folini (1998, 2000). Indeed, shock-bounded layers were shown to be nonlinearly unstable even in the isothermal case by Vishniac (1994), through the nonlinear thin-shell instability.
3.4 Colliding flows and thermally bistable turbulence
The formation of CNM structures induced by dynamical motions within the WNM has been further studied in 2D by Audit & Hennebelle (2005) and Heitsch et al. (2005, 2006) and in 3D by Vázquez-Semadeni et al. (2006) (see also Kritsuk & Norman 2002 for decaying thermally bistable turbulence and Gazol et al. 2005 for the driven case). Typically, these studies consider a computational box of a few tens of parsecs and a resolution of about 10002 cells in 2D, and up to cells in 3D. They all consider a converging flow of WNM that produces a turbulent shocked layer, which fragments into CNM structures, producing a turbulent, clumpy medium.
When the incoming flow is initially nearly laminar, the turbulence in the dense layer is believed to be driven by the combined action of the thermal, Kelvin-Helmholz and nonlinear thin-shell instabilities (Heitsch et al. 2005, 2006). However, when nonlinear fluctuations are initially present, the importance of these instabilities remains to be clarified (astrophysical flows are not expected to be initially laminar). Indeed, Audit & Hennebelle (2005) find that adding non-linear perturbations to the converging flow strongly changes the level of turbulence within the computational box, including in the CNM phase.
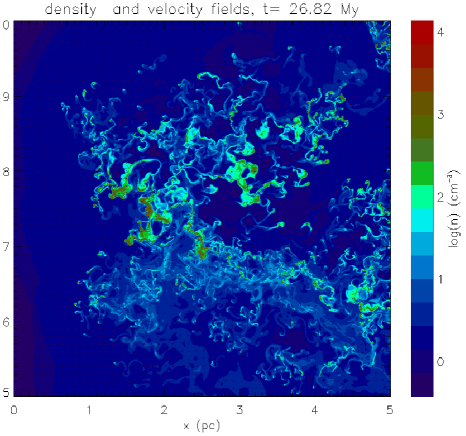
The overall structure of the resulting flow appears to be complex (see Fig. 7). The two phases are strongly mixed and a substantial fraction of thermally unstable gas is produced by the turbulent motions (Gazol et al. 2001) as shown in Figs. 6 and 8, in agreement with observational determinations (Heiles 2001). Note however, that even when the turbulence is strongly driven, producing transonic velocity dispersion within WNM, the tendency towards two-phase behaviour persists, although the fraction of thermally unstable gas increases for more strongly turbulent regimes. In particular, in the simulations that have been performed, a large fraction of the CNM structures remain bounded by contact discontinuities and pressure confined by the surrounding WNM. Note that it is certainly the case, that for high Mach number conditions, this structure may change. The question of how and at which Mach number, remains an open issue.
As in the numerical experiment of Koyama & Inutsuka (2002), the CNM structures present velocity dispersion somewhat smaller than the WNM sound speed. Since these motions are supersonic with respect to the CNM internal sound speed, the CNM structures undergo high-Mach number collisions, which create strong density fluctuations maybe reminiscent of the tiny small atomic structures observed in HI (Heiles 1997). Note that interestingly enough, this relatively high velocity dispersion within CNM structures is sustained self-consistently by the WNM turbulence, which in the study of colliding flows is triggered from the turbulence in the incoming WNM as well as by the turbulence spontaneously generated as part of the cloud formation process.
3.5 Dense structure statistics in thermally bistable turbulent flows
Studying the statistical physical properties of the dense structures produced by interstellar turbulence is of great interest since such structures constitute both atomic and molecular clouds in the ISM (Sasao 1973, Elmegreen 1993, Ballesteros-Paredes et al. 1999a). The statistics from the numerical models can be compared with the observational properties of dense clouds such as, for example, mean densities, pressures and temperatures, typical sizes, scaling relations among variables, etc., allowing tests of the various theoretical models.
The simulations by Gazol et al. (2005) and Audit & Hennebelle (2005) have shown that even at Mach numbers , local values of the density and pressure can be reached that exceed and K cm-3, respectively. Also, the bimodal nature of the density histogram, which in the extreme case of a static two-phase medium would be two Dirac delta functions at the densities of the WNM and CNM, is seen to gradually loose its bimodal character as the rms Mach number is increased (Fig. 8), signaling the increasing amounts of thermally unstable gas in the flow. It is also interesting that sometimes the highest pressures can be obtained in the transient unstable warm gas, rather than in the densest gas (see also Vázquez-Semadeni et al. 2006).

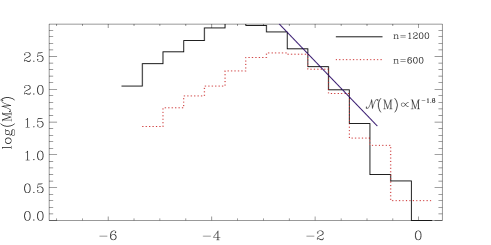


More recently, much higher resolution simulations have been performed, using up to cells in 2D (Hennebelle & Audit 2007) and cells in 3D (Audit & Hennebelle 2008). Figures 9 and 10 show the mass spectrum, the mass-size relations and the velocity dispersion as function of size of the CNM structures extracted from the 3D simulations. Corresponding results for the 2D case can be found in Hennebelle & Audit (2007) and Hennebelle et al. (2007). The CNM structures are simply determined by a clipping algorithm that uses a density threshold lying in the thermally unstable domain. The mass spectrum follows . Numerical convergence seems to have been reached at resolution of zones for masses between and . The mass-size relation is given approximately by , the smallest value of the index being obtained for the largest structures. Finally, the internal velocity follows about . These indices are very similar to the values inferred from observations of CO clumps. In particular, Heithausen et al. (1998) (see also Kramer et al. 1998), probing clumps of mass as small as one Jupiter mass, therefore directly comparable with the masses of the clouds produced in the simulation, report a very similar mass spectrum and mass-size relation.
It is worth comparing these results with results obtained in supersonic isothermal turbulent flows. Ballesteros-Paredes & Mac Low (2002) (see also Vázquez-Semadeni et al. 1997) have extracted the clumps formed in their simulations both in physical space and by a procedure mimicking the observational one, using a clump finding algorithm. In both cases, they found a lognormal mass spectrum and an internal velocity dispersion compatible with the observations. The mass-size relation appears to be more complex. In physical space, they found no correlation between the mean density and size of the clumps. However, structures extracted from the observational procedure followed approximately . They concluded that this is a projection effect that artificially connects structures along the line of sight.
It appears therefore that the two-phase model and the supersonic isothermal turbulent model lead to statistically different structure distributions. In principle, this could constitute a nice test. One should however keep in mind, that at this point, the formation of molecular hydrogen has not been included in the two-phase model and that structures have been extracted in the physical space. Further work is needed before definite conclusions can be reached.
3.6 Influence of the magnetic field
Hennebelle & Pérault (2000) consider in 1D the formation of a single structure when the incoming flow makes an angle with the magnetic field. They find that the thermal condensation is possible provided that the angle between the flow and the field is sufficiently small. In this process, the magnetic tension plays an important role in unbending the field lines and therefore reducing the magnetic pressure. As a result, the condensation occurs mainly along the field lines. Thus the magnetic intensity does not increase with the gas density. This seems to be in good agreement with the observations (Troland & Heiles 1986). The role of the magnetic waves has been further investigated by Hennebelle & Passot (2006). They conclude that over a large range of parameters, the waves tend to trigger the formation of CNM structures rather than preventing the condensation.
Recently, the formation of cold structures in 1D via ambipolar diffusion has been investigated by Inoue et al. (2007). They show that the value of the final magnetic intensity within the structure is relatively independent of the value of the magnetic field within the WNM, implying a weak correlation between the density and the magnetic intensity (see also Heitsch et al. 2004). Such a weak correlation between the magnetic field strength and the density is a general feature of MHD turbulence simulations, both isothermal (e.g., Padoan & Nordlund 1999; Ostriker et al. 2001) and multi-temperature (e.g., Passot et al. 1995; de Avillez & Breitschwerdt 2005). In the case of an isothermal gas, the weakness of the correlation has been interpreted by Passot & Vázquez-Semadeni (2003) in terms of the fact that the various types of (nonlinear, or simple) MHD waves are characterized by different scalings of the field strength with the density. Thus, in a turbulent flow in which all kinds of waves pass through one given point, the field strength there is a function of the history of wave passages, rather than of the local density.
Thus, it can be seen that in general, a significant correlation between magnetic field strength and density is not expected in the atomic gas as a consequence of the ability of the gas to flow freely along field lines, except perhaps at the highest densities, which probably require focused external compressions, which in turn increase the magnetic pressure as well (Gazol et al. 2007). This seems to be in good agreement with the observations (Troland & Heiles 1986; Heiles & Troland 2005).
Concerning the interaction of the magnetic field with the nonlinear thin shell instability, Heitsch et al. (2007) have begun to investigate the role of the field in possibly suppressing the instability in the isothermal case, finding that under a variety of circumstances it may still grow. Studies in the presence of thermal bistability are still pending.
4 Formation of molecular clouds
4.1 Context
MCs are the densest regions in the ISM. Their distribution in external galaxies shows that giant molecular clouds (GMCs) are in general the tip of the iceberg of the gas distribution, appearing at column densities above roughly 8 (e.g., Blitz et al. 2007). As the latter authors conclude, MCs seem to form out of the HI gas. Their formation thus requires significant compressions of the diffuse gas. As discussed in §2, the ultimate drivers of these compressions may be several large-scale instabilities, such as the global gravitational instability of the combined stars and gas, the magneto-Jeans instability, the magneto-rotational instability, or else local disturbances such as passing supernova shocks, or the general motions of the transonically turbulent warm diffuse ISM (e.g., Kulkarni & Heiles 1987; Heiles & Troland 2003).
Whatever the source of the compressions, the results described in the previous sections suggest that transonic compressions in the WNM can induce a transition to the CNM, followed by an overshoot to physical conditions typical of GMCs, which are colder and denser than the CNM clouds. This occurs because the compressed gas is in pressure balance with the total pressure of the inflowing WNM, including its ram pressure, implying that the gas at MC densities must be systematically overpressured with respect to the mean thermal pressure in the ISM (Vázquez-Semadeni et al. 2006), as is indeed the case (e.g., Blitz & Williams 1999). Moreover, as described in the previous sections, the formation of dense clouds by this process naturally produces at least some of the turbulence observed within them.
However, transonic compressions in the WNM alone are not sufficient to produce the extreme densities and pressures found in the interiors of MCs. For example, Vázquez-Semadeni et al. (2006) found that the pressure of the dense gas (there defined as gas with ) formed by Mach 2.5 compressions lies in the range 1.5–4 times the mean ISM pressure, while mean observed MC pressures are actually closer to 10 times the mean ISM pressure (e.g., Blitz & Williams 1999). This suggests that self-gravity must be crucially involved in the formation and evolution of MCs, to produce the observed additional pressure enhancement.
4.2 Numerical Results
The process of dense cloud formation out of compressions in the WNM in the presence of thermal bistability and self-gravity has been first studied by Vázquez-Semadeni et al. (2007) by means of numerical simulations using GADGET (Springel et al. 2001), which, being Lagrangian, allows very high effective resolution at very dense points. Sink particles (Jappsen et al. 2005) are used to avoid the need for prohibitely high resolutions while allowing for the simulation of individual or clustered star formation.
The simulations start with a converging flow immersed in a much larger box, so that the cloud can later interact freely with its environment, without artificial confinement. The box is initially filled with WNM gas at and K. The inflows have finite durations, in order to be able to follow the subsequent evolution of the cloud . Non-equilibrium chemistry was not implemented, but densities and temperatures are reached that allow quick formation of molecular hydrogen (see Glover & Mac Low 2007b).

The clouds formed in these simulations exhibit a secular evolutionary process that proceeds along the following lines:
1. The turbulence in the dense clouds continues to be driven for as long as the inflows last (see also Folini & Walder 2006). The turbulent velocity dispersion is maintained at a roughly constant level that depends on the inflow Mach number, as can be seen for Myr in the bottom panel of Fig. 11.
2. The clouds do not ever reach an equilibrium state. As the gas transits from the warm to the cold phase, it becomes denser and colder than its surroundings, and the cloud’s mass is constantly varying. During the early stages, the mass increases continuously through accretion from the inflows ( Myr in the top panel of Fig. 11). Later, the dense gas mass begins to decrease because of its conversion to stars.
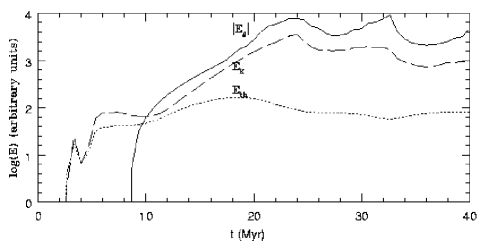
3. At some point during the evolution, the cloud’s gravitational energy becomes larger than the sum of its internal and turbulent energies; the cloud becomes gravitationally unstable and begins to contract ( Myr in Fig. 12). This contraction begins roughly at the time when the inflows have begun to weaken, and the turbulence produced by the cloud formation mechanism has begun to decay. This decay is however very slow, because the flows weaken slowly, and so does the rate of turbulent energy injection. The turbulence in the clouds is thus in a state intermediate between being continuously driven and absolutely decaying.
4. While the clouds are contracting, they exhibit a near-equipartition energy balance satisfying which appears as virial equilibrium. However, in this case the energy balance is a signature of gravitational contraction rather than of virial equilibrium, contrary to standard notions about MCs (e.g., Blitz & Williams 1999), and the velocity dispersion of the cloud contains a dominant fraction of infall motion, rather than random turbulence.
5. Stars begin forming after the cloud has already been contracting a long time (presumably still in atomic form). Specifically, the cloud begins contracting at Myr, while the first stars begin to appear at Myr. In this simulation, however, they form at local density fluctuations produced by the initial turbulence (in turn produced by the flow collision) long before the global collapse is completed.
6. The star formation efficiency (SFE), that is, the mass converted from gas into stars after some characteristic time, appears to be too large, with 15% of the mass having already been converted into stars 3 Myr after star formation starts ( Myr), and roughly three times more mass in stars than in dense gas by Myr. Instead, observational estimates of the SFE ranges from a few percent for whole MC complexes (e.g., Myers et al. 1986), up to 30–50% for cluster-forming cores (Lada & Lada 2003). Thus, the control of the SFE in the scenario of these simulations must probably rely on magnetic support of the clouds (e.g., Mouschovias 1978; Shu et al. 1987, Elmegreen 2007) or energy feedback from the stellar products, as suggested by various authors (e.g., Norman & Silk 1980; Franco et al. 1994; Matzner & McKee 2000; Hartmann et al. 2001; Krumholz et al. 2006; Nakamura & Li 2007).
4.3 Formation of molecular hydrogen
One argument often advanced in favour of cloud lifetimes longer than 10 Myr is the apparent difficulty involved in producing sufficient H2 in only 1–2 Myr to explain observed clouds, given the relatively slow rate at which H2 forms in the ISM. The H2 formation timescale in the ISM is approximately (Hollenbach, Werner, & Salpeter 1971)
| (3) |
where is the number density in cm-3, which suggests that in gas with a mean number density , characteristic of most giant molecular clouds (Blitz & Shu 1980), conversion from atomic to molecular form should take at least , longer than the entire lifetime of a transient cloud. However, estimates of this kind do not take account of dynamical processes such as supersonic turbulence or thermal instability.
Glover & Mac Low (2007ab) used the ZEUS-MP MHD code (Norman 2000) modified to include a simplified chemical network to follow the non-equilibrium abundance of molecular hydrogen to study molecule formation in a turbulent, self-gravitating flow with and without magnetic fields. They found that initially uniform gas does indeed take tens of megayears to form molecules, but that initial supersonic turbulence produces density enhancements that allow regions to become fully molecular within 3 Myr (Fig. 13), consistent with short timescales for molecular cloud formation.

One crucial issue is the possibility that molecular clouds may actually contain sizable amounts of atomic gas interspersed within the molecular phase. Certainly, this is the impression that one gathers from density fields like that shown in Fig. 7, where the dense gas appears to have a fractal structure, with substructure observed essentially down to the resolution limit. Observations appear to show atomic gas intermixed with the molecular gas (e.g. Williams et al. 1995, Li & Goldsmith 2003). Hennebelle & Inutsuka (2006) have suggested that some of this gas may be warm, and proposed that it could be heated by dissipation of MHD waves. This issue remains open, but if confirmed, it could have a deep impact on the dynamics and structure of molecular clouds. Indeed, since the filling factor in molecular cloud is generally not greater than %, the density of the interclump medium must be smaller than a few times cm-3. Otherwise, the mass in the interclump medium would be comparable to or greater than the mass within the clumps (Williams et al. 1995 estimate that the interclump particle density is lower than 10 cm-3). Thus the assumption that the interclump medium has the same temperature than the gas inside the clumps, leads to a thermal pressure much lower than the thermal pressure of the standard ISM.
4.4 Discussion and Implications
The MC formation simulations discussed here are consistent with the scenario of Hartmann et al. (2001): the formation of a GMC involves accumulation of the gas from distances of up to hundreds of parsecs, and takes up to 10–20 Myr to complete. However, most of this process occurs in the atomic phase, with molecular gas only forming late in the evolution, when a sufficiently large column density of dense gas has been collected (see also Franco & Cox 1986). The formation of molecular gas occurs roughly simultaneously with the onset of star formation for solar-neighborhood conditions.
If this scenario proves correct, it has two important implications. First, the mechanism of cloud formation by accumulation and condensation implies, in the presence of magnetic fields, that the mass-to-flux ratio of the dense gas must increase with time. This is consistent with the observation that diffuse CNM clouds are generally magnetically subcritical (Heiles & Troland 2005), while MCs (which in this scenario begin their evolution as diffuse CNM clouds; see Vázquez-Semadeni et al. 2006) are generally magnetically critical or supercritical (Bourke et al. 2001; Crutcher 2004). Hartmann et al. (2001) suggest that the clouds in the solar neighborhood should become supercritical roughly simultaneously with their becoming molecular. The precise timing of the transition from subcritical to supercritical, in relation to the time of becoming molecular and the onset of star formation may be crucial in determining the SFE. Moreover, the global cloud contraction observed in the non-magnetic simulations may not take over until the clouds become supercritical in the magnetic case.
Second, the domination of the evolution by global gravitational contraction suggests a return to the scenario originally proposed by Goldreich & Kwan (1974), of global gravitational contraction for MCs. This proposal was quickly dismissed by Zuckerman & Palmer (1974) through the argument that if all MCs converted all their mass into stars in roughly one free-fall time, the resulting star formation rate would be at least 10 times larger than that presently observed in the Galaxy. Zuckerman & Evans (1974) then proposed that the supersonic linewidths in the clouds are produced primarily by local motions (the hypothesis of microturbulence), which has been widely accepted until recently.
However, several considerations argue against the microturbulent picture. Turbulence is a regime of fluid flow characterized by having the largest velocities at the driving scale, as indicated by the negative slope of the turbulent energy spectrum both in the incompressible (Kolmogorov 1941) and compressible (e.g., Passot & Pouquet 1987; Kritsuk et al. 2007) cases. Comparisons of observations with numerical simulations in various contexts show that the dominant motions (and thus the driving scales) occur at scales the size of the whole cloud or larger (e.g., Ossenkopf & Mac Low 2002; Heyer & Brunt 2007). This contradicts the microturbulent picture, which requires small-scale driving.
Furthermore, evidence is beginning to accumulate that MCs or their clumps may, in fact, be gravitationally collapsing. This has been claimed for the Orion MC by Hartmann & Burkert (2007), and for NGC 2264 by Peretto et al. (2007). If gravitational contraction turns out to be a general feature of MCs, then the Goldreich & Kwan (1974; see also Field et al. 2006) suggestion may turn out to be correct after all, at least for a subset of the clouds, or for the star-forming regions of MCs (a large fraction of the volume of a MC is devoid of star formation; e.g., Krumholz, Matzner, & McKee 2006, Elmegreen 2007). In this case, the regulation of the SFE may be accomplished by the combined effects of magnetic support, of the turbulence produced in the clouds during their formation, and of the dispersive action of stellar feedback.
The initial turbulence in the cloud caused by its formation produces nonlinear density fluctuations that can collapse before the global cloud collapse is completed. The feedback from these first star formation events may be able to suppress, or at least reduce, subsequent events before all the gas of the cloud is turned into stars (Franco et al. 1994). Moreover, in the presence of magnetic field fluctuations, parts of the clouds may remain magnetically subcritical and thus supported against collapse, while other parts may become supercritical as they incorporate material from the surrounding WNM, and go into collapse. In this case, the SFE in the locally supercritical regions may be large, while the global average over whole GMCs may be low, because most of their mass remains subcritical. The feedback from the active star forming regions may then shred the clouds and leave subcritical fragments that may collapse later, or even disperse away (Elmegreen 2007).
However, it is presently a matter of strong debate whether regulation of the SFE by stellar energy input occurs by dispersal of the star-forming clumps or by quasi-equilibrium support of the clouds. The recent study by Nakamura & Li (2007) suggests that near-equilibrium can be achieved between driving by stellar outflows and the self-gravity, but this study has a deep potential well and furthermore uses periodic boundary conditions, so that the cloud cannot be dispersed. Observationally, clusters older than several Myr are generally observed to be devoid of gas, suggesting that they have been able to disperse (or consume) their parent cloud (Leisawitz et al. 1989; Hartmann et al. 2001).
These issues will hopefully be resolved in the near future both through observations aimed at distinguishing these two scenarios, and by numerical simulations of the entire evolution of MCs, from formation to dispersal, including the feedback from stellar sources and magnetic fields.
References
- [1] Audit, E., & Hennebelle, P. 2005, A&A 433, 1
- [2] Audit, E., & Hennebelle, P. 2008, in preparation
- [3] de Avillez, M., & Breitschwerdt, D. 2005, A&A 436, 585
- [4] Ballesteros-Paredes, J., Vázquez-Semadeni, E., & Scalo, J. 1999a, ApJ, 515, 286
- [5] Ballesteros-Paredes, J., Hartmann, L., & Vázquez-Semadeni, E. 1999b, ApJ, 527, 285
- [6] Ballesteros-Paredes, J., & Mac Low, M.-M. 2002, ApJ, 570, 734
- [7] Blitz, L., Fukui, Y., Kawamura, A., Leroy, A., Mizuno, N., & Rosolowsky, E. 2007, in Protostars and Planets V., eds. B. Reipurth, D. Jewitt, & K. Keil (Tucson: U. of Arizona Press) 81.
- [8] Blitz, L., & Shu, F. H. 1980, ApJ, 238, 148
- [9] Blitz, L, & Williams, J. P. 1999, in Physics of Star Formation and Early Stellar Evolution II, eds. N. D. Kylafis, & C. J. Lada (Dordrecht: Kluwer)
- [10] Bourke, T. L., Myers, P. C., Robinson, G., & Hyland, A. R. 2001, ApJ 554, 916
- [11] Crutcher, R. M. 2004, Ap&SS, 292, 225
- [12] Dalgarno, A., McCray, R., A. 1972, ARA&A, 10, 375
- [13] Dickey, J., & Lockman, F. 1990, ARA&A, 28, 215
- [14] Elmegreen, B. G. 1993, ApJ 419, L29
- [15] Elmegreen, B. G., & Palouš, J. (editors), 2007, Triggered Star Formation in a Turbulent ISM (Cambridge: Cambridge U. Press)
- [16] Elmegreen, B. G. 2007, ApJ, 668, 1064
- [17] Field, G., 1965, ApJ 142, 531
- [18] Field, G., Goldsmith, D., & Habing, H. 1969, ApJ Lett 155, 149
- [19] Field, G., Blackman, E. G, Keto, E. R. 2006, MNRAS, submitted (astro-ph/0601574v4)
- [20] Folini, D., & Walder, R. 2006, A&A, 459, 1
- [21] Franco, J. & Cox, D. P. 1986, PASP 98, 1076
- [22] Franco, J., Shore, S. N., & Tenorio-Tagle, G. 1994, ApJ 436, 795
- [23] Gammie, C. F. 1992, PhD Thesis, Princeton University
- [24] Gazol, A., Vázquez-Semadeni, E., Sánchez-Salcedo, F., & Scalo, J. 2001, ApJ 557, L124
- [25] Gazol, A., Vázquez-Semadeni, E., & Kim, J. 2005, ApJ 630, 911
- [26] Gazol, A., Kim, J., V zquez-Semadeni, E., & Luis, L., 2007, in ”SINS - Small Ionized and Neutral Structures in the Diffuse Interstellar Medium”, ed. M. Haverkorn and W. M. Goss (San Francisco: Astronomical Society of the Pacific), p.154
- [27] Glover, S. C. O. G., & Mac Low, M.-M. 2007a, ApJ Supp., 169, 239
- [28] Glover, S. C. O. G., & Mac Low, M.-M. 2007b, ApJ, 659, 1317
- [29] Goldreich, P., & Kwan, J. 1974, ApJ, 189, 441
- [30] Goldreich, P., & Lynden-Bell, D. 1965, MNRAS, 130, 97
- [31] Hartmann, J., Ballesteros-Paredes, J., & Bergin, E. 2001, ApJ, 562, 852
- [32] Hartmann, L., & Burkert, A. 2007, ApJ, 654, 988
- [33] Heiles, C. 1997, ApJ 481, 193
- [34] Heiles, C. 2001, ApJ 551, L105
- [35] Heiles, C., & Troland, T. 2003, ApJ 586, 1067
- [36] Heiles, C., & Troland, T. 2005, ApJ, 624, 773
- [37] Heithausen, A., Bensch, F., Stutzki, J., Falgarone, F., & Panis, J.-F. 1998, A&A 331, L65
- [38] Heitsch, F., Zweibel, E., Slyz, A., & Devriendt, J. 2004, ApJ 603, 165
- [39] Heitsch, F., Burkert, A., Hartmann, L., Slyz, A., & Devriendt, J. 2005, ApJ 633, 113
- [40] Heitsch, F., Slyz, A., Devriendt, J., Hartmann, L., & Burkert, A. 2006, ApJ 648, 1052
- [41] Heitsch, F., Slyz, A., Devriendt, J., Hartmann, L.,& Burkert, A. 2007, ApJ 665, 445
- [42] Hennebelle, P., & Audit, E. 2007, A&A, 465, 431
- [43] Hennebelle, P., Audit, E., & Miville-Deschènes, M.-A. 2007, A&A, 465, 445
- [44] Hennebelle, P., & Pérault, M. 1999, A&A 351, 309
- [45] Hennebelle, P., & Pérault, M. 2000, A&A 359, 1124
- [46] Hennebelle, P., & Passot, T. 2006, A&A 448, 1083
- [47] Hennebelle, P., Inutsuka, S.-I. 2006, ApJ, 647, 404
- [48] Heyer, M., & Brunt, C. 2007, in Triggered Star Formation in a Turbulent ISM, eds. B. G. Elmegreen & J. Palouš (Cambridge University Press, Cambridge), 9
- [49] Hollenbach, D. J., Werner, M. W., & Salpeter, E. E. 1971, ApJ, 163, 165
- [50] Inoue, T., Inutsuka, S.-i., & Koyama, H. 2006, ApJ, 652, 1331
- [51] Inoue, T., Inutsuka, S.-i., & Koyama, H. 2007, ApJ, 658, L99
- [52] Jappsen, A.-K., Klessen, R. S., Larson, R. B., Li, Y., & Mac Low, M.-M. 2005, A&A, 435, 611
- [53] Joung, M. K. R., & Mac Low, M.-M. 2006, ApJ, 653, 1266
- [54] Kennicutt, R. C., Jr. 1998, ApJ, 498, 541
- [55] Kim, J., Franco, J., Hong, S. S., Santillán, A., Martos, M. A. 2000, ApJ, 531, 873
- [56] Kim, W.-T., & Ostriker, E. 2006, ApJ, 646, 213
- [57] Kramer, C., Stutzki, J., Rohrig, R., & Corneliussen, U. 1998, A&A 329, 249
- [58] Kravtsov, A. V. 2003, ApJ, 590, L1
- [59] Kolmogorov, A. 1941, Dokl. Akad. Nauk SSSR, 30, 301
- [60] Koyama, H., & Inutsuka, S. 2000, ApJ 532, 980
- [61] Koyama, H., & Inutsuka, S. 2002, ApJ 564, L97
- [62] Koyama, H., & Inutsuka, S. 2006, ApJ, submitted, astro-ph/0605528
- [63] Kritsuk, A. G., & Norman, M. L. 2002, ApJ 569, L127
- [64] Kritsuk, A. G., Norman, M. L., Padoan, P., & Wagner, R. 2007, ApJ, 665, 416
- [65] Krumholz, M. R., Matzner, C. D., & McKee, C. F. 2006, ApJ, 653, 361
- [66] Kulkarni, S., R., & Heiles, C. 1987, in Interstellar Processes, eds. D. J. Hollenbach, & H. Thronson (New York: Springer) 87
- [67] Lada, C. J., & Lada, E. A. 2003, ARA&A, 41, 57
- [68] Leisawitz, D., Bash, F. N., & Thaddeus, P. 1989, ApJS, 70, 731
- [69] Li, D., & Goldsmith, P. F. 2003, ApJ 585, 823
- [70] Li, Y., Mac Low, M.-M., & Klessen, R. S. 2005, ApJ, 626, 823
- [71] Li, Y., Mac Low, M.-M., & Klessen, R. S. 2006, ApJ, 639, 879
- [72] Mac Low, M.-M., & Klessen, R. S. 2004, Rev. Mod. Phys., 76, 125
- [73] Matzner, C. D., & McKee, C. F. 2000, ApJ, 545, 364
- [74] Mizuno, N., Kawamura, A., Onishi, T., Mizuno, A., & Fukui, Y., 2007, in Triggered Star Formation in a Turbulent ISM, eds. B. G. Elmegreen & J. Palouš (Cambridge University Press, Cambridge), 128
- [75] Mouschovias, T. 1978, in Protostars & Planets, ed. T. Gehrels (Tucson: Univ. Of Arizona), 209
- [76] Myers, P. C., Dame, T. M., Thaddeus, P., Cohen, R. S., Silverberg, R. F., Dwek, E. & Hauser, M. G. 1986, ApJ 301, 398
- [77] Nakamura, F., & Li, L.-Y. 2007, ApJ, 656, 721
- [78] Norman, C., & Silk, J. 1980, ApJ, 238, 158
- [79] Norman, M. L. 2000, Rev. Mex. Astron. Astrof. Ser. Conf., 9, 66
- [80] Ossenkopf, V., & Mac Low, M.-M. 2002, A&A, 390, 307
- [81] Ostriker, E. C., Stone, J, M., Gammie, C. F. 2001, ApJ, 546, 980
- [82] Padoan, P., Nordlund, Å. 1999, ApJ, 526, 279
- [83] Passot, T., & Pouquet, A. 1987, J. Fluid Mech. 181, 441
- [84] Passot, T., Vázquez-Semadeni, Pouquet, A., 1995, ApJ 455, 536
- [85] Passot, T., & Vázquez-Semadeni, E. 2003, A&A, 398, 845
- [86] Peretto, N., Hennebelle, P., André, P., 2007, A&A, 464, 983
- [87] Pittard, J. M., Dobson, M. S., Durisen, R. H., Dyson, J. E., Hartquist, T. W., & O’Brien, J. T. 2005, A&A, 438, 11
- [88] Rafikov, R. R. 2001, MNRAS, 323, 445
- [89] Roberts, W. W. 1969, ApJ, 158, 123
- [90] Sánchez-Salcedo, F. J., Vázquez-Semadeni, E., & Gazol, A. 2002, ApJ 577, 768
- [91] Sántillan, A., Kim, J., Franco, J., Martos, M., Hong, S. S., & Ryu, D. 2000, ApJ, 545, 353
- [92] Sasao, T. 1973, PASJ, 25, 1
- [93] Shu, F., Adams, F., & Lizano, S. 1987, ARAA, 25, 23
- [94] Springel, V., Yoshida, N., White, S. D. M. 2001, New Astron., 6, 79
- [95] Troland, T., & Heiles, C. 1986, ApJ, 301, 339
- [96] Vázquez-Semadeni, E., Passot, T., & Pouquet, A. 1995, ApJ 441, 702
- [97] Vázquez-Semadeni, E., Ballesteros-Paredes, J., & Rodriguez, L. 1997, ApJ 474, 292
- [98] Vázquez-Semadeni, E., Gazol, A., Passot, T., & Sánchez-Salcedo, F.J. 2003, in Turbulence and Magnetic Fields in Astrophysics, eds. E. Falgarone & T. Passot (Dordrecht: Springer)
- [99] Vázquez-Semadeni, E., Gómez, G. C., Jappsen, A. K., Ballesteros-Paredes, J., González, R. F., & Klessen, R. S. 2007, ApJ, 657, 870
- [100] Vázquez-Semadeni, E., Ryu, D., Passot, T., González, R., & Gazol, A. 2006, ApJ, 643, 245
- [101] Vishniac, E. T. 1994, ApJ, 428, 186
- [102] Walder, R., & Folini, D. 1998, A&A, 330, 21L
- [103] Walder, R., & Folini, D. 2000, ApSS, 274, 343
- [104] Williams, J., Blitz, L., & Stark, A. 1995, ApJ, 451, 252
- [105] Wolfire, M.G., Hollenbach, D., & McKee, C.F. 1995, ApJ, 443, 152
- [106] Wolfire, M.G., Hollenbach, D., & McKee, C.F. 2003, ApJ, 587, 278
- [107] Yang, C.-C., Gruendl, R. A., Chu, Y.-H., Mac Low, M.-M., & Fukui, Y. 2007, ApJ, in press (arXiv:0708.3243)
- [108] Zuckerman, B., & Evans, N. J. 1974, ApJ, 192, L149
- [109] Zuckerman, B. & Palmer, P. 1974, ARA&A, 12, 279