author subject
Studies of the in Proton-Proton
Collisions with ANKE at COSY-Jülich
Studies of with ANKE@COSY
I. Zychor
![[Uncaptioned image]](/html/0711.3084/assets/x1.png)
I. Zychor
Zychor, I.
The Andrzej Sołtan Institute for Nuclear Studies
05-400 Świerk, Poland
Abstract
The lineshape of the was studied in the reaction at a beam momentum of 3.65 GeV/c at COSY-Jülich. The ANKE spectrometer was used to identify two protons, one positively charged kaon, and one negatively charged pion in the final state. Invariant–mass and missing–mass techniques were applied to separate two neighbouring neutral excited hyperon resonances, the and . Both the shape and the position of the distribution are similar to those measured in other reactions and this information contributes to the ongoing debate regarding the structure of this resonance.
1 Introduction
The is a well established four–star resonance [1] but it is still not well understood as a baryonic state; it does not fit in easily within the simple quark picture [2]. The might be the spin-multiplet partner of the , a meson–baryon resonance, a quasibound state [3], or a pentaquark state [4]. Recent theoretical investigations based on chiral dynamics predict the existence of two poles in the vicinity of the [5, 6, 7] with a decay spectrum that depends upon the production process. In any event, the does not have a Breit–Wigner shape because of the opening at 1432 MeV/c2 of the decay mode [8, 9, 10]. Independent of the model, if the were a single quantum state, its lineshape should be independent of the method of production.
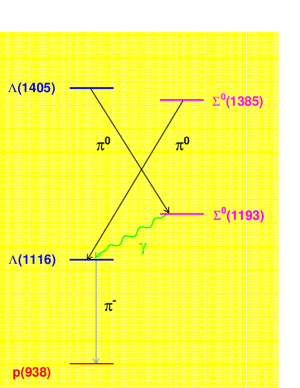
The and resonances overlap significantly because their widths of 36 MeV/c2 and 50 MeV/c2, respectively, are much larger than the mass difference of 20 MeV/c2. This is the main experimental difficulty in investigating the nature via the and decay modes since these are also possible final states for the disintegration. However, the decay can be used to identify this resonance unambiguously because isospin forbids this mode for the .
In Fig. 1 the simplified decay scheme of excited neutral resonances with masses below 1432 MeV/c2 demonstrates the differences between and utilised in the present analysis.
2 Experiment, analysis and simulations
The experiment was performed at the Cooler Synchrotron COSY, a medium energy accelerator and storage ring for protons and deuterons, which is operated at the Research Center Jülich (Germany) [11]. COSY supplied a stored proton beam with a momentum of 3.65 GeV/c at a revolution frequency of . Using a hydrogen cluster–jet target, the average luminosity during the measurements was .
The ANKE spectrometer [12] used in the experiments consists of three dipole magnets that guide the circulating COSY beam through a chicane. The central C–shaped spectrometer dipole D2, placed downstream of the target, separates the reaction products from the beam. The ANKE detection system, comprising range telescopes, scintillation counters and multi–wire proportional chambers, registers simultaneously positively and negatively charged particles and measures their momenta [13].
The following configuration of detectors was used to measure particles over a particular momentum range:
-
1.
forward (Fd) and side–wall (Sd) counters for protons between 0.75 GeV/c and the kinematic limit,
-
2.
telescopes and side–wall scintillators for between 0.2 and 0.9 GeV/c,
-
3.
scintillators for between 0.2 and 1.0 GeV/c.
The angular acceptance of the spectrometer dipole D2 is horizontally and vertically. Momenta, reconstructed from tracks in multi–wire proportional chambers, allow the masses of particles to be determined to within MeV/c2.
A multiparticle final state, containing two protons, a positively charged kaon, a negatively charged pion and an unidentified residue selected the reaction. In the decay the residue is a while, for the decay, (see Fig. 1).
The following method was used to separate the from the :
-
1.
identify four particles: , , and ,
-
2.
analyse events with the invariant mass of the pair equal to the mass of the ,
-
3.
select events with the missing mass of (, , , ) equal to a mass to isolate the and much higher than the mass to identify the .
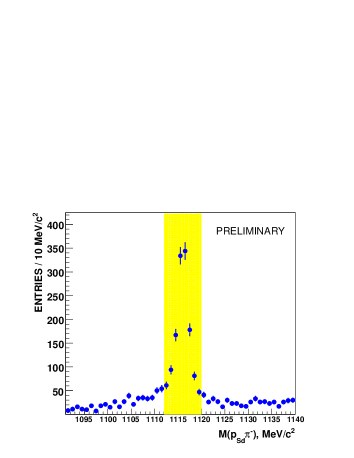
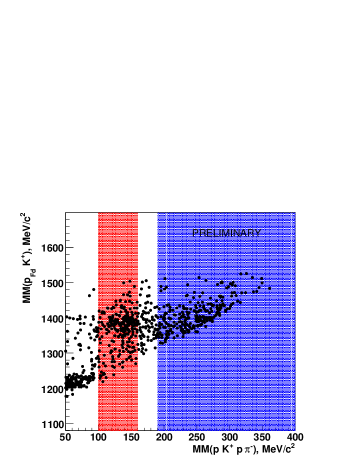
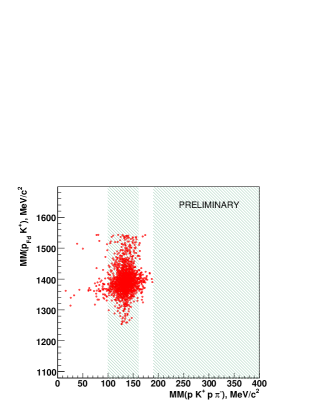
In the left part of Fig. 2 the invariant mass of the pairs is shown, where the protons were registered in the side-detector counters. In the mass region around 1116 MeV/c2 a peak with a FWHM of MeV/c2 is visible on a background that is mostly combinatorial in nature. The vertical box marks invariant–masses between 1112 and 1120 MeV/c2. Events within this box are plotted in the right panel of Fig. 2 in a distribution of versus . The two vertical bands show the four–particle missing–mass criteria used to separate the candidates from those of the . The left band is optimised to identify a whereas the right one selects masses significantly greater than . The deviation of MeV/c2 from the nominal pion mass of 135 MeV/c2 is not unexpected in a mass reconstruction involving four particles.
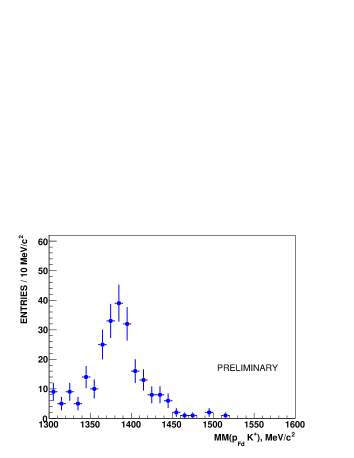
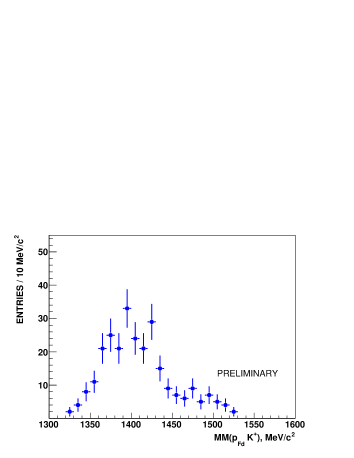
In the left part of Fig. 3 the missing–mass distribution is shown for . A peak around a mass of 1385 MeV/c2 and a width of MeV/c2 is seen on a rather small background. In the right part of Fig. 3 the distribution, obtained for MeV/c2, has a peak near 1400 MeV/c2 and a tail on the high missing–mass side.
In order to explain the measured spectra, Monte Carlo simulations were performed to estimate backgrounds from non–resonant and resonant reactions. The following non–resonant processes have been included:
-
1.
-
2.
with representing any allowed or hyperon. The second group consists of the following exclusive hyperon production reactions:
-
1.
-
2.
-
3.
The simulations, based on the GEANT3 package, were performed in a similar manner to those in Ref. [14].
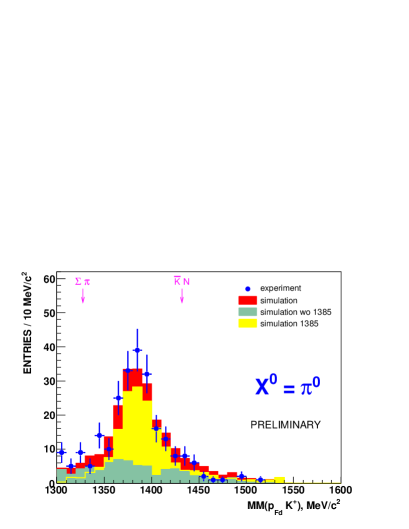
In the study of production and its backgrounds, events were generated according to phase space using a relativistic Breit–Wigner parameterisations for the known hyperon resonance [1]. The relative contributions of the resonant and non–resonant reactions were deduced by fitting the experimental data to the simulated spectra. In Fig. 4 the histograms show the resonant contribution from the reaction (solid-yellow) and the sum of non–resonant contributions (solid-green). The result of the overall simulations is shown as a red histogram.
Turning now to the , simulations show that the does not contaminate the missing–mass range above 190 MeV/c2 (see Fig. 5). This point is crucial since it allows us to obtain a clean separation of the from the .
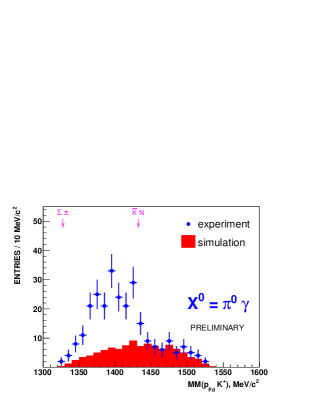
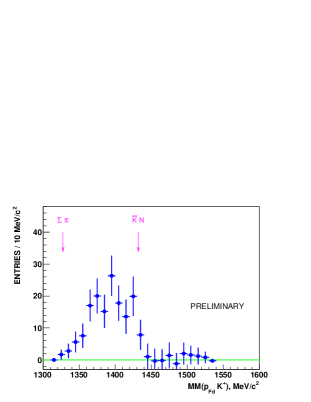
In order to extract the distribution from the measured decay, the non–resonant contributions have first been fitted to the experimental data. The resulting non–resonant background is indicated by the shaded histogram in the left panel of Fig. 6. When this is subtracted from the data, we obtain the distribution shown as experimental points in the right panel of Fig. 6.
3 Results
In Table 1 the information that is relevant for the evaluation of the total cross section is given. For both the hyperons measured this is of the order of a few .
| number of events | ||
|---|---|---|
| acceptance | ||
| combined BR (%) | 56 | 21 |
| luminosity (pb-1) | ||
| detection efficiency (%) | ||
| cross section () |
The invariant–mass distributions have been previously studied in two hydrogen bubble chamber experiments. Thomas et al. [10] found 400 or events corresponding to the reaction at a beam momentum of 1.69 GeV/c. Hemingway [8] used a 4.2 GeV/c kaon beam to investigate and measured 1106 events [8].
In Fig. 7 our experimental points are compared to the results of Thomas and Hemingway, which have been normalised by scaling their values down by factors of 3 and 7, respectively. The effect of the threshold is quite obvious in these data, with the mass distribution being strongly distorted by the opening of this channel. Despite the very different production mechanisms, the three distributions have consistent shapes.
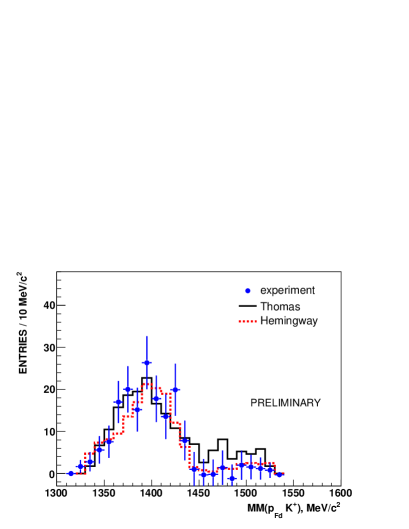
This might suggest that, if there are two states present in this region, then the reaction mechanisms in the three cases are preferentially populating the same one. It should, however, be noted that by identifying a particular reaction mechanism, the proponents of the two–state solution can describe the shape of the distribution that we have found [7].
4 Outlook
The decay of excited hyperons via and can be detected directly in electromagnetic calorimeters by registering neutral particles, i.e. and/or . Measurements of such channels are underway in reactions (CB/TAPS at ELSA [15], SPring8/LEPS [16]) and are also planned in collisions with WASA at COSY [17].
hyperon resonance hadronic reaction ANKE COSY
Acknowledgments
The results presented constitute the common effort of many members of the ANKE collaboration (www.fz-juelich.de/ikp/anke) and the COSY accelerator group, as described in Ref. [18]. This work has been supported by COSY-FFE Grant, BMBF, DFG and Russian Academy of Sciences.
References
- [1] W.-M. Yao et al., J. Phys. G 33, 1 (2006), but see also the minireview in D.E. Groom et al., Eur. Phys. J. C 15, 1 (2000).
- [2] N. Isgur and G. Karl, Phys. Rev. D 18, 4187 (1978).
- [3] R.H. Dalitz and S.F. Tuan, Ann. Phys. (N.Y.) 10, 307 (1960).
- [4] T. Inoue, arXiv:0708.2339 [hep-ph].
- [5] D. Jido et al., Nucl. Phys. A 725, 181 (2003).
- [6] V.K. Magas, E. Oset and A. Ramos, Phys. Rev. Lett. 95, 052301 (2005).
- [7] L.S. Geng and E. Oset, arXiv:0707.3343 [hep-ph].
- [8] R.J. Hemingway, Nucl. Phys. B253, 742 (1984).
- [9] R.H. Dalitz and A. Deloff, J. Phys. G 17, 289 (1991).
- [10] D.W. Thomas, et al., Nucl. Phys. B 56, 15 (1973).
- [11] R. Maier, Nucl. Instr. Meth. A 390, 1 (1997)
- [12] S. Barsov et al., Nucl. Instr. Meth. A 462, 364 (2001).
- [13] M. Büscher et al., Nucl. Instr. Methods A 481, 378 (2002
- [14] I. Zychor et al., Phys. Rev. Lett. 96, 012002 (2006).
- [15] H. Schmieden, ELSA Letter of Intent ELSA/4-2003.
- [16] H. Fujimura, AIP Conf. Proc. 915, 737 (2007).
- [17] H.-H. Adam et al., nucl-ex/0411038.
- [18] I. Zychor et al., arXiv:0705.1039 [nucl-ex]