Robustness of the European power grids under intentional attack
Abstract
The power grid defines one of the most important technological networks of our times and sustains our complex society. It has evolved for more than a century into an extremely huge and seemingly robust and well understood system. But it becomes extremely fragile as well, when unexpected, usually minimal, failures turn into unknown dynamical behaviours leading, for example, to sudden and massive blackouts. Here we explore the fragility of the European power grid under the effect of selective node removal. A mean field analysis of fragility against attacks is presented together with the observed patterns. Deviations from the theoretical conditions for network percolation (and fragmentation) under attacks are analysed and correlated with non topological reliability measures.
pacs:
02.50.-r, 05, 84.70.+p, 89.75.FbI Introduction
The power grid defines, together with transportation networks and the Internet, the most important class of human-based web. It allows the success of advanced economies based on electrical power but it also illustrates the limitations imposed by environmental concerns, together with economic and demographic growth: the power grid reaches its limits with an ever growing demand EUgreenpaper . A direct consequence of this situation is the fragility of this energy infrastructure, as manifested in terms of sudden blackouts and large scale cascading failures, mostly caused by localized, small scale failures, ocurring at an increasing frequency TheGrid ; LightsOut .
The fragility of the power grid is an example of a generalized feature of most complex networks, from the Internet to the genome BAreview ; Bornholdt ; SIAMreview ; Dorogovtsev ; LATORAreview . Specifically, real networks are often characterized by a considerable resilience against random removal or failure of individual units but experience important shortcomings when the highly connected elements are the target of the removal. Such directed attacks have dramatic structural effects, typically leading to network fragmentation AlbertGrid ; MotterLai ; Carreras ; Motter . This behaviour has been studied for skewed power-law distributions of links, which are found in many small-world networks AlbertTolerance ; CrucittiTolerance . But recent studies have shown that similar responses are not unique to small-world, scale-free networks: power grids, having less skewed exponential degree distributions and often without small-world topology, display similar patterns of response to node loss. Rosas2007
An additional feature of the power grid is its spatial structure. The geographic character of this network implies that a number of constraints are expected to be at work. Other well known spatially extended nets include the Internet Internet , street networks Streets , railroad and subway networks railsubway , ant galleries Ants , electric circuits Circuits or cortical graphs Cortical .
One fundamental aspect concerning the analysis of complex networks is the increasing evidence of mutual influence between dynamical behavior and topological structure. The topology of human contact networks, for example, determines the emergence of epidemics EpidemicSpreading ; similarly, the correct dynamics in cellular networks are rooted in the topology of the regulatory networks AlbertOthmer ; Maayan . Here we present evidence of a plausible relation between topological and non topological reliability measures for the power grid, suggesting that topology might be capturing the robustness (or fragility) of the real system, when dynamics are at work. This evidence has been obtained analysing the resilience of 33 different power grids: (a) the 23 different EU countries, (b) 4 geographically related zones (Iberian Peninsula, Ireland as island, England as island and United Kingdom and Ireland as a whole), (c) 4 traditionally united or separated regions (former Yugoslavia, Czechoslovaquia and Federal and Democratic Republics of Germany), (d) continental Europe and (e) continental Europe plus United Kingdom and Ireland.
The paper is organized as follows. In section II the data set on European power grids is presented and their basic topological features summarized. In section III we present both analytical and numerical estimations of the boundaries for network collapse under attack, using a mean field theoretical approach. Two classes of networks are shown to be present. In section IV, evidence for correlation between these two classes and non topological reliability indexes is shown to exist. In section V we summarize our findings and outline their implications.
II Power grid data sets
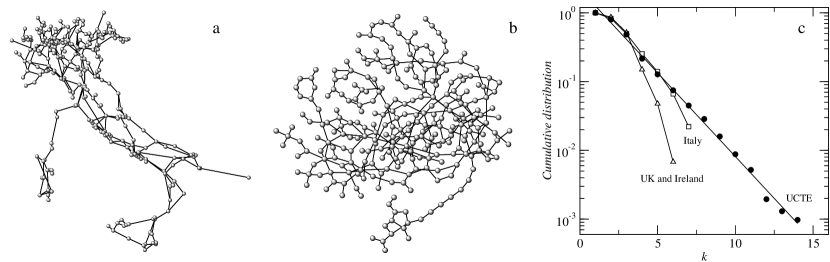
Europe’s electricity transport network is nowadays the ensemble of more than twenty different national power grids coordinated, at its higher level, by the Union for the Co-ordination of Transmission Electricity, UCTE (http://www.ucte.org). The distribution and location of transmission lines, plants, stations, etc. can be found in the last version (July 2007) of the UCTE Map. The different data sets analyzed here have been obtained after introducing the topological values (i.e. geographical positions and longitudes) of more than 3,000 generators and substations (nodes) and 200,000 km of transmission lines (edges) in a geographical information system (GIS). The national power grid for every country or region has been obtained from a typical GIS query: the selection of the part of the UCTE’s network constrained by every country’s frontier. The power grid can then be formally described in terms of a graph . Here indicates the set of nodes (transformers, substations or generators in our context). Figure 1 shows an example of such graphs with its geographical (a) and topological (b) structures, respectively. These nodes can be connected, and indicates the set of actual links between pairs of nodes. Specifically, indicates that energy is being transported between the nodes in the pair . Our system can be analyzed at two main levels: the whole power grid including all countries within the EU and at the country level. If indicates the -th power grid of one of the countries and regions involved, we have .
The global organization of these webs has been previously analyzed Rosas2007 , revealing a very interesting set of common regularities: (a) most of them are small worlds (i.e. very short path lengths are tipically present) and the larger webs display clustering coefficients much larger than expected from a random version of the network analysed; (b) they are very sparse, meaning that the average number of links is such that , with an average of over all the webs available (see Table I); (c) the link distribution is exponential: the probability of having a node linked to other nodes is (Fig. 1, c) and (d) these networks are weakly or no correlated. This exponential distribution is thus characterized by the constant which actually corresponds to the average degree (i.e., ).
Correlations were measured using the average nearest neighbor connectivity of a node with the degree , i. e. the average where is the conditional probability that a link belonging to a node with connectivity points to a node with connectivity Satorras2001 . For these webs, it was found that constant, as expected if no correlations were present. This is a very useful property in our analysis, since makes mean field predictions valid in spite that we ignore the planar character of these networks, thus replacing the geographical pattern by a topological one.
III Attacks in exponential networks: mean field theory
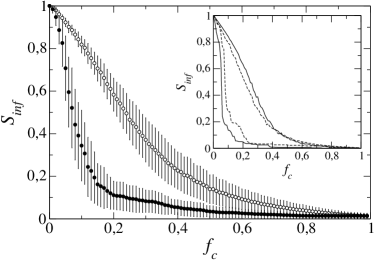
In our previous paper, we analysed the effects of both random and selective removal of nodes on the EU grids Rosas2007 . Nonetheless, in that paper we were mostly interested in the average behavior of the networks analysed (see Figure 2). Here we want to extend these results to the analysis of the differences observed in EU power grids with the goal of interpreting the different patterns exhibited compared to the predictions from mean field theory on intentional attacks.
In order to compute the effect of random removal of nodes, we compute the percolation condition for the graph assuming it is sparse and uncorrelated. Let be the fraction of removed nodes and the link degree distribution of our graph. The damaged graph will be characterized by the following degree distribution :
| (1) |
Note that such an equation corresponds to the case when a fraction of nodes are removed but it also holds when a fraction of links are removed (or lead to unoccupied sites).
In order to study percolation properties, we use the standard generating function methodology. The two first generating functions of the damaged graph are:
| (2) | |||
| (3) |
The averages (i.e., the values at ) are respectively. Here is the fraction of nodes from the original graph belonging to the damaged graph. Similarly, is the relation among and the average number of nodes from that can be reached after deleting a fraction of nodes. The generating function for the size of the components, other than the giant one, which can be reached from a randomly choosen node is:
| (4) |
And the generating function for the size of the component to which a randomly choosen node belongs to is Callaway :
| (5) |
Thus, the average component size, other than the giant component will be:
| (6) |
After some algebra, we see that this leads to a singularity when . To ensure the percolation of the damaged graph, the following inequality has to hold:
| (7) |
The above expression can be expressed as:
| (8) |
which leads to a critical probability of node removal given by:
| (9) |
where . In our case, we have an analytic estimate . Using the average value , we obtain a predicted critical probability .
Although random removal is an interesting scenario, it considers chance events that are not correlated to network structure. Intentional attacks strongly deviate from random failures: even a small fraction of removed nodes having large degrees has dramatic consequences. In order to predict the effects of such directed attacks on network structure, the critical probability associated to network breakdown can be computed. Here we follow the formalism developed by Cohen et al. Cohen2000 . Roughly speaking, this formalism enables us to translate an intentional attack into an equivalent random failure and study the problem in terms of standard percolation using equation (9). When the selective removal of the most connected nodes is considered, a fraction of order is removed by eliminating elements with a degree larger than a given . This upper cutoff is then easily computed from the continuous approximation:
| (10) |
and the new cutoff can be obtained (again under a continuous approximation) from:
| (11) |
which gives (assuming large enough) a new cutoff:
| (12) |
Following Cohen2000 , we translate the problem of intentional attack to an equivalent random failure problem. The removal of a fraction of nodes with the highest degree is then equivalent to the random removal of those links connecting the remaining nodes to those already removed. Thus, the probability that a specific link leads to a deleted node will be given by:
| (13) |
being the average degree of the undamaged graph. It is not difficult to show that this gives:
| (14) |
Using equation (12) it is straightforward to see that:
| (15) |
where we assume that is large enough to ignore the term . Thus, an equivalent network with maximal degree has been built after a random removal of nodes due to the fact that the absence of correlations implies a random failure of links. In order to obtain the degree distribution of the damaged graph, such a failure can be introduced into equation (3). But this will be formally equivalent to the removal of nodes. Thus, to study stability properties, we only need the resulting probability to be introduced in the critical condition for percolation (9). Replacing , we obtain:
| (16) |
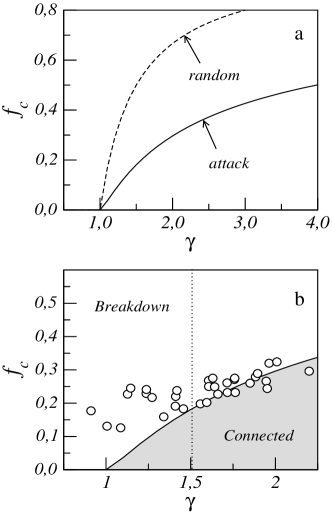
whose solutions (for each fixed ) provide the conditions for network percolation under attacks. In Figure 3 and Table I, we show the result of our calculations. As expected, a much lower value of is required to break a power grid network through intentional attack.
Now we can compare this mean field prediction, evaluated as , with available data. Using the whole dataset of EU grids, we can estimate for all EU countries. The result are shown, for both ’s, in Figure 3, b. As we can see, there is a very good agreement (given their small size) between observed (real) and predicted (theoretical) values, but some nontrivial deviations are also obvious. We can see that aproximately for the expected values are very similar to those predicted by theory. However, the power grids having lower exponents (when ) strongly deviate from the predicted values. These agreements and deviations are not due to some simple statistical trait, such as network size. As indicated in Table I, very large power grids are in both sides (i.e, the German and Italian grids are in the first group whereas the Spanish and French ones, belong to the second).
| Errors | Attacks | |||||||||
|---|---|---|---|---|---|---|---|---|---|---|
| Country | ||||||||||
| Belgium | 1,005 | 0,011 | 0,395 | 0,384 | 0,010 | 0,131 | 0,121 | 53 | 58 | 2,18 |
| Holland | 1,086 | 0,147 | 0,387 | 0,240 | 0,034 | 0,126 | 0,092 | 36 | 38 | 2,11 |
| Germany | 1,237 | 0,322 | 0,565 | 0,243 | 0,097 | 0,229 | 0,132 | 445 | 560 | 2,51 |
| Italy | 1,238 | 0,322 | 0,583 | 0,261 | 0,097 | 0,241 | 0,144 | 272 | 368 | 2,70 |
| Austria | 1,409 | 0,450 | 0,506 | 0,056 | 0,159 | 0,191 | 0,032 | 70 | 77 | 2,20 |
| Rumania | 1,418 | 0,455 | 0,579 | 0,124 | 0,162 | 0,238 | 0,076 | 106 | 132 | 2,49 |
| Greece | 1,457 | 0,477 | 0,492 | 0,015 | 0,174 | 0,183 | 0,009 | 27 | 33 | 2,44 |
| Croatia | 1,594 | 0,543 | 0,525 | 0,018 | 0,214 | 0,202 | 0,012 | 34 | 38 | 2,23 |
| Portugal | 1,606 | 0,548 | 0,595 | 0,047 | 0,217 | 0,250 | 0,033 | 56 | 72 | 2,57 |
| EU | 1,630 | 0,557 | 0,629 | 0,072 | 0,223 | 0,275 | 0,052 | 2783 | 3762 | 2,70 |
| Poland | 1,641 | 0,562 | 0,594 | 0,033 | 0,226 | 0,249 | 0,023 | 163 | 212 | 2,60 |
| Slovakia | 1,660 | 0,569 | 0,563 | 0,006 | 0,231 | 0,227 | 0,004 | 43 | 52 | 2,41 |
| Bulgaria | 1,763 | 0,604 | 0,570 | 0,034 | 0,256 | 0,232 | 0,024 | 56 | 67 | 2,39 |
| Switzerland | 1,850 | 0,629 | 0,610 | 0,020 | 0,275 | 0,260 | 0,015 | 147 | 186 | 2,53 |
| Czech Republic | 1,883 | 0,638 | 0,634 | 0,004 | 0,281 | 0,279 | 0,003 | 70 | 88 | 2,51 |
| France | 1,895 | 0,641 | 0,647 | 0,006 | 0,285 | 0,289 | 0,004 | 667 | 899 | 2,69 |
| Hungary | 1,946 | 0,654 | 0,617 | 0,036 | 0,295 | 0,266 | 0,029 | 40 | 47 | 2,35 |
| Bosnia | 1,952 | 0,655 | 0,588 | 0,067 | 0,295 | 0,244 | 0,052 | 36 | 42 | 2,33 |
| Spain | 2,008 | 0,668 | 0,689 | 0,020 | 0,307 | 0,324 | 0,017 | 474 | 669 | 2,82 |
| Serbia | 2,199 | 0,705 | 0,655 | 0,051 | 0,339 | 0,296 | 0,054 | 65 | 81 | 2,49 |
IV Correlations with non-topological reliability measures
The reliability of a power grid evaluates its ability to continuously meet demand under major events like overloads, general failures, external impacts and alike. At the engineering level, and due to the different dimensions of service quality involved in a power grid (i.e., consumers, companies and regulators), reliability has been traditionally measured by different indexes as (a) the amount of energy not supplied, (b) the total loss of power or (c) the equivalent time of interruption, which measures the number and duration of interruptions experienced by customers CEER . In this sense we would expect a correlation between the critical percolation fraction , the exponent that characterizes the grids’ cumulative degree distribution , and some of (if not all) these reliability indexes presented.
In order to explore the problem, three reliability indexes have been obtained from the UCTE monthly reliability measures UCTE . They are related to four major events. Namely: overloads, general failures, external impacts and exceptional conditions, and finally other reasons (including unknown reasons). For every major event and transmission grid, the following indexes have been considered and normalized: (1) energy not supplied, normalized by the gross UCTE electricity consumption; (2) total loss of power, normalized by the UCTE peak load on the third Wednesday of December; and (3) equivalent time of interruption (also known as average interruption time or AIT), which is the ratio between the total energy not supplied and the average power demand per year, measured in minutes per year (normalized by definition).
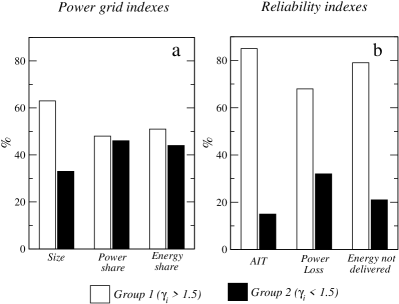
In order to avoid statistical deviations due to the limited historical data available (UCTE monthly statistics have been published only from January 2002 onwards), we have devided UCTE networks in two groups. Group 1 includes those countries whose critical breakdown probability agrees with that predicted (i.e., countries with ). Group 2 includes those countries whose deviates positively from (i.e., countries with ), with an expected more robust topology than that predicted.
Figure 4 gives the acummulated percentage values for the formerly presented reliability indexes and for each group of networks. As we can see, networks in group 1 (i.e., networks with ) represent 63% of the whole UCTE nodes, they manage 48 and 51% of the UCTE energy and power respectively but acummulate 85, 68 and 79% of the UCTE average interruption time, power loss and energy not delivered, respectively. On the contrary, though networks in group 2 (i.e., networks with ) represent a mere 33% of the whole UCTE nodes, they manage 46 and 44% of the UCTE energy and power respectively (similar to those of group 1) but, even so, they acummulate only 15, 32 and 21% of the UCTE average interruption time, power loss and energy not delivered, respectively. This fact would suggest a positive correlation between static topological robustness and non-topological reliability measures and, as a consequence, a clear diferentiation between two classes of networks in terms of their level of robustness.
V Discussion
In this paper we have extended our previous work on the robustness of the European power grid under random failures with the intentional attacks scenario. A mean field theory approach has been used in order to analitically predict the fragility of the networks against selective removal of nodes and a significant deviation from predicted values has been found for power grids with an exponent . For these networks, the real critical fraction is higher than the theoretical one for the same . This suggests an increased robustness for these networks compared to those with .
In order to evaluate the real existence of this two classes of networks, namely robust and fragile, real reliability measures from the Union for the Co-Ordination of Transport of Electricity (UCTE) have been used. It has been found that there seems to exist indeed a positive correlation between static topological robustness measures and real non-topological reliability measures. This correlation shows that networks in the robust class (i.e., networks with ), though representing only 33% of the UCTE nodes under study and managing a similar amount of power and energy than that of the networks in the fragile class, acummulate much less percentage of the whole UCTE average interruption time, power loss and energy not delivered. How this can be related with the internal topological structure of the networks and the subgraphs abundances is actually a main point under study and will be explored elsewhere.
This feature is of obvious importance. Up to this date and as far as we know, no such correlation between topological and dynamical features has been encountered in any study related to complex networks structure and dynamics. From the power industry point of view, constanly facing the challenge of meeting growing demands with security of supply at the lowest possible spenditure in infrastructures, the implications of this feature would permit new rather than traditional approaches to contingency-based planning criteria Willis2004 . One of these traditional, and widely used, planning criteria is the so-called criterion. It assumes that no interruption of service can occur in a system with units of equipment due to isolation of outaged components. Without any topological feedback, the methodology (a) requires fast breaker operation to open any circuit pathway that has been faulted as well as to close the alternate path to service and (b) pushes the system to an increasing interconnection complexity as its utilization ratio (i.e., ratio between peak load and capacity of subtransmission lines and substation transformers) increases in time (aging infrastructures). Though aging infrastructures, excessive power delivered through increasing long distances and other possible causes may influence the increasing fragility of the power grids, it seems reasonable to think that, on a topological basis, the application of the contingency-based criteria, though originally intended to avoid interruptions in power service, would difficult, at the same time, the islanding of disturbances (i.e., the more connected an element is, the easier would be for a disturbance to reach). In other words: the same criteria that successfully has served to increase reliability in power systems through the late 20th century might now be responsible for the difficulties encountered in preventing perturbations, blackouts or isolating the different power grid elements.
Over the last years, and mainly due to economic imperatives, contingency-based planning criteria has been gradually pervaded by reliability-based planning criteria. In the later, the prevention of likely contingencies of severe impact is considered much more effective than that of low-probability and low impact. Nonetheless, this fact leaves the main conception of criteria still valid and at work in most of the ongoing grid’s planning processes. Following the former discussion, we would suggest to add a third topology-based planning methodology, in order to take this fact into account.
Acknowledgements.
The authors thank Ricard Bosch, Iñaki Candela and Robert Neville for useful discussions. This work has been supported by grants FIS2004-05422 and by the Santa Fe Institute.References
- (1) Comission of the European Communities, Green Paper. A European Strategy for Sustainable, Competitive and Secure Energy, EU, Brussels, (2006).
- (2) Schewe, P. F., The Grid, Joseph Henry Press, Washington (2007).
- (3) Makansi, J., Lights Out: The Electricity Crisis, the Global Economy, and What It Means to You, John Wiley & Sons, New York (2007).
- (4) Albert, R. & Barabási, A. L., Rev. Mod. Phys., 74, 47 (2002).
- (5) Bornholdt, S. & Schuster, G. , eds. Handbook of Graphs and Networks, Wiley-VCH, Berlin (2002).
- (6) Newman, M. E. J., SIAM Review, 45, 167 (2003).
- (7) Dorogovtsev, S. N. & Mendes, J. F. F., Evolution of Networks: From Biological Nets to the Internet and WWW, Oxford University Press, New York (2003).
- (8) Boccaletti, S., Latora, V., Moreno, Y., Chavez, M. & Hwang, D-U., Physics Reports,424, 175 (2006).
- (9) Albert, R., Albert, I. & Nakarado, G. L., Phys. Rev. E,69, 025103 R (2004).
- (10) Motter, A. E. & Lai, Y. Ch., Phys. Rev. E, 66, 065102 (2002).
- (11) Carreras, B. A. et al., Chaos, 12, 985 (2000); ibid Chaos, 14, 643 (2004).
- (12) Motter, A. E., Phys. Rev. Lett., 93, 098701 (2004).
- (13) Albert, R., Jeong, H. & Barabási, A. L., Nature, 406, 378 (2000).
- (14) Crucitti, P., Latora, V., Marchiori, M. & Rapisarda, A., Physica A,340, 388 (2004).
- (15) Rosas-Casals, M., Valverde, S. & Solé, R. V., Int. J. Bif. Chaos, 17, 7 (2007).
- (16) Pastor-Satorras, R. & Vespignani, A., Evolution and Structure of the Internet: A Statistical Physics Approach, Cambridge University Press, Cambridge (2004).
- (17) Cruciti, P., Latora, V., & Porta, S., Phys. Rev. E, 73, 36125 (2006).
- (18) Latora, V., & Marchiori, M., Physica A, 314, 109, (2002).
- (19) Buhl, J., Gautrais, J., Solé, R.V., Kuntz, P., Valverde, S., Deneubourg, J.L. & Theraulaz, G., Eur. Phys. J. B, 42, 123-129, (2004).
- (20) Ferrer, R., Janssen, C., & Solé, R. V., Phys. Rev. E, 63, 32767, (2001).
- (21) Sporns, O. & Zwi, J., Neuroinformatics , 2, 145 - 162, (2004).
- (22) Pastor-Satorras, R., & Vespignani, A. Phys. Rev. Lett., 86, 3200-3203 (2001).
- (23) Albert, R., & Othmer, H. G. J. Theor. Biol., 223, 1 (2003).
- (24) Ma’ayan, A., et al. Science, 309, 1078 (2005).
- (25) Pastor-Satorras, R., Vazquez, A., & Vespignani, A. Phys. Rev. Lett., 87, 258701 (2001).
- (26) Callaway, D. S., Newman, M. E. J., Strogatz, S. E & Watts, D. J. Phys. Rev. Lett., 85, 5468 (2000)
- (27) Cohen, R., Erez, K., ben-Avraham, D. & Havlin, S., Phy. Rev. Lett., 85, 4626 (2000).
- (28) CEER, Quality of Electricity Supply: Initial Benchmarking on Actual Levels, Standards and Regulatory Strategies, Council of European Energy Regulators / Working Group on Quality of Electricity Supply, (2001).
- (29) http://www.ucte.org/publications/monthlystats
- (30) Willis, H. L., Power Distribution Planning Reference Book, Marcel Dekker, Inc., New York (2004).