789\Yearpublication2007\Yearsubmission2007\Month12\Volume999\Issue88
later
A new period determination for the close PG1159 binary SDSS J212531.92010745.9
Abstract
Methods to measure masses of PG 1159 stars in order
to test evolutionary
scenarios are currently based on spectroscopic masses or
asteroseismological mass determinations. One recently discovered
PG 1159 star in a close binary system may finally allow the first
dynamical mass determination, which has so far been analysed on
the basis of one SDSS spectrum and photometric monitoring.
In order to be able to phase future radial velocity measurements
of the system SDSS J212531.92010745.9, we follow up on
the photometric monitoring of this system to provide a solid
observational basis for an improved orbital ephemeris determination.
New white-light time series of the brightness variation of
SDSS J212531.92010745.9 with the Tübingen 80 cm and
Göttingen 50 cm telescopes extend the monitoring into a second
season (2006), tripling the length of overall observational data
available, and significantly increasing the time base covered.
We give the ephemeris for the orbital motion of the system, based on a sine fit
which now results in a period of 6.95573(5) h, and discuss the associated
new amplitude determination in the context of the phased light
curve variation profile.
The accuracy of the ephemeris has been improved by more than one order of
magnitude compared to that previously published for 2005 alone.
keywords:
Ephemerides – stars: AGB and post-AGB – white dwarfs – binaries: close1 Introduction
PG 1159 stars are hot hydrogen-deficient pre-WDs which are believed to be the outcome of a late or very late helium-shell flash during their post-AGB evolution. About 40 such objects are known at present (Werner & Herwig, 2006), and a subset of currently 11 objects forms the class of the pulsating GW Vir variables. From their evolutionary history, typical masses should be around 0.6 M; spectroscopic and asteroseismological mass determinations confirm this. These methods however rely on stellar structure and evolution modelling, and can so far not be tested independently.
Nagel et al. (2006) have recently announced the unique discovery of a PG 1159 star in a close binary system, which might for the first time allow a dynamical mass determination for a PG 1159 star. \objectSDSS J212531.92-010745.9 was discovered to show H emission during a systematic search of SDSS archival data for white dwarf + main sequence companion candidates. It was subsequently classified as a PG 1159 star from a spectral analysis of the SDSS spectrum, and found to undergo brightness variations in follow-up time-resolved photometry. The light curve shows a periodicity of 6.95616(33) h, attributable to orbital motion, with a flat bottom part, and no eclipses. The periodic brightening with a peak-to-peak amplitude of 0.7 mag can be interpreted as the light contribution by the irradiated side of the cool companion.
We have continued the photometric coverage of this system during the following 2006 observing season, and report the improved ephemeris with a more accurate period determination in this paper.
2 Observations
Following up the light curve of \objectSDSS J212531.92-010745.9 presented by Nagel et al. (2006), we have obtained new observations with the Tübingen 80 cm and the Göttingen 50 cm telescopes during 19 nights between September and November 2006. The full data set now available is listed in Table 1 with details of the set-up.
Data reduction was done using the TRIPP routines (Schuh et al., 2003). The images were bias, dark, and flat field corrected, and relative light curves were obtained from aperture photometry using the same set of reference stars for all data sets. The flux of the combined data was normalised to its mean value, and all times were heliocentrically corrected.
| Date | t | t | Duration | Telescope | Camera |
|---|---|---|---|---|---|
| 2005/09/21 | 90 | 98 | 18900 | 80 cm | ST-7E |
| 2005/09/22 | 90 | 98 | 18899 | 80 cm | ST-7E |
| 2005/09/23 | 90 | 98 | 21758 | 80 cm | ST-7E |
| 2005/09/23 | 180 | 194 | 4051 | 50 cm | STL-6303E |
| 2005/09/23 | 240 | 254 | 9656 | 50 cm | STL-6303E |
| 2005/10/06 | 240 | 248 | 10202 | 50 cm | STL-6303E |
| 2005/10/07 | 240 | 246 | 14897 | 50 cm | STL-6303E |
| 2005/10/08 | 240 | 248 | 9298 | 50 cm | STL-6303E |
| 2005/10/10 | 90 | 98 | 19852 | 80 cm | ST-7E |
| 2005/10/11 | 240 | 248 | 17872 | 50 cm | STL-6303E |
| 2005/10/18 | 90 | 98 | 16532 | 80 cm | ST-7E |
| 2005/10/26 | 90 | 98 | 20095 | 80 cm | ST-7E |
| 2006/09/12 | 60 | 63 | 15919 | 80 cm | STL-1001E |
| 2006/09/13 | 60 | 63 | 21312 | 80 cm | STL-1001E |
| 2006/09/20 | 60 | 63 | 23056 | 80 cm | STL-1001E |
| 2006/09/20 | 240 | 247 | 17321 | 50 cm | STL-6303E |
| 2006/09/21 | 60 | 63 | 22489 | 80 cm | STL-1001E |
| 2006/09/21 | 180 | 187 | 21441 | 50 cm | STL-6303E |
| 2006/09/22 | 60 | 63 | 22299 | 80 cm | STL-1001E |
| 2006/09/22 | 180 | 187 | 1922 | 50 cm | STL-6303E |
| 2006/09/22 | 420 | 427 | 13388 | 50 cm | STL-6303E |
| 2006/09/23 | 90 | 93 | 22008 | 80 cm | STL-1001E |
| 2006/09/23 | 180 | 187 | 20595 | 50 cm | STL-6303E |
| 2006/09/24 | 60 | 63 | 9805 | 80 cm | STL-1001E |
| 2006/09/24 | 240 | 247 | 24678 | 50 cm | STL-6303E |
| 2006/09/27 | 90 | 93 | 9470 | 80 cm | STL-1001E |
| 2006/09/27 | 240 | 247 | 3205 | 50 cm | STL-6303E |
| 2006/10/08 | 240 | 247 | 11601 | 50 cm | STL-6303E |
| 2006/10/09 | 240 | 247 | 19808 | 50 cm | STL-6303E |
| 2006/10/10 | 240 | 247 | 19241 | 50 cm | STL-6303E |
| 2006/10/11 | 240 | 247 | 19721 | 50 cm | STL-6303E |
| 2006/10/12 | 60 | 63 | 18105 | 80 cm | STL-1001E |
| 2006/10/16 | 60 | 63 | 17602 | 80 cm | STL-1001E |
| 2006/10/16 | 240 | 247 | 16763 | 50 cm | STL-6303E |
| 2006/10/17 | 60 | 63 | 13798 | 80 cm | STL-1001E |
| 2006/10/17 | 120 | 123 | 4052 | 80 cm | STL-1001E |
| 2006/10/17 | 240 | 247 | 18758 | 50 cm | STL-6303E |
| 2006/10/26 | 60 | 63 | 16031 | 80 cm | STL-1001E |
| 2006/10/27 | 60 | 63 | 19739 | 80 cm | STL-1001E |
| 2006/10/30 | 40 | 43 | 11609 | 80 cm | STL-1001E |
| 2006/11/15 | 240 | 247 | 18264 | 50 cm | STL-6303E |
3 Results
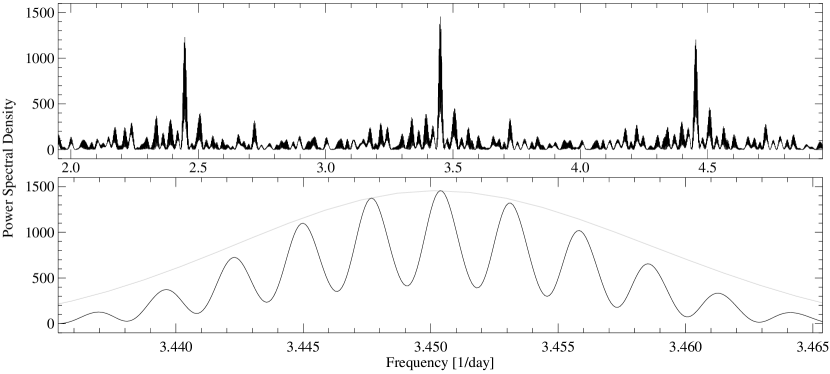
In Fig. 1, we show the periodogram of the combined light curve from 2005 and 2006. The correct position of the dominant frequency can unambiguously be identified from the strong alias pattern. The gain in accuracy over the 2005 data alone is illustrated by the central peak (grey line in the lower panel). By assuming the corresponding period as a start value, the combined light curve was fitted with a non-linear least-squares sine fit. It resulted in an improved period determination of 6.95573(5) h and a sinusoidal amplitude of 0.299(33) relative intensity change (0.284(28) mag). The amplitude (and its uncertainty, determined as the 1 residual scatter of the original data after subtraction of the mean profile) should be considered as an estimate of the magnitude of the brightness change only (for details see the Discussion section).
Referring to the most recent observation to define the zero point, we determine the ephemeris of predicted maxima times to be
The uncertainty in the period corresponds to the 1 formal fitting error, while the uncertainty in the zero point corresponds to half the cycle time in the short-exposure runs.
4 Discussion
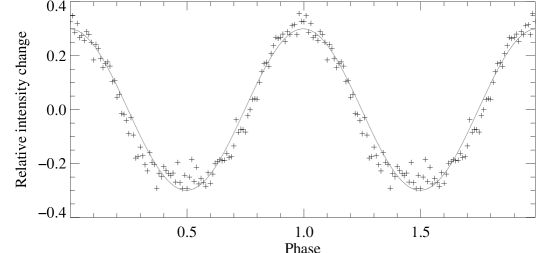
In Fig. 2, we compare the folded profile to the sinusoidal amplitude of 0.299(33) relative intensity change. Clearly, the observed peak-to-peak variation is not fully reproduced by the fit, owing to the broader trough and the narrow maximum already described by Nagel et al. (2006), who fitted magnitude changes, while we now fit intensity changes. For a higher fit amplitude and/or raised zero line, the observed raising and falling edges would lie significantly below the sine fit flanks. Although the light curve solution presented by Nagel et al. (2006) still suffers from a degeneracy in mass and radius for the PG 1159 component, this light curve shape emphasizes the superiority of their more realistic model over a plain sine fit and validates their interpretation of the observed brightening as a reflection effect.
The refined ephemeris and period determination will allow a precise extrapolation of the ephemeris well into the next observing seasons, and facilitate the phasing of radial velocity measurements. This additional information will help to lift the existing degeneracy, so that we will be able to present a more elaborate light curve model in a future paper, and derive the masses in the system.
Acknowledgements.
We thank Sylvia Brandert, Sebastian Wende, Jens Adamczak, Agnes Hoffmann, Ralf Kotulla, Simon Hügelmeyer, Markus Hundertmark, and Johannes Fleig for supporting the 2006 observations; and Klaus Reinsch for encouragement and technical support. We gratefully acknowledge the initialization of this project by Boris Gänsicke who first directed our attention to this special object.References
- Nagel et al. (2006) Nagel, T., Schuh, S., Kusterer, D.-J., et al. 2006, \aaa, 448, L25
- Schuh et al. (2003) Schuh, S., Dreizler, S., Deetjen, J. L., & Göhler, E. 2003, Balt. Astron., 12, 167
- Werner & Herwig (2006) Werner, K. & Herwig, F. 2006, PASP, 118, 183