ECoG observations of power-law scaling in the human cortex
Abstract
We report the results of our search for power-law electrical signals in the human brain, using subdural electrocorticographic recordings from the surface of the cortex. The power spectral density (PSD) of these signals has the power-law form from 80 to 500 Hz. This scaling index is universal, across subjects, area in the cortex, and local neural activity levels. The shape of the PSD does not change with local cortex activity, only its amplitude increases. We observe a knee in the spectra at Hz, implying the existence of a characteristic time scale msec. For we find evidence for a power-law with .
The human brain is arguably the most complex structure known to mankind and on the verge of starting to grasp its own inner workings. How do our brains compute? How fast do they compute? How do they store information? How universal is all of the above? Ever since the first electroencephalography (EEG) recordings in 1924, the study of the electrical activity of the human brain has focused on its prominent low-frequency features, in particular the excitatory and inhibitory rhythms at specific frequencies, like the (10 Hz) and (20 Hz) rhythms eeg . Traditional EEG studies are limited to Hz. The fundamental processes at the individual neuron scale suggest a role of higher frequencies: the time of flight of a spike along an axon, the synaptic neuro-transmittor diffusion time, the integration time of the dendritic arbor. They are all near or sub 10 ms timescales . Synchronization and correlations associated with them are expected to exist at least up to 1 kHz.
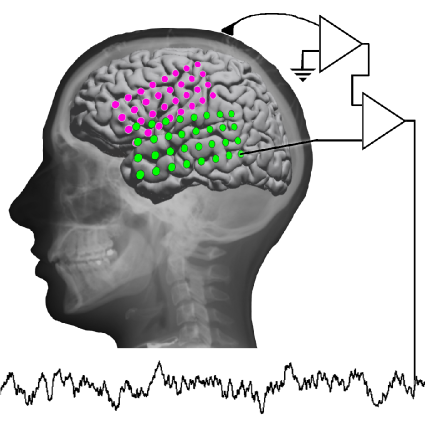
Electrocorticographic (ECoG) recordings from the subdural surface of the cortex have recently made it possible to examine the electrical activity of the human neocortex with finer spatial and temporal fidelity than EEG. An array of electrodes is placed directly on the surface of the cortex, see Fig. 1. The absence of the skull and surrounding tissue increases the electrode voltage while the close proximity to the cortex means that ECoG records very local phenomena. For example, changes in the classical rhythms appear spatially uniform for a given set of tasks in EEG, but vary strongly spatially within the ECoG array for the same tasks eegecogspatial .
The cortical surface potentials from sub-dural arrays reported in this study were obtained from 20 participants receiving clinical monitoring for the localization of seizure foci prior to resection. Each was informed about, and consented to participate in, the University of Washington internal-review-board-approved experimental protocol. The voltage was sampled at 10 kHz (2 subjects) or 1 kHz (18 subjects) using Synamps2 amplifiers (Compumedics-Neuroscan, San Antonio, TX) in parallel with long term monitoring (Xltek, Oakville, ON) from 32 platinum electrodes, encased in silastic, in an 8x4 configuration (4 mm in diameter, with 2.3 mm exposed, separated by 1 cm, center-to-center, Ad-Tech, Racine, WI).
Our earlier studies pwrlawhyp revealed the absence of distinct peaks in the power spectrum beyond Hz. We hypothesized the existence of a power-law of the form at these higher frequencies, and named it the -band/index, but the 1 kHz sampling rate truncated the signal at these high frequencies. The purpose of the study reported here was to determine, as accurately as possible, whether there is indeed such a power-law in the human cortical power spectrum, and how it might change with cortical activity (universality), by using a higher, 10 kHz sampling rate.
Power-laws represent scale free behavior, the finding of which immediately evokes scale free networks, complexity, avalanches, and self-organized criticality (SOC). Unfortunately, many such networks and processes are not large enough or can not be monitored precisely long enough to establish the scale invariance convincingly otherpwrexs ; critphenomena . The human brain is arguably the most complex and largest network available and may provide the best opportunity to observe scale free behavior in a natural setting. Each ECoG electrode measures the voltage power spectral density from a specific cortical surface area associated with a specific set of functions. An electrode pair probes about neurons, and each neuron has up to synapses timescales . This has not gone unnoticed, and the neuroscience literature is awash with attempts to interpret experimental low-frequency data with scale free concepts and models; with only limited success and leaving many questions neuropwrexs . In this paper we firmly establish the existence of the power-law in the -band and the actual value of the scaling index, . We obtain remarkable accuracy, particularly compared to many recent studies of power-law phenomena in nature otherpwrexs . Our accuracy approaches that of what was required and customary in equilibrium critical phenomena critphenomena .
We characterized the power-law in the cortical spectrum during a simple fixation task. The subjects fixated on an “” on the hospital room wall 3 m away from the bed for 130 s (subject S1) or 190 s (subject S2), with their eyes open. The time-dependent voltage between each electrode and the reference electrode was measured at , digitized, and stored for spectral analysis. To further reduce the common mode noise from the environment, the digitized electrode voltages were converted digitally into a set of voltage differences between each near-neighbor pair of electrodes. This significantly removed the high-frequency common mode noise and make it possible to measure well above 100 Hz. For our 4 by 8 array, the 32 individual electrode voltages produce 52 near- neighbor voltages (Fig. 1). All of the measurements reported in this Letter are for near-neighbor voltages.
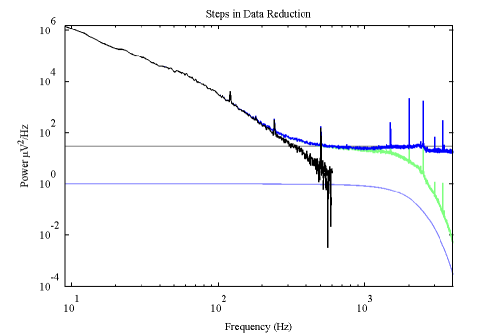
We carefully characterized the amplifiers, their low pass filtering and their noise floor. These external factors affect the power spectrum measurement dramatically. They mask and obscure the underlying power-law from the brain signal. Demonstration of the power-law would not have been feasible without these corrections. Fig. 2 shows these corrective steps in the data reduction. First, the power spectral density is calculated from the Fourier transform of the time-varying near-neighbor voltages in 1 s Hann-windowed epochs, overlapping by 0.5 s. These are averaged into uncalibrated spectra (marked green in Fig. 2). They suggest a power-law shape, but the roll-off, apparent above 1 kHz, masks it. This roll-off does not represent a characteristic high-frequency in the brain. It originates in the amplifiers. We measured the gain versus frequency of the amplifiers independently. Their spectral bandwidth shape follows a classic low-pass filter (shown as blue in Fig. 2). Removing the amplifier response from each uncalibrated spectrum leads to spectra (dark blue) that level-off at high frequencies, indicating that we hit a noise floor. This noise floor does not reside in the cortex either. We measured the amplifier input noise for our amplifier-digitizer system independently. It is of order V per root Hz for every amplifier. Subtracting this from the spectrum leads to a power spectrum that remarkably tightly fits a straight line in the log-log plot (the black line see Fig. 2) until at 500 Hz the signal disappears into the fluctuations of the amplifier noise floor. Future experiments with lower noise floor amplifiers will tell how high in frequency the power-law actually continues.
Small variations and uncertainties in the amplifier noise floor significantly affect the quantitative analysis of the power-law. For that reason we perform 3 parameter fits, . All such estimates for are within the uncertainty of our independent amplifier noise floor measurements.
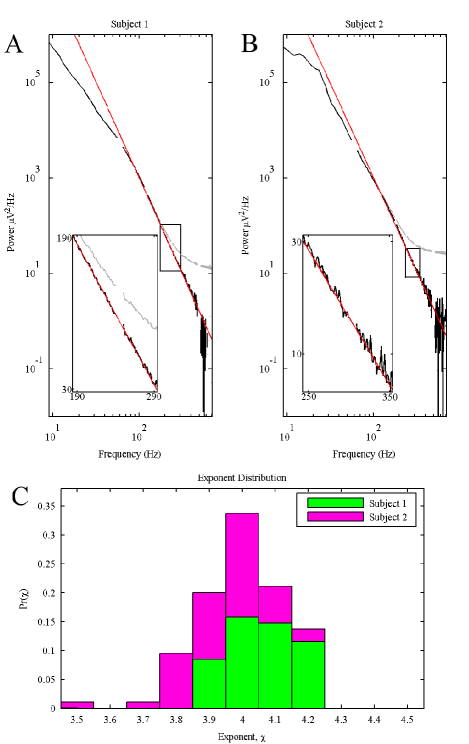
Fig. 3 shows the combined spectrum, averaged over electrode pairs, for each subject. We exclude electrode pairs where one of the electrodes sits primarily on top of a vasculature, resulting in a much lower power in the signal and increased sensitivity to noise (4 channels for S1, 5 channels for S2). The inserts illustrate the quality of the power-law, the jitter around the average curve is more than one decade down from the signal, for all Hz, beyond which the amplifier noise floor fluctuations start to kick-in. The exponent and the parameters and are estimated via a set of log-log type least-squares linear fits of the power spectral density between 80 and 400 Hz, excluding harmonics of 60 Hz. This leads to for S1 and for S2. The error bars are based on robustness against range shrinking as well as the deviations of the best fit with respect to the actual data across the entire frequency range Hz.
To test for universality, we also performed the exact same type of fits to each individual electrode pair spectrum. The histograms for S1 and S2 in Fig. 3 overlap well and the variations within each can easily be attributed to stochastic external issues, such as variations in electrode-cortex distance and vasculature. A such, we reached the accuracy limit imposed by the experimental set-up. Within this accuracy, is universal; it does not vary with subject nor specific brain areas. The mean value of the histogram exponents for S1 is (STD=0.10, N=48), and for S2 (STD=0.13, N=47), consistent with the above fitting analysis on the two averaged spectra. We conclude that throughout the frequency range Hz.
Previous estimates of a power-law in the cortical spectrum cortfit focused on low frequencies. The averaged power spectrum of S1, in Fig. 3 shows a knee at Hz, and suggests a different power-law below . Both seem absent in S2. The rhythms are strongly pronounced in every channel pair of S2 (and are clearly visible in Fig. 3). They obscure whatever power-law might be present underneath. Eight electrode pairs from S1 lack rhythms. They may be absent in these local cortical areas, or so tightly synchronized that they cancel out in the electrode pair voltage difference. A simple minded fit through their average from 15-80 Hz, yields (N=8). However, such local fits are inherently dangerous. They are blind to the global properties of the spectrum. Our high frequency analysis of is already a clear illustration of this. The amplifier roll-off and noise floors truncate our data only beyond Hz, but they affect the spectrum already at much lower frequencies (Fig. 2). Similarly, the high frequency power-law is already in-play below . Indeed, the global two-powerlaws form
with constraint , shifts down to (STD=0.21, N=8), with cutoff Hz.
The 8 S1 channels form a dangerously small ensemble. We performed the same analysis on 1 kHz data for the exact same 2 minute fixation task from 16 subjects, with electrode arrays in the lateral frontal/temporal/parietal cortex. The spectra were determined and corrected for amplifier-digitizer frequency dependent attenuation in the same way as the 10 kHz data. We selected again only those channel pairs (N=116) that lacked the rhythms. Naive fits from 15-80 Hz (excluding 57-63 Hz line noise) of these corrected spectra yield again (STD=0.4, N=116); while the same global two power-law form, shifts this down again to (STD=0.4, N=116) when setting and .
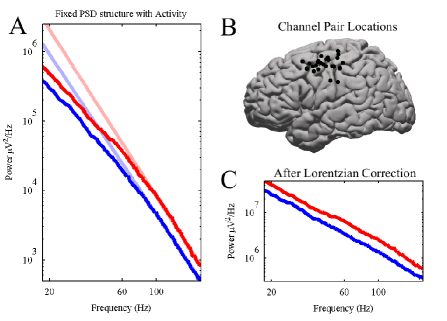
The uncertainty in the value of remains quite large. Even the existence of this low frequency power-law remains in question, until we collect more 10 kHz data. The analysis also requires a reliable decomposition of the low frequency rhythms from the background. We demonstrated that principle component analysis (CPA) techniques can achieve this Kai-next ; pwrlawhyp . Fig. 4 illustrates this for 1 kHz data. Five subjects performed a finger movement task. A visual cue indicated when to move a given finger (repeatedly flex/extend one finger at a time; opposite side of body from grid placement), and the position of each finger was recorded using a dataglove (5dt; Irvine, CA). Samples of movement spectra of each type were calculated from the FFT of 1 s Hann-windowed epochs centered at the maximum displacement of the finger during each flexion. Rest spectra were calculated from epochs in which there was no hand movement. The spectra were corrected for amplifier-digitizer frequency dependent attenuation. Differences between variations in versus high frequency allows a PCA removal of the peaks from all the power spectra. We were able to identify electrode pair channels which demonstrated significant shifts in power during specific activity (single finger movement type) versus rest. A subset of five such channels was chosen naively (based upon significance rather than being hand picked) from each subject, and the average spectrum for the specific movement type causing change (the “active” state) was compared to the average rest spectrum (the “inactive” state), after the peaks had been decoupled and largely removed.
Fig. 4 addresses several issues: Earlier pwrlawhyp ; eegecogspatial , we observed changes in the -band during behavior tasks and hypothesized how those can be used directly to quantify activity in the brain in a variety of practical settings; e.g., the total power in the - band increases with activity versus rest. Fig. 4 demonstrates that this increase in spectral power with activity extends over all frequencies. Moreover it strongly suggests that the shape of the spectrum is preserved (universality). The above two-powerlaws form fits the shape well; with Hz, , and , within 10%; a level of accuracy to be expected within the limitations of the 1 kHz nature of this data. The active/inactive power ratio (between the amplitudes ) is unlikely a universal number. In this data set its geometric mean is equal to with a variation of order 0.34 (N=25).
What does all of this teach us about computations and correlations in the brain? EEG and ECoG voltages represent the superposition of the electric current dipole fields generated by the very large collective of nearby neurons and their associated ionic channel currents, propagated through the complex mass of ionic extracellular liquid and neuronal and glial membranes. This is a quite complex phenomenon and not yet well understood quantitatively. Moreover, the underling neuron computational issues remain in flux, e.g, understanding the relative roles of computations at the level of dendritic trees versus those at larger length and time scales associated with the connectivity the network of neuron.
If the value of the high-frequency exponent were distinct from an integer, we could have reported safely to have observed SOC type complex scale free behavior in the cortex. The uncertainty in still leaves room for this. Perhaps SOC behavior (if it exists) is only expressed in more subtle ways in ECoG. In the case , the spectrum is well described as a product of two Lorentzian shapes. These can originate without any SOC complexity: such as white noise with two filters; as the product of an exponential decaying correlation function and a temporal form factor; as two processes with definite correlation times; etc.
Our results place definite constraints on future brain modeling. ECoG spectra definitely scale as across all Hz. The value is universal, across subjects, areas in the cortex, and local neural activity levels. The knee in the spectra at Hz, implies the existence of a characteristic time scale msec, probably originating at the neuron length scale and surviving the coarse graining to the 2 mm electrode size length scale.
Acknowledgment – This research is supported by NSF grants BCS-0642848 (KM,JO) and DMR-0341341(MdN), We like to thank the patients and staff of Harborview Hospital, Seattle, WA.
References
- (1) See e.g., E. Niedermeyer and F.L. da Silva, Electroencephalography: Basic Principles, Clinical Applications, and Related Fields (Lippincott Williams & Wilkins, 2005).
- (2) for a review see: G.M. Shepherd , The Synaptic Organization of the Brain (Oxford Univ. Press N, 1998).
- (3) Crone et al., Brain 121:2271 2299 (1998) and Brain 121: 2301 2315 (1998).
- (4) Miller, KJ, et al. J. Neurosci, 27(9):2424-2432 (2007); NeuroImage, 37:504 507 (2007); IEEE-TBME, in print.
- (5) A Clauset, et.al. , Power-law distributions in empirical data, eprint arXiv: 0706.1062 (2007)
- (6) For a discussion see, e.g., Marcel den Nijs, Growth in Scale Invariance, APCTP Bulletin, 3, 18-23 (2000).
- (7) John M. Beggs and Dietmar Plenz, J. Neuroscience 23(35), 11167(2003); M. Shimono et. al. PRE 75, 051902 (2007); M. Usher, et. al., PRL 74 326 (1995).
- (8) C. Bédard, et.al. PRL 9, 118102 (2006); L. Arcangelis et. al. PRL 96 ,028107 (2006).
- (9) Miller, KJ, et al., to be published.