Cost-driven weighted networks evolution
Abstract
Inspired by studies on airline networks we propose a general model for weighted networks in which topological growth and weight dynamics are both determined by cost adversarial mechanism. Since transportation networks are designed and operated with objectives to reduce cost, the theory of cost in micro-economics plays a critical role in the evolution. We assume vertices and edges are given cost functions according to economics of scale and diseconomics of scale (congestion effect). With different cost functions the model produces broad distribution of networks. The model reproduces key properties of real airline networks: truncated degree distributions, nonlinear strength degree correlations, hierarchy structures, and particulary the disassortative and assortative behavior observed in different airline networks. The result suggests that the interplay between economics of scale and diseconomics of scale is a key ingredient in order to understand the underlying driving factor of the real-world weighted networks.
pacs:
89.75.Da,89.40.Dd,89.75.-kI Introduction
Recently there is an increasing interest in studying weighted networks dynamics. A wide array of models have been formulated to capture various properties of real weighted networks Boccalettia . These models gradually take the social and economic aspects into account in addition to physical properties. At first some conditions in BA model BA1 ; BA2 are relaxed to induce weight driven mechanism and weight dynamics coupling with topology growth Antal ; BBV1 ; BBV2 ; BBV3 ; DM ; Wenxu Wang . Then for networks with spatial properties, physical distances are included as weight and show its critical role in the evolution of networks putting constraints on long-range links Kaiser ; GuimeraEPJB ; Barratspatial ; Yukio . Recently noticing transportation networks are designed with optimal objective, some models Barratoptimal ; Gastner1 ; Gastner2 ; Yanbo Xie propose different optimization policy either to minimize the whole system cost or every traveler’s cost and reproduce spatial structures in real networks. Very recently human behavior on networks are considered into the modeling yihong . Most of these models mention cost when explaining the rationality of the settings such as disadvantaged long-rang links and optimal policies. However, they don’t explicitly model cost which in economics perspective is the underlying driving factor of human behavior and the world.
Here we propose a model based on the theory of cost in micro-economics which includes two rules: economy of scale and diseconomy of scale. Economy of scale means reduction in cost per unit resulting from increased production or service, while diseconomy of scale is vice versa. Transportation networks are designed and operated by companies with objectives to reduce cost and improve profit. Therefore transportation networks obey the rules in micro-economics. High traffic allows companies to use large aircrafts and airports to utilize the facilities more frequently so that the average operating cost is lowered. The hub-and-spoke structure in airline networks also arise from economy of scale because consolidation of passengers in different airplanes into one aircraft at the hub can reduce operating cost greatly. Without this economic benefit, the hub-and-spoke structures would not dominate the airline industry for decades. On the other hand diseconomy of scale also exist in transportation networks: high traffic over capacity will bring extra cost due to congestion and increasing management problems. The effect of congestion cost is evident in transportation networks and communication networks as discussed in Ashton ; Jarrett ; Danila1 ; Danila2 ; JJWu . Unlike road networks and communication networks, the congestion in airline networks only occur at airports which have limited capacity. Busy flights make it costly to obtain a new flight slot and easy to be delayed for mistakes in scheduling and coordination.
With the objective of reducing cost and maximizing profit, airline companies have to trade off between the economy of scale and congestion effect when they want to establish new flights. The cost reduction in connecting hub airports and high management fares for congestion can be incorporated into one single cost function to represent the average total cost. Our model assumes topological growth and wight dynamics are both determined by cost adversarial mechanism. With actual cost functions in airline industry our model reproduces key properties of real airline networks: truncated degree distribution, nonlinear strength degree correlation, hierarchy structure, and particulary the disassortative and assortative behavior observed in different airline networks. And comparing different outcomes from different cost functions, we can draw the conclusion that economy of scale introduces scale-free behavior and diseconomy of scale is the reason for the cut-off in truncated power-law distribution.
The rest of the paper is organized as follows: in section two, we formulate the model and give concrete cost functions on vertices and edges. In section three, we discuss degree evolution results obtained by simulations and compare the simulation results from four different cost functions. Section four analyzes the network structure using cluster coefficient and degree correlations. The last is conclusions.
II The Model
We assume the initial network has nodes with existing links. There are initial weights on the links. The networks evolutes according to the following rules:
-
•
Growth. At each step, a new node emerges with links. The probability of connecting old nodes is determined by:
(1) where , the cost of connecting vertex , is a function of strength . This rule suggests that vertices with low cost have large possibility to be selected.
-
•
Weight dynamics. All the connections are supposed to update their weights according to the following probability:
(2) where
(3) where , the cost on edge, is a function of weight . Edges with low cost have large probability to increase traffic.
There are two types of cost functions in the model: cost on vertices and cost on edges. Using different cost functions this model can be used to simulate different networks such as airline networks and supply chain networks. In airline networks cost on vertices is the average total cost at airports including service fares and congestion cost etc. Airline companies prefer airports with low cost to open new flights. Cost on edges is the average operating cost of aircrafts including fuel, pilots, maintenance cost etc william . The flight with low cost are more attractive to passengers and airline companies will add more aircrafts for the flight to meet the growing traffic. In supply chain networks the cost on vertex represents the average production cost in firms and the cost on connections represents average transaction cost between firms. A firm would like to choose business partners with low production cost and increase business interactions between firms with low transaction cost.
Using appropriate cost functions, the model can recover some classic models. Let and , the probability becomes . This is the classical strength driven mechanism. And since the weight don’t increase, the model becomes equal to BA model. If and is constant, the old nodes are selected equally. The model produces random networks. If and , the model becomes the traffic-driven model in Wenxu Wang .
In the following we give cost functions in airline industry. The cost function on vertices is:
| (4) |
where is the capacity of airports. The former part of the cost function is decreasing with to represent economy of scale. The latter part of cost function is increasing with representing congestion cost according to well-known BPR (US Bureau of Public Road) function and Philips . The average operation cost at airports first decrease with increasing traffic. When the traffic is over the airport’s capacity, congestion emerges and bring extra cost. This function is analogous to the classical average production cost function in micro-economics with the convex curve.
The cost function on edges is defined as:
| (5) |
in which average aircraft operation cost is decreasing with traffic. As we know congestion only occur at airports. So the cost on edge only have economy of scale effect. According to Horner ; OKelly ; william ; Alan ; Philips , the total cost for operating a flight is a Cobb-Douglas function . is traffic volume and is stage length. Because we want to focus on cost in this model, we ignore the physical distance and get the above equation (5), leaving spatial properties to another paper, . With the increase of traffic, average aircraft operation cost decrease. This is so-called economy of scale in airline industry.
III Degree distribution
The simulation result shows economy of scale contribute to scale-free behavior and congestion effect introduces a cut-off into scale-free degree distribution. See curve 2 in Fig.1. It’s get under the model with the above mentioned cost functions (4) and (5). The distribution decays as a truncated power-law:
| (6) |
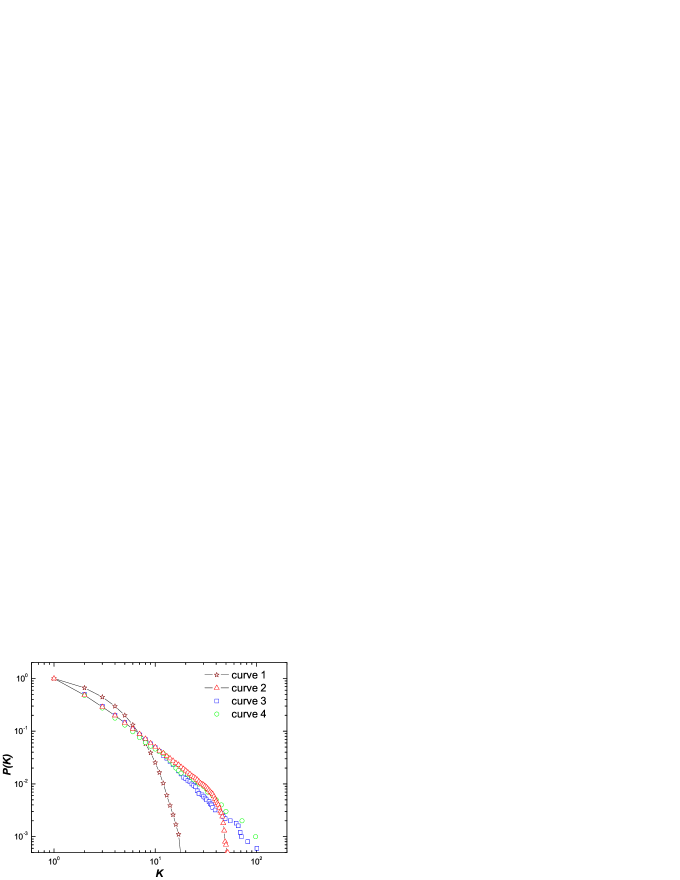
All the airline networks reported in literature have such truncated power-law degree distributions Wli ; Bagler ; GuimeraPNAS ; hongkun liu ; Wangru ; Dingding . Several models are proposed to explain it. The limit of connections to one airport is regarded as the reason AmaralPNAS . Spatial constraints are incorporated to discourage long-rang links GuimeraEPJB ; Barratspatial . However, spatial constraints are more appropriate to road networks rather than to airline networks. Opening a direct flight is convenient in airline networks since it does’t require a physical link. And if one flight can make money, even the longest links can be set up as long as it’s within the modern airline technology capability. Geography distance is found insignificant when topological ingredient plays a more important role Yanbo Xie . Therefore our model try to provide an explanation from inherent economic perspective. To elaborate this point, we compare the following four scenarios.
First, suppose there is no diseconomy of scale but only economy of scale on edges and vertices. Let , , , and . Run the model and get the distribution as curve 4 in Fig. 1 which obey power-law distribution: , .
Second, we consider the case there are only economy of scale on vertices with , , and . In this circumstance, the probability of connecting old vertices is proportional to node strength and the weight is fixed. The degree distribution is displayed as curve 3, a power-law with the exponent a little small than curve 4.
Comparing the curve 2, 3 and 4, we can see the congestion effect contribute to the cut-off in the scale-free distribution and the exponent of the power-law is influenced by the extent of economy of scale. Double economy of scale on edges and vertices enhanced the scale-free behavior in curve 3.
Finally, if there are either economy of scale or congestion effect, i. e. constant, constant and , the new vertex has no preference in connecting old vertices and the weight keeps fixed. We get random networks with the curve 1 obviously not a power-law distribution. From the comparison between curve 1, 3 and curve 4, we can see the scale-free behavior comes from economy of scale
IV Strength and degree
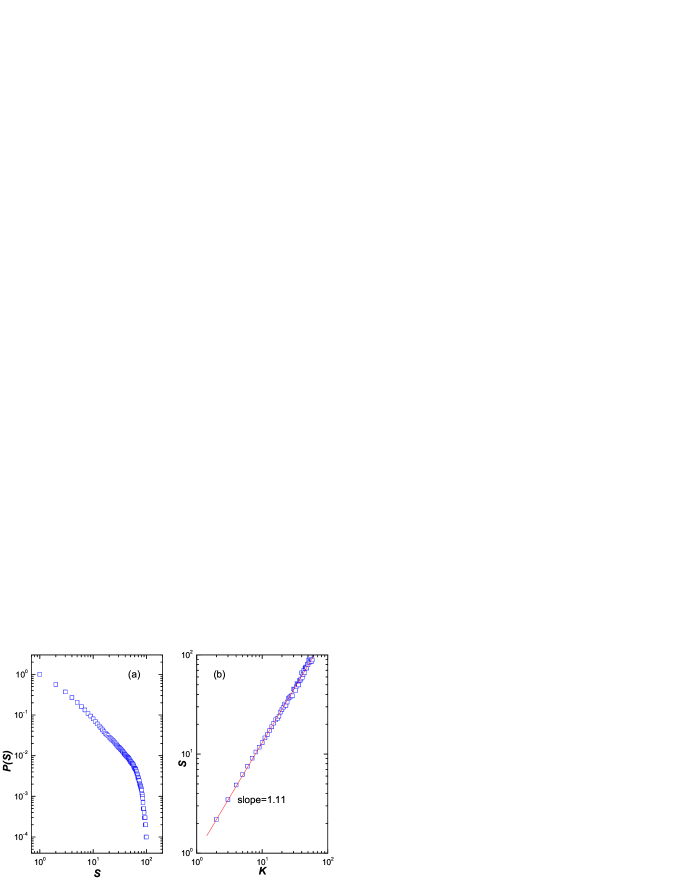
Strength distribution and relation between strength and degree are reported in Fig. 2. The strength distribution also display as a truncated power-law. And the average strength of vertices with degree displays a non-trivial relations with degree as confirmed by empirical observations in airline networks of China, India, worldwide and North-America and other transportation networks Andrea . A large number of evolution models of weighted networks produce linear relations between strength and degree like the BBV model while only several models can reproduce non-trivial relations Wenxu Wang ; Yanbo Xie ; Barratspatial . The nonlinearity in our model is induced by the nonlinear cost change with the increasing traffic on edges and vertices.
V Network structure
To analyze the network structure, we calculate the cluster coefficient and degree correlations in both pure topological and weighted formulations defined in BarratPNAS . The simulation result is shown in Fig. 3.
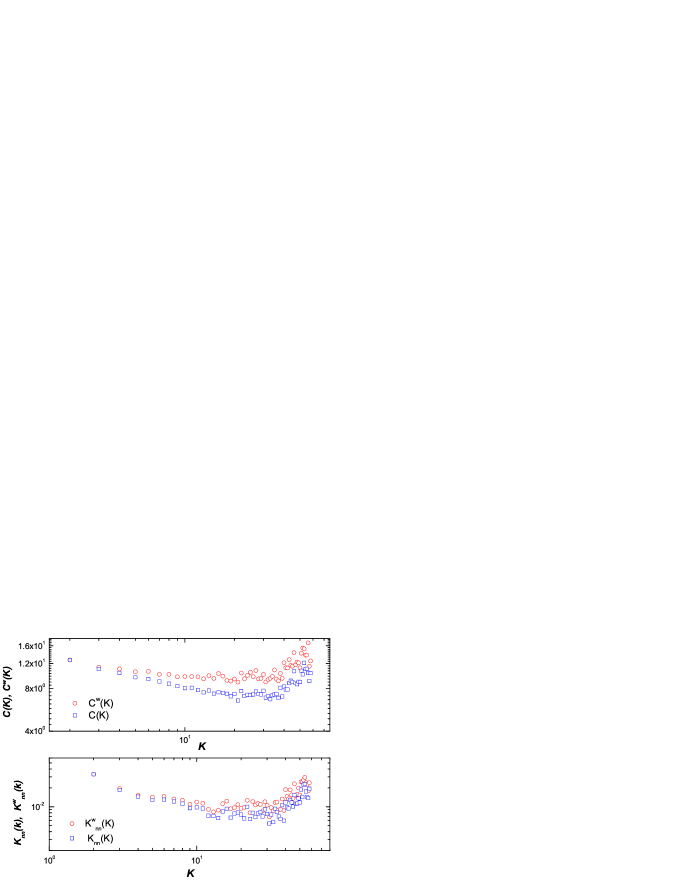
Both weighted cluster coefficient and weighted degree correlations are larger than cluster coefficient and degree correlations respectively, in good agreement with the empirical data in airline networks. This result reveals the existence of a rich-club phenomenon in that important nodes form a group of well interconnected nodes. In other words large vertices are well interconnected by large traffic edges. The interconnected hubs have a major role in the network dynamics and organization.
Degree correlations is a measure of assortativity. If is increasing with , the network is called assortative, i. e. large degree nodes tend to connect with large degree nodes. While is decreasing with , the network becomes disassortative. Our simulation result and decreases first in small degree then increases when the degree becomes large. This means in small range the network behaves disassortative but in large degree range the network behaves assortative. This can be understood in the dynamic process in the model. With small degree the diseconomy of scale doesn’t show its constraint on the connections to the hub. New node’s connection to hub is welcome and contributes to disassortativity. When the hub becomes very large the congestion effect emerges and prevents further connections from new nodes. But the traffic between hubs are keeping growing because low cost from economy of scale attract passengers and thus makes airline companies open more flights.
This result can explain some inconsistent results observed in real airline networks. Bagler ; hongkun liu ; Dingding shows negative degree correlations in Chinese, India and Australian airline networks, while Barratspatial shows positive degree correlations in Worldwide airline networks (WAN) and North American networks. In our opinion this is due to the different scale of the networks and the different extent of economy of scale and diseconomy of scale. The airline networks of China, India and Australian are relatively small and have less traffic compared with the worldwide airline network and North-America network. Therefore they are more influenced by economy of scale than diseconomy of scale. That’s why they display disassortative while WAN and North-America networks show assortative.
VI Conclusions
In this paper we present a general model for weighted networks based on the theory of cost in micro-economics including economy of scale and diseconomy of scale. Our model reproduces key properties of airline networks such as truncated power-law degree distribution, non-linear relations between strength and degree, and hierarchy structure. This model can produce broad distribution of networks if we adopt appropriate cost functions. Particulary the disassortative and assortative behavior observed in different airline networks can be reproduced and explained by our model.
The main difference between our model and previous models is that our model incorporates realistic economic factor into the modeling. Airline networks are widely studied in economics, operations research, engineering, transportation research and business management. They are designed and operated to achieve optimal objectives. Therefore airline networks evolution is quite different from natural networks such as biological networks. Omit the economics and human being behavior, we can’t entirely understand the airline networks evolution. Besides airline networks, the model can also be used to simulate other networks with economic properties such as supply chain networks. Our work discloses that the interplay of economy of scale and congestion effect determines the evolution of networks. We hope this model can enlighten our understanding towards realistic weighted networks evolution.
Acknowledgements.
The work was supported by Natural Science Foundation of China (NSFC 70432001).References
- (1) S. Boccaletti., V. Latora, Y. Moreno, and M. Chavez, D.-U. Hwang, Physics Report, 424 175-308 (2006).
- (2) Barabási A L, Albert R. Science, 286 509-512 (1999).
- (3) Barabási A L, Albert R, Jeong H. Physica A, 272 173-187 (1999).
- (4) T. Antal and P. L. Krapivsky, Phys. Rev. E, 71 026103, (2005).
- (5) A. Barrat, M. Barthélémy, and A. Vespignani, Phys. Rev. Lett., 92 228701 (2004).
- (6) A. Barrat, M. Barthélémy, and A. Vespignani, Phys. Rev. E, 70 066149, (2004).
- (7) M. Barthélémy, A. Barrat, R. Pastor Satorras, A. Vespignani, Physica A, 346 34-43, (2005).
- (8) S. N. Dorogovtsev and J. F. F. Mendes, arXiv: cond-mat/0408343.
- (9) Wen-Xu Wang, Bing-Hong Wang, Bo Hu, Gang Yan, and Qing Ou, Phys. Rev. Lett. 94 188702, (2005).
- (10) M. Kaiser and C. C. Hilgetag, Phys. Rev. E, 69 036103, (2004).
- (11) R. Guimera and L.A.N. Amaral, Eur. Phys. J. B, 38: 381-385, (2004).
- (12) A. Barrat, M. Barthélémy, and Alessandro Vespignani, J. of Stat. Mech., P05003, (2005).
- (13) Yukio Hayashi and Jun Matsukubo, arXiv: physics/0512011v2.
- (14) A. Barrat, M. Barthélémy, and Alessandro Vespignani, J. of Stat. Mech., L07002 (2006).
- (15) M. T. Gastner and M. E. J. Newman, Phys. Rev. E, 74 016117, (2006).
- (16) M. T. Gastner and M. E. J. Newman, Eur. Phys. J. B, 49 247-252, (2006).
- (17) Yanbo Xie, et al, Phys. Rev. E, 75 036106, (2007).
- (18) Yihong Hu, Daoli Zhu, Nianqu Zhu, arXiv: 0709.4143v1.
- (19) R. Guimera, A. Diaz-Guilera, F. Vega-Redondo, A. Cabrales, and A. Arenas, Phys. Rev. Lett., 89 248701, (2002).
- (20) Douglas J. Ashton, Timothy C Jarrett, and Neil F. Johnson, Phys. Rev. Lett., 94 058701, (2005).
- (21) T. C. Jarrett et al, Phys. Rev. E, 74 026116, (2006).
- (22) Bogdan Danila, et al, Phys. Rev. E, 74 046114, (2006).
- (23) Bogdan Danila, et al, Phys. Rev. E, 74 046106, (2006).
- (24) J. J. Wu, Z. Y. Gao, H. J. Sun, H. J. Huang, Euro. Phys. Lett., 74 (3) 560-566, (2006).
- (25) Philips Lederer and Ramakrishnan Nambimadom, Operations Research, 46 (6) 785-804, (1998).
- (26) Mark W. Horner, M. E. O’Kelly, Journal of Transport Geography, 255-265, (2001).
- (27) M. E. O’Kelly, D. L. Byron, Transport Research B, 32 (8) 605-616, (1998).
- (28) William M. Swan and Nicole Adler, Transportation Research Part E, 42 105-115, (2006).
- (29) Alan Abouchar, The Canadian Journal of Economics, 3, (3) 463-475, (1970).
- (30) Amaral et al, PNAS, 97, 11149-11152, (2000).
- (31) W Li and X Cai, Phys. Rev. E, 69, 046106, (2005).
- (32) G. Bagler, arXiv: cond-mat/049773.
- (33) R. Guimera, et al, PNAS, 102: 7791-7799, (2005).
- (34) Hongkun Liu, Tao Zhou, Acta. Phys. Sin., 56, 106 (2007).
- (35) Wang Ru, Cai Xu, Chin. Physics. Letters, 22 (10) 2715, (2005).
- (36) Dingding Han, Jianghai Qian, and Jingao Liu, arXiv: 0703193v2.
- (37) Andrea D. Montis, M. Barthelemy, et al, arXiv: physics/0507106v2.
- (38) A. Barrat et al, PNAS, 11, 3747-3752, (2004).