Benefits of Diversity, Communication Costs, and Public Opinion Dynamics††thanks: The authors thank the National Bank of Belgium for financial support.
Abstract
We study the dynamics of public opinion in a model in which agents change their opinions as a result of random binary encounters if the opinion difference is below their individual thresholds that evolve over time. We ground these thresholds in a simple individual cost–benefit analysis with linear benefits of diversity and quadratic communication costs. We clarify and deepen the results of earlier continuous–opinion dynamics models (Deffuant et al., Adv Complex Systems 2000 [1]; Weisbuch et al., Complexity 2002 [2]) and establish several new results regarding the patterns of opinions in the asymptotic state and the cluster formation time.
Keywords: Opinion dynamics, agent–based models, diversity, communication
costs.
Number of text pages: 14. Number of Figures: 7. Number of Tables: 2.
1 Introduction
The study of the effect of public opinion on government policies has a long tradition in social sciences. In a breakthrough article, Page and Shapiro [3] find that public opinion affects policies more than policies affect opinion. This effect is particularly strong for large and sustained changes in public opinion and for policy issues that are more salient.
Given that public opinion is a major determinant of government policies, one naturally asks: How public opinion is formed? What drives those large and sustained changes in public opinion? In a recent study, Blinder and Krueger [4] find that ideology shapes public opinion more than self–interest or economic knowledge. This implies that the utility–maximizing rational–choice framework is perhaps not the most adequate avenue for understanding public opinion. Indeed, discussing the findings of Blinder and Krueger [4], Nordhaus hypothesizes that “public opinions about the economy in a democracy are the outcome of a very complex process in which people try to sort through conflicting accounts and theories, often provided by unreliable narrators” [5].
This statement indicates that the role of social interactions is crucial in public opinion formation and dynamics. Following this line, a small but growing interdisciplinary literature tries to model public opinion formation as a process shaped by individual–level social interactions. Based on an early paper by Follmer [6], Orléan [7] and Ianni and Corradi [8] analyze the dynamics of public opinion assuming binary opinion values (e.g. for or against a certain issue). Orléan [7] finds that if social interactions are non–sequential, public opinion dynamics is often non–ergodic, i.e. the asymptotic behavior of the opinion formation process is not described by a unique limit distribution, independent of the initial conditions. Ianni and Corradi [8] consider a model in which an individual tends to conform with the opinion held by the majority of her neighbors. They study several majority rules and describe under which rules public opinion converges to a consensus (a single cluster of opinions) or becomes polarized (two large clusters).
The insight provided by these papers is surely relevant for the understanding of public opinion formation. However, they remain limited to binary opinions, whereas most of real–world questions relate to multiple or continuous opinions. For instance, while a citizen states that she is a liberal or a conservative, the strength of her position contains much richer information about her preferences. On certain issues there is probably more disagreement between a radical liberal and a moderate liberal than between the latter and a moderate conservative. Moreover, on certain political issues public opinion is divided between left, center, and right (three clusters), which lies beyond the reach of the simple binary–opinion models.
We are thus interested in understanding public opinion formation under the assumption of continuous opinions. The literature in this direction is scarce. Deffuant et al. [1] and Weisbuch et al. [2] study the dynamics of a model where agents adjust their opinions as a result of random encounters whenever the difference in opinions is below a certain threshold. This threshold captures the degree of openness of an agent towards opinions differing from hers. They find that high thresholds lead to convergence towards consensus, while low thresholds generate several opinion clusters.
So far, however, our understanding of public opinion formation is limited to this fundamental insight. The following crucial questions remain open: Why in some contexts citizens are more open towards differing opinions than in others? Does this openness vary between moderate citizens and their more extremist counterparts? And if so, how the differences in relative openness within a community affect public opinion dynamics?
This paper provides answers to these questions by adapting the model of Deffuant et al. [1] in a simple but flexible way capturing various forces that may affect the relative openness of moderates and extremists. Our basic focus is on the technological characteristics of social interactions, as described by the benefits of diversity versus communication costs. This tension represents the fundamental trade–off of openness. On one hand, being more open towards other opinions can bring in informational benefits that come from opinions built using very different sources. On the other hand, being more open implies the obligation to communicate with very different individuals, and in such case communication costs can be high. In this paper, we show how this trade–off affects the patterns of public opinion and the dynamics of opinion formation process.
We also analyze the time needed for the population to form the main opinion group in the consensus case and the two largest groups in the polarization case. The cluster formation time is detemined, on one hand, by the technological characteristics of interactions and, on the other hand, by the size of community. In the case of polarized communities, the fundamental openness trade-off plays the key role in the dynamics of opinion formation process.
2 The model
Consider a community populated by individuals. Each citizen holds at time an opinion which is represented by a continuous variable ranging between and , for . Time evolves in discrete steps, and social interactions occur randomly according to the following rule. In each time step, two citizens are randomly drawn from the current distribution. Both citizens learn each other’s opinion and each of them compares the distance in opinions, i.e. the absolute value of opinion difference, with her individual threshold , also represented by a continuous variable ranging between and . If the distance in opinions is lower than the threshold, the citizen’s next–period opinion gets closer to that of her partner in this match. Otherwise, her opinion remains unchanged in the next time step. Thus, for a match involving citizens and , we have:
| (1) |
and similarly for . Given that the convergence parameter does not fundamentally affect the results (see Neau [9]), we set to minimize computation time in simulations.
Note that the threshold is individual and dynamic. This is different from the basic model of Deffuant et al. [1], where all citizens have the same constant threshold, as well as from the extended model of Weisbuch et al. [2], where the threshold can change in relation to the variance of the distribution of opinions sampled by the agent.
We assume that the following rule links an agent’s opinion to her threshold:
| (2) |
where measures the distance of the opinion of agent at time from the furthest extreme opinion. The individual threshold is thus shaped by two forces:
-
(i)
Benefits of diversification, . It captures the hypothesis that a citizen closer to one extreme (thus further from the other extreme) is likely to meet someone whose opinion is very different from hers, and thus can potentially reap large benefits of diversity. For instance, people at the two extremes may get information from very different sources and their social interaction can help both of them to get a highly informative a posteriori signal about the true state of the world. Thus, we assume that the opinion distance from the other extreme has a positive linear relationship with the threshold.
-
(ii)
Communication costs, . The likelihood of meeting someone with a very different opinion implies that the communication costs with such a person are also likely to be higher. Moreover, higher distance implies lower trust, as shown empirically by Alesina and La Ferrara [10]. It is plausible that the increase in the communication cost (as the distance to one extreme decreases) is not constant but growing. We capture this second channel by a negative quadratic relationship between the distance from the furthest extreme and the threshold.
We do not know a priori which of the two channels dominates and shapes opinion dynamics. We therefore study the behavior of the social system for a large range of parameter values (that describes the incremental benefit of diversity) and (describing the increase in the incremental cost of communication). Since we are interested in the relative weight of these two channels, we introduce an additional parameter, , which allows us to rewrite (2) as follows:
| (3) |
These two channels have also a sociological interpretation. captures the motivation that makes people to construct friendship relations: the more friends you have the easier you can find help when in trouble. represents the dissonance force that prevents one from becoming a friend with someone that holds a too distant opinion.
Typically, after a certain number of encounters the opinion distribution starts to exhibit one or more clusters. These are sizeable groups of citizens holding relatively close opinions. Eventually, the social system reaches an asymptotic state such that the opinion distribution becomes stationary.
This asymptotic state will be mainly characterized by the following two measures: the number of clusters that form and the cluster formation time. We define these measures more precisely below. We also characterize and study the existence and the number of large and small clusters.
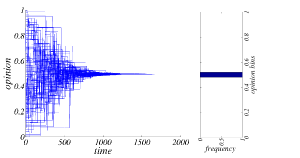
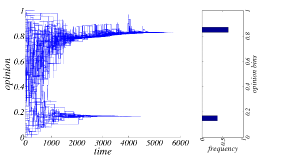
Figure 1 presents two typical realizations of the numerical simulations of our model. For both realizations we assume agents with an initial distribution of opinions being uniform on interval. The realization in panel (a) corresponds to the case with and , and it exhibits consensus: there is a unique cluster of opinions in the asymptotic state. The realization in panel (b) is obtained under parameters and and corresponds to the polarization case.
The first step in our analysis is to define a cluster more precisely. Because of the dynamics of the model, in the asymptotic state all clusters are clearly separated. We divide the whole opinion space in uniform bins (we used bins with width ) and we define a cluster as a group of agents whose opinions are contained in neighboring bins. Moreover a cluster is large if it contains more than of the total number of agents; otherwise we call it a small cluster.
In the asymptotic state, each cluster has an associated cluster opinion, i.e. the opinion shared by all agents in the cluster. An agent is aggregated into the cluster if her opinion differs from the cluster opinion by less than a certain cutoff (we use the cutoff equal to ). This is an a posteriori measure which we need to pin down the asymptotic state.
Finally, we define the cluster formation time, , as the number of time steps needed to aggregate into the cluster at least of the total number of agents that the cluster will contain in the asymptotic state.
3 Analysis of the number of clusters
The first characteristic of interest is the number of (large and small) clusters of opinion in the asymptotic state. From the applied point of view, this characteristic is of key importance, because it describes whether the public opinion in the population will tend to a consensus (a single large cluster), polarization (two large clusters), or pluralism (more than two clusters). One can plausibly hypothesize that it is exactly this characteristic that determines whether the community will adopt a political system with two moderate parties that have convergent political platforms (as, for example, in Australia), two parties with relatively distinct platforms (as in the United States and the UK), or a multiple party system with resulting coalition governments (as in Italy and Netherlands).
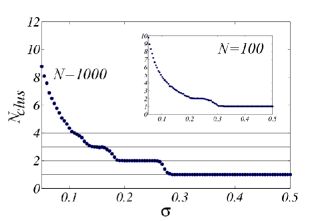
In the basic continuous–opinion dynamics model with a unique constant threshold [1, 2], the authors establish the so–called –rule for the average number of large clusters of opinion in the asymptotic state. This rule states that the threshold completely determines the average number of large clusters, which is equal to the integer part of . This is presented in Figure 2 for a population of agents; we also report a simulation with citizens (see inset of Figure 2), for comparison. Despite the good description of the asymptotic state given by that rule, there are nevertheless some discrepancies due to the finiteness of the population size.
We expect our model to behave differently. In particular, the average number of large clusters, denoted by , and the average number of small clusters, , should depend on both parameters and . The individual–level benefit–of–diversity parameter represents in the aggregate the centripetal force of the social system. On the contrary, the individual–level incremental communication cost parameter represents in the aggregate the relative strength (with respect to ) of the centrifugal force of the system. It is the combination of these two forces that eventually determine the dynamics and the asymptotics of the system.
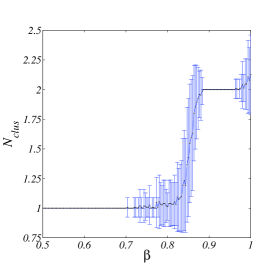
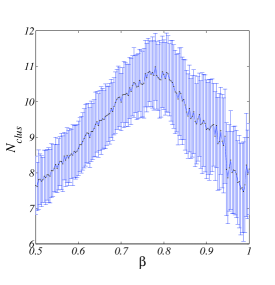
Figure 3 shows the evolution of the average number of large clusters for relatively high fixed values of (left panel) and low values of (right panel), while varies in . The reported simulations have been obtained with values (left panel) and (right panel), and they do not qualitatively change for moderate changes in (results not reported here). The whisker bars around the average represent the standard deviation in the number of clusters.
The data presented in Figure 3 allow us to obtain the following results.
Result 1. The relatively high values of (i.e., high benefits of diversity) induce a low number of large clusters ( or , and rarely above ) in the whole range of . The strong centripetal force leads either to consensus or to polarization, but never to pluralism. We thus obtain a somewhat paradoxical result that societies where citizens have a strong tendency to be open to the opinion of others never obtain pluralism of opinions in the long run. We provide an explanation to this paradox in the light of our model later in the paper.
Result 2. The transition from consensus (one large cluster) to polarization (two large clusters) is driven (at fixed ) by the increase in the relative strength of the centrifugal force (i.e., the incremental communication costs). In other words, societies where citizens perceive strong benefits of diversity tend to reach consensus if the incremental communication costs between citizens with diverse opinions are relatively low. However, the same societies become polarized if the incremental communication costs are relatively high.
Result 3. In the () parameter range that correspond to the transition from consensus to polarization, we observe a much higher standard deviation in the number of clusters. This implies that in such transition ranges, small random differences in dynamics of opinion formation at the early periods can lead to large differences in the asymptotic state. In other words, in such ranges the social system is non–ergodic. From the applied point of view this means that we can observe societies which are very similar in their social characteristics (same benefits of diversity and same communication costs) that nevertheless exhibit totally different long–run public opinion distributions (consensus in some societies, polarization in others).
Analyzing the relatively low values of (the right panel of Figure 3) we can state two further results.
Result 4. The average number of large clusters in this case is much higher than in the left panel of the same figure, varying between and for . This is a complementary result to the one described above (Result 1): the societies exhibit pluralism in public opinion only when the benefits of diversity are relatively low.
We are able to explain these paradoxes (Results 1 and 4) as follows: for the pluralism of opinion to be a stable feature of the society, the citizens should have relatively little incentives to change their opinions, i.e. they should be sufficiently conservative. Only this way an initially pluralist distribution of opinions can remain pluralist in the long run. Otherwise (that is, if the benefits of diversity are sufficiently high, as in the left panel of Figure 3), citizens will tend to adjust their opinions towards those of citizens whom they meet, and a sufficiently high number of random encounters guarantees that eventually the loci of pluralism disappear, giving way to clustering of all citizens around one or two opinions.
Note also that for low values of , the average number of large clusters is not monotonic in . In other words, increasing the relative strength of the centrifugal forces of the social system leads to an increase in the average number of large clusters only up to some point. Beyond this point, further increases in the centrifugal forces tend actually to decrease the average number of large clusters. This is an artificial outcome related to the definition of large and small clusters. As shown in the inset of the right panel of Figure 3 and as we will see in our discussion of small clusters below, beyond a sufficiently high number of large clusters, the distinction between large and small clusters becomes weak.
Result 5. The variation in the number of large clusters is much higher for lower values of . Moreover, for low values of , the number of large clusters varies a lot throughout the different values of , while for the high values of this variation occurs only in the transition ranges (see the left panel of Figure 3 and Result 3 above). Given Result 4, this means that the pluralism in public opinion is fundamentally non–ergodic. In other words, it is basically impossible to predict the exact number of large opinion clusters in pluralist societies, based on their observable characteristics (benefits of diversity and communication costs).
We next turn to the analysis of small clusters of opinion. While for a social system with high number of large clusters the distinction between large and small clusters becomes weak, for a system with consensus or polarization, the small clusters have a precise meaning: they represent small groups of citizens that do not get aggregated in the mainstream opinion group(s). From the applied point of view, small clusters can represent marginal minority–opinion groups (as, for example, the most radical left–wing or right–wing factions).
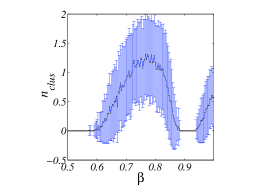
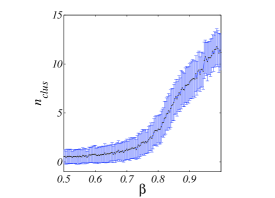
This analysis is summarized in Figure 4 where we present the evolution of the average number of small clusters (as a function of ) for different values of . The left panel shows the results obtained with , while the right panel – for .
Result 6. In case of high values of (left panel), small clusters of opinion are absent for most parameter ranges, and appear only in the parameter ranges corresponding to the transition from consensus to polarization. The puzzling feature is not the appearance of small clusters per se, but their disappearance beyond the transition range (see the left panel of Figure 4 for ). Moreover, small clusters of opinion are regularly present in simulations with low values of . This indicates that the appearance of small clusters of opinion is not mainly driven by the fundamental characteristics of the social system (i.e. the values of and ), but is inherently linked to the non–ergodicity of the system.
As discussed earlier, the distinction between large and small clusters becomes weaker as the number of large clusters grows. This can be seen in the right panel of Figure 4: the number of small clusters sharply increases when is close to , which is exactly the range corresponding to the decline in the number of large clusters in the right panel of Figure 3. Large and small clusters become very similar in size, differing by at most a few citizens on average, and their total number is monotonic in , as can be seen in the right panels of Figures 3 and 4.
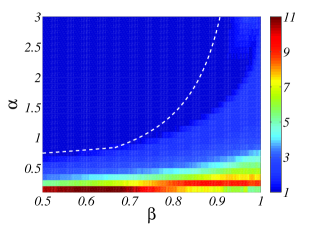
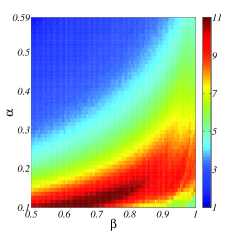
While Figures 3 and 4 already give a reasonably good sense of the main mechanisms driving the model, we can get a more complete understanding of the model by studying the number of (large) clusters in function of continuous change in both parameters ( and ). This analysis is presented in Figure 5 where we show the average number of large clusters as a function of both and , for the ranges and (left panel). The right panel presents the zoom in the range . These figures have been obtained by making a grid of a portion of the parameter plane ; then, for any point of the mesh the average number of large clusters is computed from simulations. The final results are plotted in a color scale; increases in the number of clusters corresponds to the move from dark blue color towards dark red.
These numerical results can be interpreted in reference to the benchmark unique constant threshold model [1] where the threshold value at which the transition from consensus to polarization occurs is about (for ). We thus need to find the loci of () such that all agents have initial thresholds above this value. The individual thresholds are updated at each interaction resulting in opinion change and thus they change over time, but we can ensure the existence of a single cluster if all are larger than
In our model the threshold function is a pair of incomplete parabolae with negative curvature and vanishing at and (see (3)). Hence, we must require that to ensure the threshold being positive in the entire range of opinions. On the other hand, by construction, the threshold should be lower than . Using its maximum at =, this implies . Finally, each threshold is larger than the smallest between the threshold of the most extreme citizens, , and the threshold of most moderates citizens, . Note that for we have , while for , .
Thus the required condition on the individual thresholds is obtained under
| (4) |
The loci of parameters that guarantee this condition are marked in the left panel of Figure 5 by the dashed light line. The data reported in this figure fully confirms the results discussed above. One additional result stands out.
Result 7. The comparison with the benchmark model (the dashed line) indicates that the introduction of heterogeneous dynamic thresholds changes the range where consensus is obtained. This can be seen in the left panel of Figure 5, by the presence of some dark blue area to the right of the dashed line. In this area, a fraction of citizens have initial thresholds that are below (in the benchmark model, it is the level at which consensus breaks down); nevertheless, in our model the consensus survives. However, the shape of this area is not uniform: in particular, for lower levels of , it basically disappears. This implies that for relatively low incremental communication costs, there is little qualitative difference between the benchmark model and our heterogeneous dynamic threshold model. The heterogeneity of thresholds starts to make a qualitative difference at the higher levels of incremental communication costs.
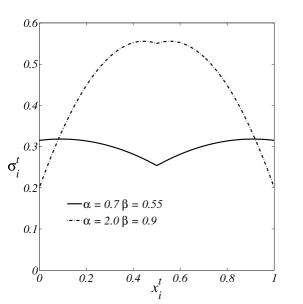
Where does this difference come from? This occurs because for low–/low– combinations slightly above the line, as we move across the spectrum of opinions, the threshold varies very little. Thus, crossing the line basically means that we pass from the situation where all citizens have the threshold above to the situation where almost all citizens have the threshold below , which basically guarantees that the consensus (a single cluster) is never obtained. Instead, for high–/high– combinations slightly above (to the left) the line, as we move across the spectrum of opinions, the threshold changes non–linearly (sharply around the extremes and slowly around the center). Thus, crossing the line means that we pass from the situation where all citizens have the threshold above to the situation where almost all citizens still have the threshold above and only very few extreme citizens have the threshold below , which implies almost surely that the consensus (a single cluster) still obtains (See Figure 6).
4 Cluster formation time
The second characteristic that we are interested in is the cluster formation time, . The practical importance of this measure is best explained through the following example. Consider a community that has to make a collective decision (via the majority rule) upon some unidimensional issue. Initially, citizens hold very diverse opinions about the issue; however, before the vote takes place, some (fixed) amount of time has to elapse, during which citizen discuss the issue among themselves. A community with long cluster formation time comes to the vote with a still highly dispersed distribution of opinions. Therefore, the outcome of the vote will leave most citizens dissatisfied with the decision. Instead, a community where cluster(s) form relatively quickly comes to the vote with much more concentrated opinion distribution (either with one or several clusters). Thus, the outcome of the vote will satisfy almost all (in case of one cluster), the majority (in case of two clusters), or a large minority (in case of more than two clusters) of citizens. In all cases, the latter community is overall happier with vote outcome, compared to the former community.
This example indicates the importance of understanding the factors that determine the cluster formation time. In the benchmark model with a unique constant threshold, for the single–cluster case, Carletti et al. [11] have found that the cluster formation time approximately obeys the following law:
| (5) |
which (roughly speaking) comes from the –law and the mean number of interactions needed to aggregate the opinions into a single cluster.
In our model with heterogeneous dynamic thresholds the cluster formation time is normally longer. Note that on this measure it is impossible to compare our model with the benchmark model as in our model there isn’t a single threshold, but a distribution of thresholds. However, we still can fix a certain combination () (such that a single cluster of opinion almost surely obtains) and compare the cluster formation time with the one of the benchmark model using the threshold of extremists, , that of most moderate agents, , or the average initial threshold. In all cases, we obtain a longer cluster formation time for our model. By measuring the cluster formation time in numerical simulations, and then inspecting the shape of , we get the following result.
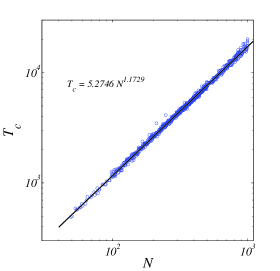
Result 8. The cluster formation time approximately follows a power law in the community size:
| (6) |
where the constants and depend on the parameters and . Some values of these constants are reported in Table 1 for different parameters . These numerical values have been obtained performing a linear regression on the data in the log–log variables, presented in Figure 7 in the single cluster case (parameters and ), where we show the dependence of on the total number of agents in a log–log plot.
Clearly, given that in each period there is only one encounter, larger communities take more time to aggregate into the single cluster. Moreover, by the shape of the power law, the incremental increase in the cluster formation time is stronger for larger communities. However, the incremental effect of the community size on the speed of aggregation crucially depends on the parameters and . This can be seen in Table 1: varying and leads to changes in the coefficients and . This can be summarized in to the following result.
Result 9. Both an increase in for a given and a decrease in for a given lead to reinforce the incremental effect of the community size on the speed of aggregation. In other words, lower thresholds act much stronger as barriers to convergence for larger communities than for smaller ones. The inverse is also true: a small increase in thresholds (for instance, because of lower incremental communication costs between citizens) induces a huge fall in the cluster formation time for a community with 1000 citizens, while the same increase induces a much smaller fall in the cluster formation time for a community with 200 citizens.
In the case of communities where several clusters of opinion form, the cluster formation time depends on the number of clusters but also on their relative weights. For a given number of agents in the cluster, the formation time is longer if more clusters are present. This is because of the existence of a transient phase where citizens adjust their opinions quite often at the early stage (See the right panel of Figure 1). The problem of cluster formation time where more than one cluster are present has a deep impact on the dynamics of the social system. To the best of our knowledge, even in the benchmark model no theory is available regarding cluster formation time for the multi–cluster asymptotic states. Here we establish some preliminary results in this direction.
To do so, we run simulations for communities with size that varies from to individuals by steps of . We fix parameter values to ensure the existence of two clusters on average in the asymptotic state; results used to compute Table 2 and the relation (8) have been obtained using and . From the sample created in this manner, we eliminate the cases with more than two clusters (since in some cases small clusters are formed). For all the remaining cases, we analyze how the formation time of one cluster depends on its size and the formation time of the other cluster. Given the duality, and treating each of the two clusters in a single simulation independently, we can use the results of each simulation twice. This gives us the sample of 818 observations. We thus look at the following measures: the first cluster formation time (), its size (), and the formation time of its “rival”cluster ().
Next, we run a linear regression (in logs) using the following statistical specification:
| (7) |
where is the error term, for which we assume the standard linear regression assumptions to hold. Table 2 presents the regression results.
We observe that our statistical model fits the simulation data well (it explains more than of variation in the data). All the three regression coefficients (, , and ) are positive and highly statistically significant. This allows us to describe the data with the following fitted model:
| (8) |
This analysis allows us to formulate a final result.
Result 10. The cluster formation time of different clusters (in the two-cluster case) is positively correlated. In other words, independently of the community size, a faster formation of one cluster of opinion induces an increase in the formation time of the second cluster. Intuitively, the quick formation of one cluster has two opposed effects on the dynamics of the other cluster: on one hand, a quick separation of clusters acts in the same way as the reduction in community size (basically as if we were having two smaller communities with one cluster each). From the above discussion we know that smaller communities converge faster. However, on the other hand, the two clusters are still linked through random encounters, and thus the part of encounters that happens across clusters is effectively “wasted”for cluster formation. This effect works in the opposite direction. The regression results show that the first effect dominates. However, given that the size of the coefficient is relatively small, we can hypothesize that the second effect is also quite important.
Naturally, these results crucially depend on parameters and . We believe that these results are intriguing but a more complete analysis is needed, in particular to test the robustness of our estimates to changes in the fundamental parameters and the variation in regression coefficients within the two–cluster area of Figure 5. We leave this analysis for future work.
5 Conclusions
In this paper we have shown that introducing heterogeneous dynamic thresholds into the model of continuous opinion dynamics and grounding those thresholds in the simple and intuitive characteristics of individual cost–benefit analysis substantially deepens our understanding of public opinion dynamics and generates several new results. We understand better why some societies converge towards consensus, others become polarized, while some end up having pluralist public opinion. We link these outcomes, on one hand, to the benefits of diversity and on the other, to the communication costs between citizens. We also discover new insights regarding the time needed for clusters of opinions to form, in particular for polarized societies case.
More generally, this paper shows that a more detailed specification of the elements of agents’ behavior at the individual level opens many interesting avenues also at the aggregate level. We hope that our analysis and results will motivate the public opinion researchers to follow this route.
References
- [1] Deffuant, G.; Neau, D.; Amblard, F.; Weisbuch, G. Mixing beliefs among interacting agents. Advances in Complex Systems 2000, 3, 87-98.
- [2] Weisbuch, G.; Deffuant, G.; Amblard, F.; Nadal, J.P. Meet, discuss, and segregate! Complexity 2002, 7, 55-63.
- [3] Page, B.; Shapiro, R. Effects of public opinion on policy. American Political Science Review 1983, 77, 175-190.
- [4] Blinder, A.; Krueger, A. What does the public know about economic policy, and how does it know it? Brookings Papers on Economic Activity 2004, 1, 327-387.
- [5] Nordhaus, W. Discussion of Blinder, A.; Krueger, A. What does the public know about economic policy, and how does it know it? Brookings Papers on Economic Activity 2004, 1, 388-397.
- [6] Follmer, H. Random economies with many interacting agents. Journal of Mathematical Economics 1974, 1, 51-62.
- [7] Orlean, A. Bayesian interactions and collective dynamics of opinion: Herd behavior and mimetic contagion. Journal of Economic Behavior and Organization 1995, 28, 257-274.
- [8] Ianni, A.; Corradi, V. The dynamics of public opinion under majority rules. Review of Economic Design 2002, 7, 257-277.
- [9] Neau, D. Révision des croyances dans un système d’agents en interaction, rapport d’option de l’école polythechique, available at http://www.lps.ens.fr/~weisbuch/rapneau.ps. 2000.
- [10] Alesina, A.; La Ferrara, E. Who trusts others? Journal of Public Economics 2002, 85, 207-34.
- [11] Carletti, T.; Fanelli, D.; Grolli, S.; Guarino, A. How to make an efficient propaganda. Europhysics Letters 2006, 74, 222-228.
| A | B | |
|---|---|---|
| 1.2086 | 3.5351 | |
| 1.1995 | 3.836 | |
| 1.1729 | 5.2746 | |
| 1.1369 | 7.6978 |
| Variable | Coefficient | (Std. Err.) |
|---|---|---|
| Log of cluster 1 size | 1.597 | 0.066 |
| Log of cluster 2 formation time | 0.100 | 0.066 |
| Intercept | 0.978 | 0.194 |
Dependent variable : log of cluster formation time
,