The Price of Anarchy in Transportation Networks: Efficiency and Optimality Control
Abstract
Uncoordinated individuals in human society pursuing their personally optimal strategies do not always achieve the social optimum, the most beneficial state to the society as a whole. Instead, strategies form Nash equilibria which are often socially suboptimal. Society, therefore, has to pay a price of anarchy for the lack of coordination among its members. Here we assess this price of anarchy by analyzing the travel times in road networks of several major cities. Our simulation shows that uncoordinated drivers possibly waste a considerable amount of their travel time. Counterintuitively, simply blocking certain streets can partially improve the traffic conditions. We analyze various complex networks and discuss the possibility of similar paradoxes in physics.
pacs:
89.75.Hc, 87.23.Ge, 89.75.Fb, 89.65.-s, 89.65.Gh, 02.50.LeMany real-world transportation systems in human societies are characterized by networked structures and complex agents interacting on these networks Kossinets2006 . Understanding the agents’ behaviors has important consequences for the optimal design and control of, for example, the Internet, peer-to-peer, or vehicle networks Buchanan . In fact, optimality has long been a key principle in science. In particular, many branches of physics are governed by principles of least action or minimum energy in the same way that maximizing utility functions is crucial in economics. For example, the flow of currents in a resistor network can be derived by minimizing the energy dissipation. One might expect that traffic flows in transportation networks follow a similar optimization principle. It is indeed reasonable to assume that humans opt for the strategies that maximize their personal utility. However, this does not mean that flows in transportation networks minimize the cost for all users as is sometimes assumed Gastner2006 . On the contrary, we will demonstrate that the flows can in reality still be far from optimal even if all individuals search for the quickest paths and if complete information about the network and other users’ behaviors is available. Thus, traffic networks can be inherently inefficient – a fact rarely investigated in previous work on traffic flows Qiu .
In this paper, we investigate decentralized transportation networks where each directed link from node to is associated with a delay , the time needed to travel along the link. In most real networks, delays depend noticeably on the flow Levinson1998 , i.e., the number of downloads, vehicles, etc. per unit time. For example, a single vehicle easily moves at the permitted speed limit on an empty road, yet slows down if too many vehicles share the same road. Thus, the choices of some users can cause delays for others and possibly conflict with everyone’s goal to reduce the overall delay in the network. As a game-theoretic consequence, the best options for individual users form a Nash equilibrium, not necessarily a social optimum.
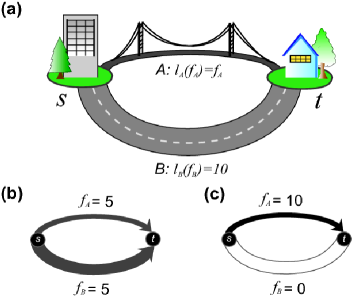
Consider, for instance, the simple network depicted in Fig. 1(a) Roughgarden . Suppose that there is a constant flow of travellers between the nodes and which are connected by two different types of links: a short but narrow bridge where the effective speed becomes slower as more cars travel on it, and a long but broad multi-lane freeway where congestion effects are negligible. Suppose the delay on link is proportional to the flow, , while the delay on is flow-independent, , where is the flow on link . The total time spent by all users is given by the “cost function” where the flow on is equal to . It is easily verified that attains its minimum for if the total flow satisfies . If , for example, each link should be taken by exactly half of the users, resulting in (Fig. 1b).
In this social optimum, every user on link could reduce his delay from 10 to 6 by switching paths, which poses a social dilemma: as individuals, users would like to reduce their own delays, but this reduction comes at an additional cost to the entire group. In our example, as long as , there will be an incentive for the users experiencing longer delays to shift to another link. If all users decide to put their own interests first, the flow will be in a Nash equilibrium where no single user can make any individual gain by changing his own strategy unilaterally. All users take the link , as shown in Fig. 1(c), at the total cost of . Experimental tests indicate that human subjects approach the problem of finding paths in a network from this latter self-interested perspective, rather than from the former altruistic point of view Rapoport2005 . This behavior, known as Wardrop’s principle, is observed even if, as in our example, not a single user experiences a shorter travel time in this Nash equilibrium than in the social optimum. Furthermore, if all functions are strictly increasing (as in most realistic cases) and the flows are continuous, one can prove that there is always exactly one Nash equilibrium Roughgarden .
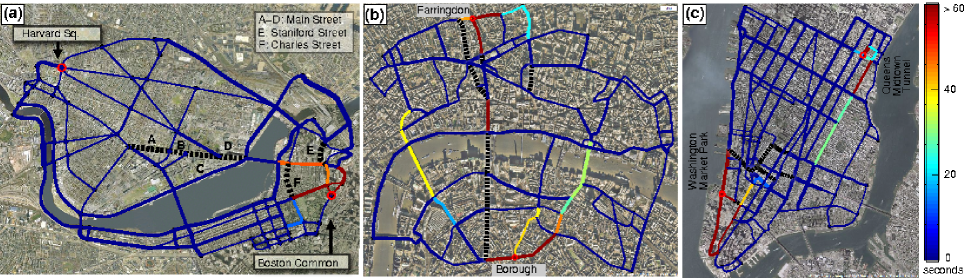
Although differences between Nash equilibria and social optima occur frequently in social science, only few papers have studied the difference between optimal and actual system performance in real transportation networks Qiu . To shed light on this issue, we have analyzed Boston’s road network shown in Fig. 2(a). The 246 directed links in our network are segments of principal roads, and their intersections form 88 nodes. Delays are assumed to follow the Bureau of Public Roads (BPR) function widely used in civil engineering, . Here is the distance of the link between and , the speed limit (35 mph on all links, for simplicity), the flow, and the capacity of the road segment. The parameters and have been fitted to empirical data Singh as and , i.e., the delays increase very steeply for large traffic volumes. Capacity is defined as the traffic volume at “level of service E” which is approximately 2000 vehicles per hour multiplied by the number of lanes Roess . We used Google Maps to identify the principal roads, measure the distances , and count the number of lanes for each direction.
Next we have calculated the flows for various total traffic volumes from Harvard Square to Boston Common. The socially optimal flows are determined by minimizing the cost to society per unit time . This optimization problem, satisfying flow conservation at each intersection, can be solved with standard convex minimum cost flow algorithms Ahuja1993 . For the Nash equilibrium, we can use the fact that the equilibrium flows minimize the objective function Roughgarden . The price of anarchy (PoA) is defined as the ratio of the total cost of the Nash equilibrium to the total cost of the social optimum Papadimitriou indicating the inefficiency of decentralization; for example in Fig. 1, , or in general
| (1) |
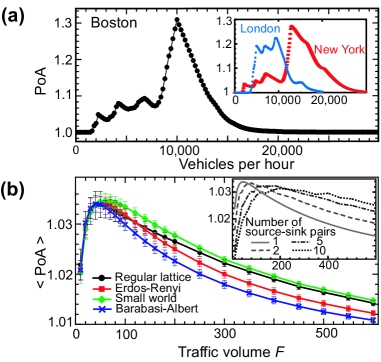
4/3 is in fact the upper bound for the PoA in networks with affine delays, i.e., Roughgarden ; Friedman04 . For larger , the theoretical maximum is higher, but here we are more interested in typical than in worst-case network topologies. For , Fig. 3(a) shows the PoA versus the total traffic volume for Boston’s roads. Except for very small , the Nash equilibrium cost is higher than the social optimum so that . The worst ratio occurs for a traffic volume of vehicles per hour – a quite realistic flow, see DATA – where , i.e., individuals waste 30% of their travel time for not being coordinated.
To what extent are properties of the PoA observed in Boston’s road network characteristic of networks with flow-dependent costs? Among road networks, the results appear to be typical as suggested by an analysis of the road networks of London and New York in Fig. 2. London’s network consists of 82 intersections and 217 links marked as principal roads by Google Maps. We find that the PoA can increase up to 24% for trips between the Borough and the Farringdon underground stations (Fig. 3(a) inset). Similar results also hold for New York, consisting of 125 intersections and 319 streets. The inset of Fig. 3(a) shows that the PoA can be as high as 28% when 12,000 vehicles per hour travel from Washington Market Park to Queens Midtown Tunnel. The results remain qualitatively similar for different sets of sources and destinations suggesting that a high PoA can generally become a serious problem.
To gain further theoretical insight, we also constructed four ensembles of bidirectional model networks with distinct underlying structures ModelNetwork : a simple one-dimensional lattice with connections up to the third-nearest neighbors and periodic boundary conditions, Erdős-Rényi random graphs with links between randomly drawn pairs of nodes, small-world networks with a rewiring probability 0.1, and Barabási-Albert networks with broad degree distributions. All the networks contain 100 nodes and have an average degree of 6. Every link between nodes and has a delay of the form , where is a random integer equal to 1, 2, or 3, and between 1 and 100. This affine cost function captures essential properties of links in important physical networks. In electric circuits, for example, the flow is an electric current and the delay can be interpreted as the voltage difference between and . An affine current-voltage characteristic occurs in circuits with a combination of Ohmic resistors (resistances ) and Zener diodes (breakdown voltages ). Further examples with affine cost functions include mechanical, hydraulic, and thermal networks Penchina .
For each model network, we go through every pair of nodes to calculate the PoA for various total flows . Then the results are averaged over 50 networks to find the mean PoA() for each ensemble as plotted in Fig. 3(b). After averaging over many pairs, there are no longer multiple local maxima as in Fig. 3(a). Instead, we find unimodal functions for all ensembles with a steep increase for small and a long tail for large flows. The qualitative behavior can be understood as follows. The social optimum minimizes whereas the flow in the Nash equilibrium minimizes . In the limit , both objective functions become identical and, therefore, PoA . For , the quadratic terms in the sums dominate, hence , i.e., both objective functions are minimized by the same asymptotic flow pattern and PoA again approaches 1. The maximum PoA occurs roughly where the quadratic and linear terms in the objective functions are comparable, i.e., for paths with positive flow. Ignoring correlations between and , we have . Since where is a factor bigger than but of the order of 1, we estimate the maximum PoA to be at . In our example, and , so we predict to be bigger than but of the order of 25. Numerically, we find the maxima for our four ensembles to be between 30 and 60 in good agreement with our estimate. Barabási-Albert networks tend to have the lowest PoA and small-world networks the highest, but the statistical dependence between PoA and is strikingly similar among all ensembles.
Knowing the PoA is important, but it is even more valuable to discover a proper method to reduce it. In a road network, one could charge drivers toll fees to stimulate a more cooperative behavior, but that strategy has problems of its own. For example, one could charge a fee for using each link equal to the “marginal cost” so that the new Nash flow becomes equal to the social optimum. Unfortunately, if collected taxes are not returned to the users, such marginal cost taxes do not improve the cost of the Nash equilibrium in the case of BPR delays Cole . However, as we have learned from Fig. 3(b), we can change the PoA by modifying the underlying network structure. For instance, closing roads to car traffic is relatively easy to implement and is, moreover, equally effective for everybody. One might expect that closing roads only leads to increased congestion. However, contrary to common intuition, Braess’s paradox suggests that road closures can sometimes reduce travel delays Braess .
We investigated whether this apparent contradiction occurs in the road networks of Fig. 2. In the case of Boston’s roads, we set =10,000 between Harvard Square and Boston Common which is the flow where the PoA reaches its maximum, i.e., where reducing the travel time is most desirable. We then compare the costs of the Nash flow on the original network with those on networks where one of the 246 streets is closed to traffic. In most cases, the cost increases when one street is blocked, as intuitively expected. Nonetheless, there are six connections which, if one is removed, decrease the delay in the Nash equilibrium, shown as dotted lines in Fig. 2. If all drivers ideally cooperated to reach the social optimum, these roads could be helpful; otherwise it is better to close these streets. Similar results are also found in the other two networks: there are seven links causing Braess’s paradox in London (=10,000) and twelve in New York (=18,000), see Fig. 2(b) and (c). Of course, the identified roads may not always be bad because a different set of start and end nodes can change the number and location of links triggering Braess’s paradox. However, their existence under the investigated conditions suggests that Braess’s paradox is more than an academic curiosity Braess ; Steinberg or an anecdote with only sketchy empirical evidence knodel . Nevertheless, more work is needed to generalize the presented results, for example for multiple sources and destinations. As a first step, we have calculated the PoA for such multi-commodity flows (Fig. 3(b) inset).
Braess’s paradox exists because the social optimum and the Nash equilibrium react in different ways to changes in the network. After a link is closed, the socially optimal travel time must be at least as long as before. However, there is no a priori reason why severing a link could not improve the Nash travel time. By the same argument, adding new links can potentially create more delay in the Nash equilibrium. Hence, a target for future policies in transportation networks is to prevent unintended delays caused by, ironically, well-intentioned new constructions that form a disadvantageous Nash flow. Because convex costs such as the BPR function are common in economics, Braess’s paradox is presumably also frequent outside vehicle transportation networks. In fact, we do not need game theory to find this paradox. It also occurs in physical networks where equilibrium principles can drive the network away from optimality. For example, currents in electric circuits do not always minimize the dissipated energy, but instead satisfy Kirchhoff’s laws. As a consequence, removing wires can sometimes counter-intuitively increase the conductance Penchina . Although electrons in a circuit, unlike drivers in a road network, do not act selfishly, the equilibrium conditions (Kirchhoff’s laws and Wardrop’s principle) are in fact closely related. Further studies of the price of anarchy and Braess’s paradox might therefore lead to significantly improved flows in a number of important applications.
Acknowledgements.
We thank Eric Smith, Yueyue Fan, D.-H. Kim, and H.-K. Lee for helpful discussion. H. Y. acknowledges the motivation from the study group at the NECSI summer school. This work was supported by KOSEF through the grant No. R17-2007-073-01001-0 and is dedicated to the memory of Charles VanBoven.References
- (1) G. Kossinets and D. J. Watts, Science 311, 88 (2006).
- (2) M. Buchanan, Nature 447, 39 (2007).
- (3) M. T. Gastner and M. E. J. Newman, Phys. Rev. E 74, 016117 (2006).
- (4) L. Qiu et al., Proc. of ACM SIGCOMM, 151 (2003); O. Jahn et. al., Oper. Res. 53, 600-616 (2005)
- (5) D. M. Levinson et. al., Transport Reviews 18, 215 (1998).
- (6) T. Roughgarden, Selfish Routing and the Price of Anarchy (MIT Press, Cambridge, 2005).
- (7) R. Selten et al., Games and Econ. Behav. 58, 394 (2007); A. Rapoport et al., Games and Econ. Behav., in press.
- (8) R. Singh, 7th TRB Conference on the Application of Transportation Planning Methods, 340 (1999).
- (9) R. F. Roess and W. R. McShane, ITE Journal 57, 27 (1987).
- (10) R. K. Ahuja et. al., Network Flows: Theory, Algorithms and Applications (Prentice-Hall, Englewood Cliffs)
- (11) C. Papadimitriou, 33rd Annual ACM Symposium on Theory of Computing 749 (2001).
- (12) E. J. Friedman, 43rd IEEE Conference on Decision and Control, 4667 (2004); J. R. Correa et. al., Games and Econ. Behav., Forthcoming (2008).
- (13) Data from Massachusetts Highway Department, URL: http://www.mhd.state.ma.us/
- (14) P. Erdős, A. Rényi, Publ. Math. Debrecen 6, 290 (1959); D. J. Watts, S. H. Strogatz, Nature 393, 440 (1998); A.-L. Barabási, R. Albert, Science 286, 509 (1999).
- (15) J. E. Cohen, P. Horowitz, Nature 352, 699 (1991); C. M. Penchina, L. J. Penchina, Am. J. Phys. 71, 479 (2003).
- (16) R. Cole et. al., J. Comp. Sys. Sc. 72, 444 (2006); P. Maille, N. E. Stier-Moses, Columbia Working Paper DRO-2007-04 (2007)
- (17) D. Braess, Unternehmensforschung 12, 258 (1968).
- (18) R. Steinberg, W. I. Zangwill, Transportation Science 17, 301 (1983); G. Valiant, T. Roughgarden, 7th ACM conference on Electronic commerce, 296 (2006).
- (19) W. Knödel, Graphentheoretische Methoden und ihre Anwendungen (Springer, Heidelberg) 1969; C. Fisk and S. Pallottino, Transportation Research A 15, 245 (1981); G. Kolata, What if they closed 42nd street and nobody noticed? New York Times, 38 (December 25, 1990).