SHARC-II 350m Observations of Thermal Emission from Warm Dust in z5 Quasars
Abstract
We present observations of four SDSS quasars at 350m with the SHARC-II bolometer camera on the Caltech Submillimeter Observatory. These are among the deepest observations that have been made by SHARC-II at 350m, and three quasars are detected at significance, greatly increasing the sample of 350m (corresponds to rest frame wavelengths of at ), detected high-redshift quasars. The derived rest frame far-infrared (FIR) emission in the three detected sources is about five to ten times stronger than that expected from the average SED of the local quasars given the same luminosity. Combining the previous submillimeter and millimeter observations at longer wavelengths, the temperatures of the FIR-emitting warm dust from the three quasar detections are estimated to be in the range of to . Additionally, the FIR-to-radio SEDs of the three 350m detections are consistent with the emission from typical star forming galaxies. The FIR luminosities are and the dust masses are . These results confirm that huge amounts of warm dust can exist in the host galaxies of optically bright quasars as early as z6. The universe is so young at these epochs () that a rapid dust formation mechanism is required. We estimate the size of the FIR dust emission region to be about a few kpc, and further provide a comparison of the SEDs among different kinds of dust emitting sources to investigate the dominant dust heating mechanism.
1 Introduction
Quasars in the distant universe may be studied as important probes of supermassive black hole (SMBH) and host galaxy formation at early epochs. Universal relationships between the supermassive black holes (SMBHs) and their stellar bulges were found in both active and normal galaxies locally, indicating that the early evolution of the SMBH-bulge systems is tightly correlated (eg. Marconi & Hunt 2002; Tremaine et al. 2002). How these relationships behaved at an early galaxy evolution stage is a critical question for the studies of the high-z universe. In particular, if the SMBH forms prior to the stellar bulge, we may expect to see massive star formation co-eval with rapid black hole accretion in the quasar systems at the highest redshifts.
Observations at submillimeter and millimeter [(sub)mm] wavelengths were preformed to study the thermal emission from warm dust in the quasar host galaxies at high redshifts. These studies yield important information on the mass and temperature of the FIR-emitting dust, and thus provide key constraints on the related galaxy evolution activities. Samples of optically bright quasars from z2 to 6 have been observed at (sub)mm wavelengths (Omont et al. 1996; Omont et al. 2001; 2003, Carilli et al. 2001; Beelen et al. 2003; Bertoldi et al. 2003a; Priddey et al. 2003a, Robson et al. 2004; Wang et al. 2007), using the Max-Planck Millimeter Bolometer (MAMBO) on the IRAM-30m Telescope and the Submillimeter Common-User Bolometer Array (SCUBA) on the James Clerk Maxwell Telescope. The detection rate is about 30% at mJy sensitivity for all these samples, indicating the existence of a population of FIR luminous objects within the high-z optically selected quasar sample.
Important results were obtained from deep 350m observations of these strong (sub)mm quasars (Benford et al. 1999; Beelen et al. 2006) made by the SHARC-II bolometer camera (Dowell et al. 2003) on the Caltech Submillimeter Observatory (CSO). The 350m observations confirm the existence, and constrain the properties of the warm dust with a typical temperature of in the host galaxies of these quasars (Benford et al. 1999; Beelen et al. 2006). Fits of the FIR (SEDs) imply FIR luminosities of about and FIR-to-radio luminosity ratios following the trend defined by star forming galaxies (Beelen et al. 2006). These properties are all comparable to the FIR emission found in the submillimeter detected galaxies (SMGs) at z1 to 3, i.e. thermal emission from 10 K to 70 K warm dust heated by star formation at a rate of a few (eg. Chapman et al. 2005; Kovcs et al. 2006b). The SHARC-II detected quasars also tend to have highly excited molecular CO emission from the host galaxies (i.e. peak at or higher, Carilli et al. 2002, 2007; Solomon & Vanden Bout 2005), exhibiting FIR-to-CO emission ratios similar to that of the star forming galaxies at low and high redshifts (Solomon & Vanden Bout 2005; Riechers et al. 2006; Carilli et al. 2007).
One instrumental finding among these observations is the SHARC-II detection of SDSS J114816.64+525150.3 at z=6.42 (hereafter J1148+5251, Beelen et al. 2006). This is the first 350m dust continuum detection beyond . The of warm dust discovered in this source implies a similar evolution stage as was found in other (sub)mm detected quasars at lower redshifts, but exist at an epoch when the age of the universe is only 870 Myr. Probing the warm dust emission at such an epoch is critical as it constrains the time scale of dust formation in addition to the questions of dust heating and black hole-bulge evolution. The detection of J1148+5251 indicates a rapid dust formation in these earliest galaxies (forming of dust within 1 Gyr), which requires confirmation with more examples at similar redshifts.
In this paper, we report our new 350m SHARC-II observations of four z5 SDSS quasars. These quasars are among the strongest MAMBO detections at z5 (Carilli et al. 2001; Petric et al. 2003; Priddey et al. 2003b; Bertoldi et al. 2003a; Wang et al. 2007). The observations presented in this work are among the most sensitive ones that have been made by SHARC-II at 350m, and are of critical importance as they deliver a data point on the short wavelength side or near the peak of the redshifted FIR emission spectrum. Combining with measurements on the long wavelength side allows determination of the dust temperature and, thus, the mass and the FIR luminosity. We describe the SHARC-II observations in Section 2, list the results in Section 3, and present discussions in Section 4. We adopt a -model cosmology with , and (Spergel et al. 2007), throughout this paper.
2 Observations
The observations were carried out with SHARC-II on the 10.4 m telescope of the CSO during 2007 January 13-18 UT. The SHARC-II camera is a pixel array with a beam size (FWHM) of at 350m. The field of view is . We observed the four target sources when the opacity at 225GHz () was 0.06, i.e. during the best weather conditions on Mauna Kea. The CSO Dish Surface Optimization System (DSOS, Leong 2005) was used to correct the surface imperfections and gravitational deformations. Scans were performed using a Lissajous pattern with amplitudes of and in azimuth and elevation respectively, resulting in a uniform coverage of . We performed hourly pointing, focus, and flux calibration with strong sources. We used Uranus as a primary calibrator, and a number of sources, IRC10216, CRL618, CIT6, OH231.8+4.2, GL490, and Arp220 were used as secondary calibrators. The uncertainties of the final calibration were expected to be within 20%, based on repeated observations of the calibrators and the flux uncertainties of the secondary calibrators. The pointing uncertainties, estimated from repeated pointing on calibrators, is about .
During standard observing, the position of the secondary mirror is updated frequently to compensate for sag as the telescope elevation changes. Unfortunately, a telescope configuration problem on the last three nights resulted in only infrequent updates. The effects of this problem are a drift in the focus and a small drift in pointing. We carefully studied the effects of the mirror position errors on the data using the position encoders and images of the calibrators. About half of the data was dropped due to bad focus. For the remaining data, we made small () adjustments to the pointing with an uncertainty of .
We completed data reduction using the SHARC-II data reduction package CRUSH version 1.52 (Kovcs 2006a). The total integration time for each source is about 6 to 8 hours after excluding the bad scans, and the rms noise level for the final maps is about to . The final maps were smoothed to a FWHM of , for optimal signal-to-noise in the case of point-source detection, and the peak surface brightness is adopted as the total flux density of the source.
3 Results
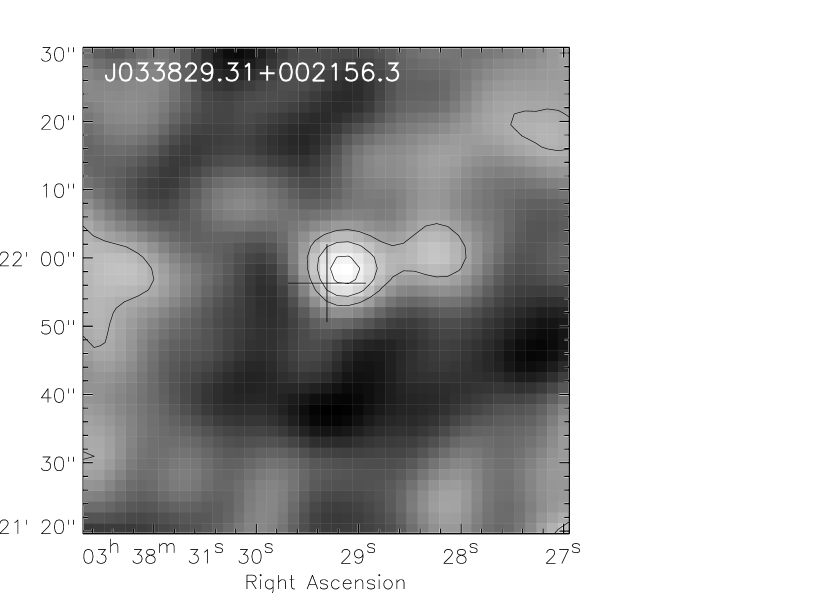
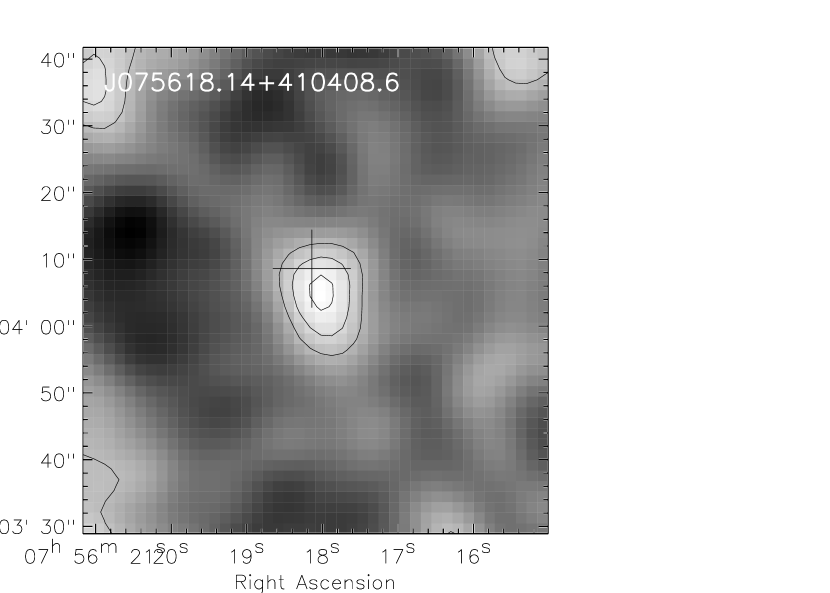
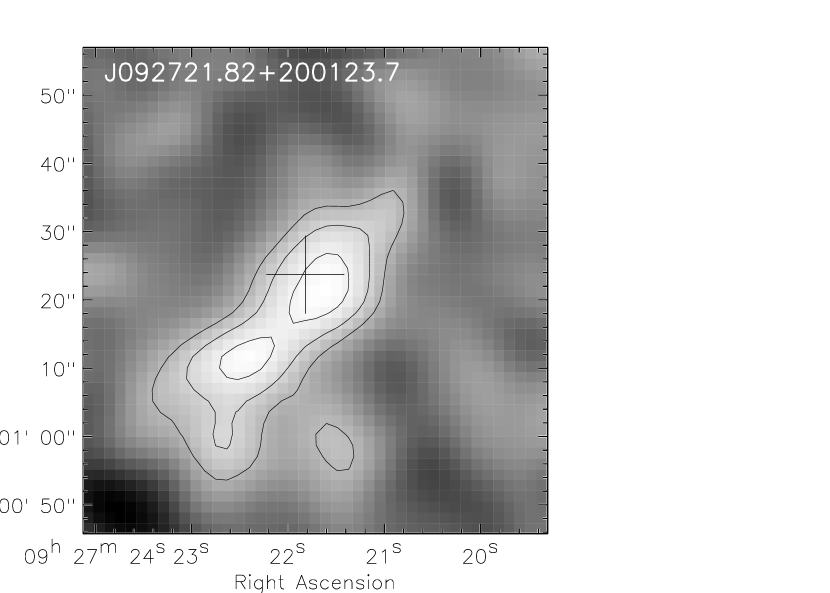
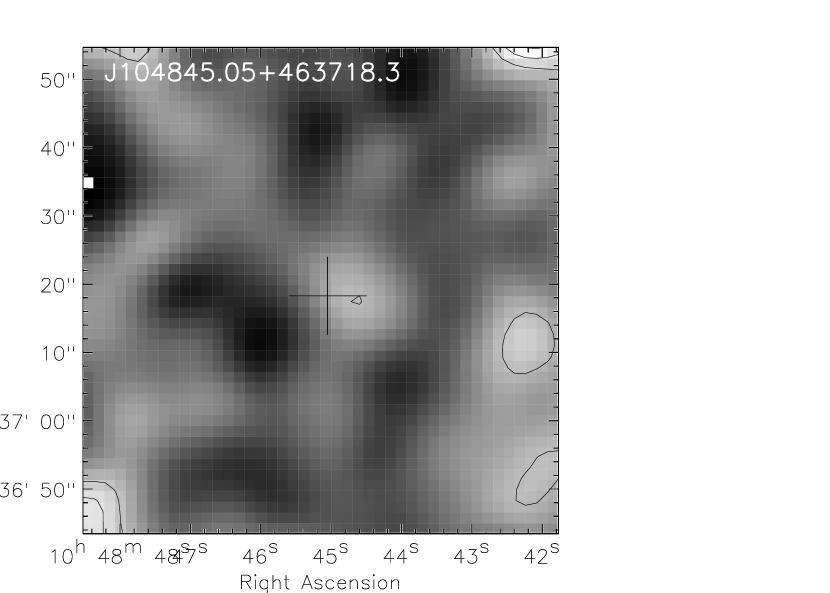
Three out of the four z5 quasars observed are detected at the level with SHARC-II. We list basic information and previous (sub)mm and radio continuum results of the four targets in Table 1, and the results of the SHARC-II observations are presented in the first four columns of Table 2, including the source name, 350m peak surface brightness, peak offset from the optical quasar, and the integration time. The final SHARC-II maps of all the four targets are presented in Figure 1. The position uncertainty on the map is for detections (considering the smoothed beam size of ). Thus the 350m peak positions of the three detections are consistent with the optical quasars given this position uncertainty (See Column 3 in Table 2). The details for the individual sources are presented in the following.
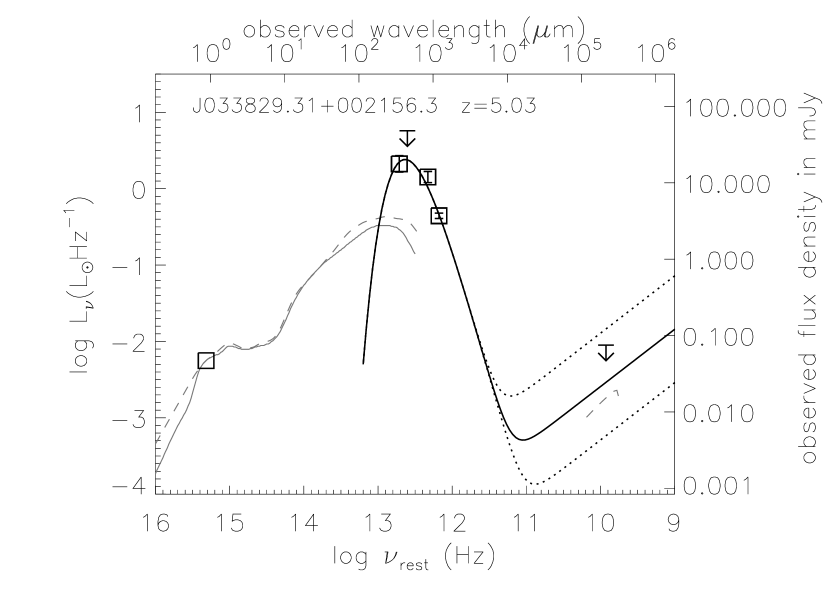
J033829.31+002156.3 (hereafter J0338+0021) is a z=5.03 quasar discovered by Fan et al. (1999). It is one of the strongest MAMBO detections among a sample of z SDSS quasars from Carilli et al. (2001) with . The dust continuum is also detected by SCUBA at 850m (Priddey et al. 2003b). Moreover, Maiolino et al. (2007) detected CO(5-4) line emission in this source, with a molecular gas mass of .
This source is detected by our SHARC-II observation at the level, with a peak surface brightness of away from the optical position.
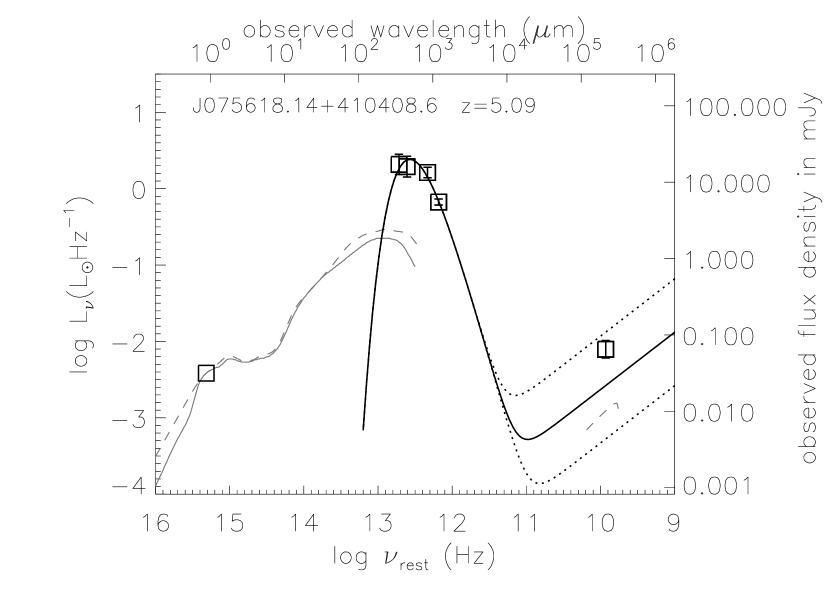
J075618.14+410408.6 (hereafter J0756+4104) was discovered by Anderson et al. (2001) with a redshift of z=5.09. It is a strong MAMBO source with (Petric et al. 2003), and also is detected at 450m and 850m by SCUBA (Priddey et al. 2003b; Priddey et al. 2007) and at 1.4GHz by the VLA (Petric et al. 2003).
We detect a peak () on the SHARC-II map, away from the position of the optical quasar.
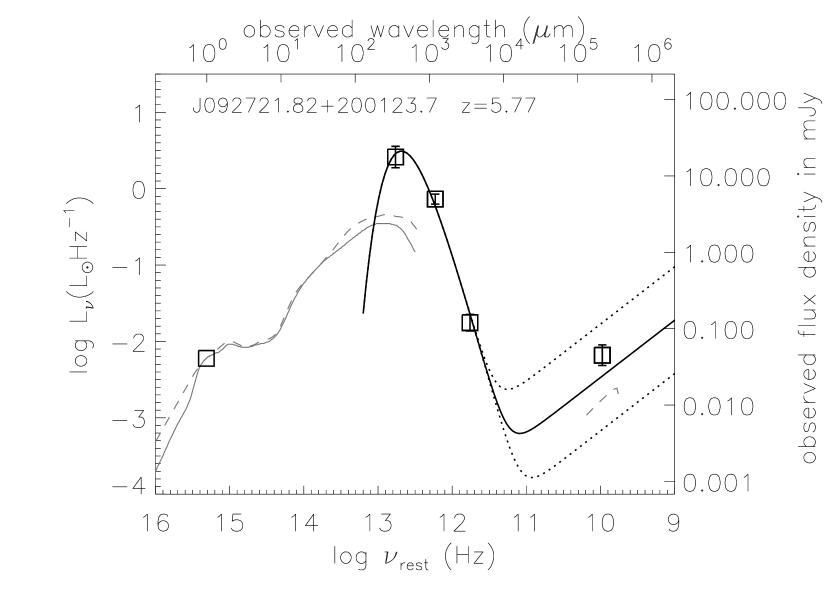
J092721.82+200123.7 (hereafter J0927+2001) is a SDSS quasar at z=5.77 (Fan et al. 2006b; Carilli et al. 2007). This source has a MAMBO flux density of , making it one of the most luminous quasars at z6 at FIR wavelengths (Wang et al. 2007). The VLA radio continuum observation of this source yields a detection of at 1.4GHz. CO(5-4) and CO(6-5) line emission has also been detected in this source very recently (Carilli et al. 2007). The CO luminosity indicates molecular gas with a mass of in the host galaxy. The CO observations are accompanied with a continuum measurement at of .
With SHARC-II we measure a brightness for this source of with a position offset of from the optical quasar. A second peak is seen in the map of this source with , to the southeast of the optical quasar position. The separation between the two peaks is about . However, there is no hint of extension towards the secondary peak direction in the CO emission maps of J0927+2001 at of Carilli et al. (2007). Further high resolution mapping at (sub)mm wavelengths is required to understand the nature of this secondary peak. The analysis below only considers the first peak close to the optical quasar position.
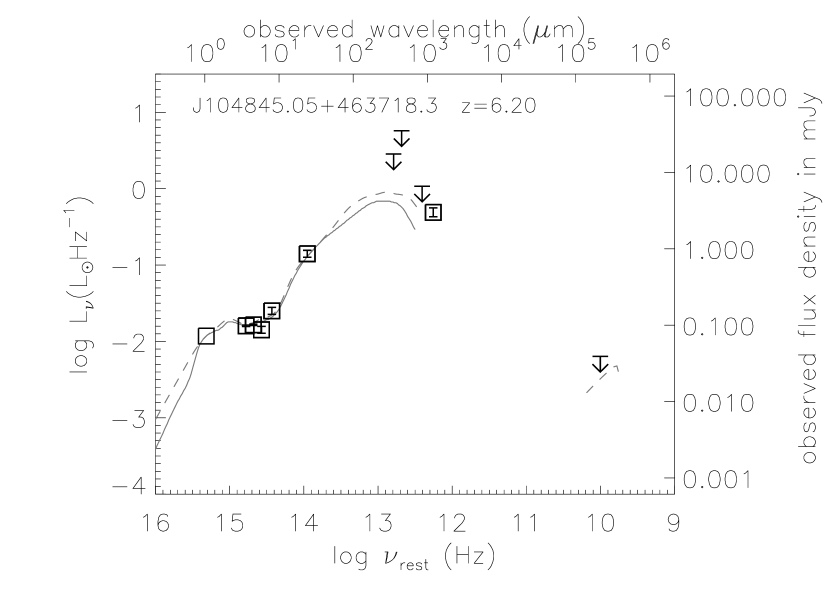
J104845.05+463718.3 (hereafter J1048+4637) is a broad absorption line quasar at z=6.20 from Fan et al. (2003). The MAMBO flux density for this source is (Bertoldi et al. 2003). However, it has not been detected by SCUBA (Robson et al. 2004), or by the VLA (Wang et al. 2007).
Our SHARC-II observation did not detect this source. The pixel flux density value at the optical quasar position is , with a rms of on the final map. Thus we adopt ( rms) as an upper limit to the 350m flux density.
The optical-to-radio SEDs of the four quasars are plotted in Figure 2, displaying the photometric data listed in Table 1 and 2. Template SEDs of local quasars from Elvis et al. (1994) and Richards et al. (2006) are plotted for comparison, normalized to . For J1048+4637, the measurements at submillimeter, millimeter and radio wavelengths are all consistent with the templates, i.e. the average SED emission of the typical type-I quasar in the local universe. However, strong FIR emission is seen in the other three sources, which exceed the templates by nearly an order of magnitude. This is similar to the FIR excess from warm dust shown in the SED of J1148+5251 by Beelen et al. (2006).
We fit the FIR bumps of the three sources with an
optically thin graybody, namely
| (1) |
where is the emissivity index, is the dust temperature in K, is the amplitude factor, and is the rest frame flux density in mJy. Since there are only two or three data points available for each source, we fix the value to 1.6 (Beelen et al. 2006), and then fit and for the three sources. A Levenberg-Marquardt least-squares fit is performed with the IDL package MPFIT. The best-fitting dust temperatures range from with fitting errors of 3 to 4 K. In Figure 2, we also extended the fitted FIR SED to radio for the three detections, using a radio spectral index of -0.75 and an average FIR-to-radio emission ratio of found in typical star forming galaxies (Yun et al. 2001). The observed radio emission/upper limit of the three objects are all consistent with the model SED, i.e. within the range of FIR-to-radio emission ratios five times above or below the average value of star forming galaxies, but the detected flux densities in J0756+4104 and J0927+2001 are 0.2 to 0.4 index higher than the value derived with q=2.34.
The FIR luminosity is calculated from the fitted
SED, integrating rest frame 42.5m to 122.5m, namely
| (2) |
where is the luminosity distance in Mpc and is in .
We calculate the dust masses following
| (3) |
where is the planck function and is the dust absorption coefficient. We adopt at 125m (Hildebrand 1983). The derived parameters for the three SHARC-II detected sources are listed in the last four columns in Table 2.
4 Discussion
We have detected three high redshift quasars with SHARC-II at 350m. These are among the most sensitive observations made by SHARC-II, and increase the number of 350m detected optical quasars at z5 to four. These quasars are all strong detections in previous MAMBO and SCUBA observations at longer wavelengths (Carilli et al. 2001; Petric et al. 2003; Robson et al. 2004; Wang et al. 2007), and the measurements given by SHARC-II are close to the FIR emission peak from warm dust. By sampling over the dust peak, we provide reliable measurements of temperature, mass, and FIR luminosity of the FIR-emitting warm dust. As with J1148+5251, (Bertoldi et al. 2003; Beelen et al. 2006), the three newly detected sources show that excess emission from huge amounts of warm dust can exist in some optically bright quasars at extreme redshifts.
The derived dust masses are all . This result confirms the high heavy element abundance and rapid dust formation in massive quasar hosts at z5 (Priddey et al. 2003b; Bertoldi et al. 2003a) when the age of the universe was . At this epoch, the standard mechanism of ISM dust formation, i.e. stellar winds from evolved low mass stars, is inefficient as it requires very long time scales (). A process associated with the evolution of massive stars, (with a much shorter time scale), is likely required (eg. Morgan & Edmunds 2003; Schneider et al. 2004; Maiolino et al. 2004).
All of the SHARC-II detected z5 quasars exhibit FIR luminosities
of . Under the optically
thin assumption (i.e. the optical depth at FIR wavelengths),
the size of the dust emission region can be roughly estimated
as
| (4) |
where the emissivity index , , and is the critical frequency with . To satisfy the optically thin assumption, we adopt (i.e. ). The derived is , which suggests the FIR-emitting warm dust emission region is on kpc scales in the quasar host. This is consistent with the scales of CO emission and [C II] 158m emission found in J1148+5251 (Walter, et al. 2004, 2007, in prep.).
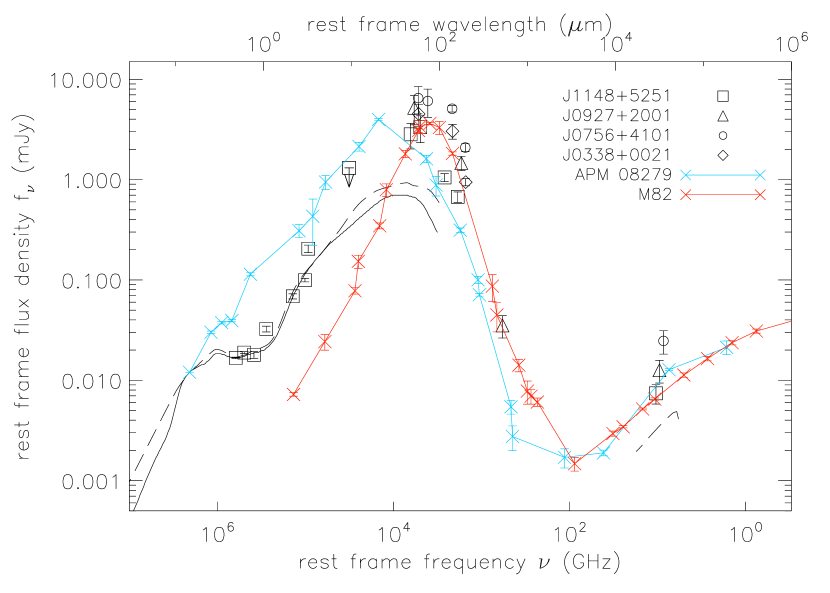
The dust temperatures derived from these z5 quasars are in the range from to , which is comparable to the values found in the bright (sub)mm quasars at lower redshifts (Benford et al. 1999; Beelen et al. 2006). They are also within the range of about 11 to 72 K found in samples of submillimeter selected galaxies at z1 to 3.5, but a little higher than the mean value of 35 K (Chapman et al. 2005; Kovcs et al. 2006b). We combine the infrared to radio data of all four SHARC-II detected z5 quasars and plot them in Figure 3. The combined SED is compared to that of another two sources, the z=3.9 quasar APM 08279+5255 (Irwin et al. 1998; Lewis et al. 1998, 2002; Downes et al. 1999; Egami et al. 2000; Beelen et al. 2006; Wagg et al. 2005; Wei et al. 2007) and the local starburst galaxy M82 (Telesco & Harper 1980; Klein et al. 1988; Hughes et al. 1990; Smith et al. 1990; Krgel et al. 1990). The FIR emission from APM 08279+5255 is suggested to be dominated by a 200 K dust component on scales of a few hundred pc, i.e. a typical AGN heated hot dust torus (Wei et al. 2007), while the FIR emission in the starburst galaxy M82 is clearly from starburst heated warm dust with a temperature of 45 K (Klein et al. 1998). The combined FIR-to-radio emission of the four quasars can be probed by the SED of M82 very well, but is quite different from the dusty AGN emission from APM 08279+5255, which peaks at a shorter wavelength () and shows a much steeper infrared slope. Among the four z5 SHARC-II detections, only J1148+5251 have Spitzer measurements at near-IR wavelengths (Charmandaris et al. 2004; Jiang et al. 2006), and the flux densities are all much lower compared to the near-IR emission of APM 08279+5255.
The estimate of and the comparison of the IR SEDs may suggest a starburst origin of the strong FIR emission in these z5 quasars detected by SHARC-II and other (sub)mm detectors. If this is the case, the star formation rates derived from the FIR luminosities are all (as listed in Col. (8), Table 2)111We estimate the star formation rate with the empirical relationship from Kennicutt (1998) assuming a standard initial mass function, i.e. , where is the infrared luminosity (8-1000m) in unit of , and is for warm dust emission., indicating an active bulge building in these quasar hosts. We expect future observations with Spitzer and the Herschel Space Observatory to better constrain the dust emission SEDs of these objects, and high resolution imaging () with the Atacama Large Millimeter Array (ALMA) to constrain the size of the dust emission region These future observations will give a better understanding of star formation and warm dust heating in these high-z bright (sub)mm quasars.
References
- (1) Anderson, S. F. et al. 2001, AJ, 122, 503
- (2) Beelen, A., Cox, P., Benford, D. J., Dowell, C. D., Kovcs, A., Bertoldi, F., Omont, A., & Carilli, C. L. 2006, ApJ, 642, 694 ApJ, 450, 559
- (3) Bertoldi, F., Carilli, C. L., Cox, P., Fan, X., Strauss, M. A., Beelen, A., Omont, A., & Zylka, R. 2003a, A& A, 406, L55
- (4) Bertoldi, F. et al. 2003b, A& A, 409, L47
- (5) Carilli, C. L. et al. 2001, ApJ, 555, 625
- (6) Carilli, C. L. et al. 2004, AJ, 128, 997
- (7) Carilli, C. L. et al. 2007, ApJL, in press, (astro-ph/0707.2339)
- (8) Chapman, S. C., Blain, A. W., Smail, I., & Ivison, R. J. 2005, ApJ, 622, 772
- (9) Charmandaris, V. et al. 2004, ApJS, 154, 142
- (10) Dowell, C. D. et al. 2003, Proc. SPIE, 4855, 73
- (11) Downes, D., Neri, R., Wiklind, T., Wilner, D. J., & Shaver, P. A. 1999, ApJ, 513, L1
- (12) Egami, E., Neugebauer, G., Soifer, B. T. & Matthews, K. 2000, ApJ, 535, 561
- (13) Elvis, M. et al. 1994, ApJS, 95, 1
- (14) Fan, X. et al. 1999, AJ, 118, 1
- (15) Fan, X. et al. 2003, AJ, 125, 1649
- (16) Fan, X., Carilli, C. L., & Keating, B. 2006a, ARA&A, 44, 415
- (17) Fan, X. et al. 2006b, AJ, 131, 1203
- (18) Fritz, J., Franceschini, A., & Hatziminaoglou, E. 2005, MNRAS, 366, 767
- (19) Helou, G., Soifer, B. T., & Rowan-Robinson, M. 1985, ApJ, 298, L7
- (20) Hughes, D. H., Gear, W. K., & Robson, E. I. 1990, MNRAS, 244, 759
- (21) Irwin, M. J., Ibeta, R. A., Lewis, G. F., & Totten, E. J. 1998, ApJ, 505, 529
- (22) Jiang, L. et al. 2006, AJ, 132, 2127
- (23) Kennicutt, R. C. 1998, ARA&A, 36, 189
- (24) Klein, U., Wielebinski, R., & Morsi, H. W. 1988 A&A 190,41
- (25) Krgel, E., Chini, R., Klein, U. et al. 1990, A&A, 240, 232
- (26) Kovcs, A. 2006a, PhD thesis, Caltech
- (27) Kovcs, A., Chapman, S. C., Dowell, C. D., Blain, A. W., Ivison, R. J., Smail, I., & Phillips, T. G., 2006b, ApJ, 650, 592
- (28) Leong M. M. 2005, URSI Conf. Sec., J3-J10, 426
- (29) Lewis, G. F., Chapman, S. C., Ibata, R. A., Irwin, M. J., & Totten, E. J., 1998, ApJ, 505, L1
- (30) Lewis, G. F., Carilli, C., Papadopoulos, P., Ivison, R. J. 2002, MNRAS, 330, L15
- (31) Maiolino, R., Schneider, R., Oliva, E., Bianchi, S., Ferrara, A., Mannucci, F., Pedani, M., & Roca, S. M. 2004, Nature,431,533
- (32) Maiolino, R. et al. 2007, A&A, in press
- (33) Morgan, H. L., & Edmunds, M. G., 2003, MNRAS, 343, 427
- (34) Omont, A., Cox, P., Bertoldi, F., Cox, P., Carilli, C. L., Priddey, R. S., McMahon, R. C., & Isaak, K. G. 2001, A&A, 374, 371
- (35) Omont, A., Beelen, A., Bertoldi, F., McMahon, R. G., Carilli, C. L., & Isaak, K. G. 2003, A&A, 398, 657
- (36) Petric, A. O., Carilli, C. L., Bertoldi, F., Fan, X., Cox, P., Strauss, M. A., Omont, A., & Schneider, D. P. 2003, AJ, 126, 15
- (37) Priddey, R. S., Isaak, K. G., McMahon, R. G., & Omont, A. 2003a, MNRAS, 339, 1183
- (38) Priddey, R. S., Isaak, K. G., McMahon, R. G., Roboson, E. I., & Pearson, C. P. 2003b, MNRAS, 344, L74
- (39) Priddey, R. S., Ivison, R. J., & Isaak, K. G. 2007, MNRAS, submitted, (astro-ph/0709.0610)
- (40) Richards, G. T. et al. 2006, ApJS, 166, 470
- (41) Riechers, D. A. et al. 2006, ApJ, 650, 604
- (42) Robson, I., Priddey, R. S., Isaak, K. G., & McMahon, R. G. 2004, MNRAS, 351, L29
- (43) Sanders, D. B., Phinney, E. S., Neugebauer, G., Soifer, B. T., & Mattherws, K. 1989, ApJ, 347, 29
- (44) Schneider, R., Ferrara, A., & Salvaterra, R. 2004, MNRAS, 351, 1379
- (45) Smith, P. A., Brand, P. W. J. L., Puxley, P. J., Mountain, C. M., & Nakai, N. 1990, MNRAS, 243, 97
- (46) Solomon, P. M., & Vanden Bout, P. A. 2005, ARA&A, 43, 677
- (47) Spergel, D. N. et al. 2007, ApJS, 170, 377
- (48) Telesco, C. M., & Harper, D. A. 1980, ApJ, 235, 392
- (49) Wagg, J., Wilner, D. J., Neri, R., Downew, D., & Wiklind, T. 2005, ApJ, 634, L13
- (50) Walter, F., Carilli, C. L., Bertoldi, F., Menten, K., Cox, P.,Lo, K. Y., Fan, X., & Strauss, M. A. 2004, ApJ, 615, L17
- (51) Walter, F. et al. 2007, in prep.
- (52) Wang, R. et al. 2007, AJ, 134, 617
- (53) Wei, A., Downes, D., Neri, R., Walter, F., Henkel, C., Wilner, D. J., Wagg, J., & Wiklind, T. 2007, A&A, 467, 955
- (54) Yun, M. S., Reddy, N. A., & Condon, J. J. 2001, ApJ, 554, 803
| SDSS name | z | ||||||
| mJy | mJy | mJy | mJy | Jy | |||
| (1) | (2) | (3) | (4) | (5) | (6) | (7) | (8) |
| J033829.31+002156.3 | 5.03 | 20.01a | 516b | 11.92.0b | 3.70.3c | — | 3725c |
| J075618.14+410408.6 | 5.09 | 20.15d | 165l | 13.41.0l | 5.50.5e | — | 6517e |
| J092721.82+200123.7 | 5.77 | 19.87f | — | — | 5.00.8g | 0.120.03k | 4514g |
| J104845.05+463718.3 | 6.20 | 19.25h | 7.611.7i | 2.32.2i | 3.00.4j | — | 611g |
aFan et al. (1999). bPriddey et al. (2003b). cCarilli et al. (2001). dAnderson et al. (2001). ePetric et al. (2004). fFan et al. (2006). gWang et al. (2007). hFan et al. (2003). iRobson et al. (2004). jBertodi et al. (2003a). kCarilli et al. (2007). lPriddey et al. (2007)
| SDSS name | Offsets | Int. time | SFR | ||||
|---|---|---|---|---|---|---|---|
| ′′ | hours | K | |||||
| (1) | (2) | (3) | (4) | (5) | (6) | (7) | (8) |
| J033829.31+002156.3 | 17.74.4 | 3.8 | 7.2 | 0.920.17 | 6.1 | 45.63.2 | 2.2 |
| J075618.14+410408.6 | 17.15.2 | 4.3 | 6.3 | 0.840.17 | 12.1 | 39.22.6 | 1.9 |
| J092721.82+200123.7 | 17.75.7 | 3.9 | 7.3 | 1.210.28 | 4.6 | 51.14.2 | 3.2 |
| J104845.05+463718.3 | — | 8.0 | — | — | — | — |
a Note that the absolute calibration uncertainty of 20% is not included in the rms.
We adopt an emissivity index of here for all the calculations (Beelen et al. 2006).