A Search for Synchrotron X-ray Emission in Radio Quasars
Abstract
This paper presents XMM-Newton and Chandra X-ray spectroscopy of ten flat-spectrum radio quasars (FSRQ) which are candidates to have an X-ray spectrum dominated by jet synchrotron emission. In all these FSRQ, which are less strongly relativistically beamed than blazars, a considerable contribution from a power-law component similar to that present in radio-quiet quasars is required to explain the observed X-ray fluxes and X-ray spectral slopes. And as in radio-quiet quasars, their relatively high optical/UV fluxes can be accounted for by a significant contribution from thermal accretion disk emission. The lack of success in finding radio quasars with synchrotron X-rays is attributed to the adopted selection criteria, which were based on the multiwavelength flux ratios of BL Lacertae (BL Lac) objects. A refined selection technique, which additionally involves radio imaging, is proposed to search for these important candidates for the Gamma Ray Large Area Space Telescope (GLAST). On the other hand, the discovered FSRQ with their strong accretion disk signatures are expected to be important probes for studies of the poorly known accretion disk - jet connection.
1 Introduction
Blazars offer us the unique possibility to study the spectral energy distributions (SEDs) of relativistic jets. Being radio galaxies with their jets oriented at relatively small angles with respect to our line of sight they profit from the relativistic beaming effect. This enhances dramatically (by factors up to ) the intrinsic jet (core) flux and thus makes it the dominant continuum emission at all frequencies [see Urry & Padovani (1995) for a review].
As first discussed by Jones et al. (1974) two emission processes dominate the multiwavelength SEDs of relativistic jets and, therefore, of blazars, namely, synchrotron and inverse Compton. These give rise to two prominent emission peaks in a logarithmic plot, which were observationally demonstrated by Sambruna et al. (1996) and Fossati et al. (1998). The synchrotron emission peak () in blazars is observed within a wide range of frequencies (from infrared to soft-X-rays) in sources with weak emission lines, the BL Lacertae objects (BL Lacs; e.g., Giommi et al., 1995; Fossati et al., 1998; Giommi et al., 2005). However, strong-lined blazars, the flat-spectrum radio quasars (FSRQ), had until recently synchrotron emission peaks at relatively low energies and thus X-rays dominated by inverse Compton emission (e.g., Gambill et al., 2003; Tavecchio et al., 2002; Sambruna et al., 2006).
Based on this finding some authors proposed the so-called “blazar sequence” (Sambruna et al., 1996; Fossati et al., 1998; Ghisellini et al., 1998). This scenario advocates that the frequency of the synchrotron emission peak is governed by particle Compton cooling by an external radiation field. Such a field, produced by, e.g., the accretion disk or broad emission line region (BLR), both more luminous in radio quasars than in BL Lacs, is expected to interact with the particles in the jet via the inverse Compton process causing them to lose energy. Therefore, within this scenario radio quasars with Hz and thus X-rays dominated by synchrotron emission are not expected to exist.
Two new surveys have recently shown that mere selection effects had prevented us so far from finding “X-ray loud” radio quasars, allowing for the possibility that radio quasars with high existed. About 10% of the FSRQ discovered in the Deep X-ray Radio Blazar Survey (DXRBS; Perlman et al., 1998; Landt et al., 2001) and of the ones identified in the ROSAT All-Sky Survey (RASS) - Green Bank (RGB; Laurent-Muehleisen et al., 1998, 1999) have multiwavelength flux ratios similar to those of BL Lacs with synchrotron X-rays (Padovani et al., 2003). In addition, subsequent investigations of the EINSTEIN Medium Sensitivity Survey (EMSS) and the Slew survey revealed that these radio quasars had gone undetected in previous surveys (Wolter & Celotti, 2001; Perlman et al., 2001).
The definite proof of the synchrotron nature of the X-ray emission in these newly discovered blazars, however, requires X-ray spectroscopy. Padovani et al. (2002) presented BeppoSAX observations of four “X-ray loud” FSRQ and found that the synchrotron emission of one source, RGB J16294008, peaked at UV frequencies ( Hz) and dominated the X-rays. In this paper we present XMM-Newton and Chandra observations of a further ten of these sources.
The observed sample was selected as discussed in Section 2 and the data acquired and analyzed as described in Section 3. The multiwavelength SEDs of the sample are presented in Section 4 and the results discussed in Section 5. Section 6 gives a brief summary. Throughout this paper cosmological parameters km s-1 Mpc-1, , and have been assumed. Energy spectral indices have been defined as and photon spectral indices as , where .
2 The Sample Selection
We have selected for X-ray spectroscopy FSRQ from the DXRBS and RGB survey which had multiwavelength flux ratios similar to those of BL Lacs with X-rays dominated by synchrotron emission. To this selection criterion we have added different constraints in the case of the XMM-Newton and the Chandra observed samples (see below).
As first suggested by Padovani & Giommi (1995) BL Lacs that emit synchrotron radiation which peaks at low (IR/optical) frequencies, the so-called low energy-peaked BL Lacs (LBL), can be distinguished from those that emit synchrotron radiation which peaks at higher (UV/soft-X-ray) frequencies, the so-called high energy-peaked BL Lacs (HBL), by their distinct ratios between their radio, optical and X-ray fluxes. These ratios are usually studied by plotting the objects in an () plane, where and are the usual rest-frame effective spectral indices defined between 5 GHz, 5000 Å, and 1 keV. In this plane constant values are represented by straight lines of slope (see Fig. 1).
A sequence of synchrotron emission peak frequencies in BL Lacs produces a specific trail in the () plane (Padovani & Giommi, 1995). While the synchrotron emission peak is at low enough frequencies for the X-rays to be dominated by inverse Compton radiation (as in LBL), is roughly constant, whereas decreases and increases as the peak moves to higher energies (see also Giommi et al. (2002)). When the synchrotron radiation starts to dominate the X-ray band (as in HBL), starts to decrease, with LBL and HBL having values of and , respectively (Padovani & Giommi, 1996). Now is roughly constant (and low) and decreases. Based on these considerations Padovani et al. (2003) have defined a region in the () plane expected to be populated by high-energy peaked blazars, both BL Lacs and FSRQ (see their Fig. 1). This so-called “HBL box” represents the 2 region around the mean , and values of all HBL in the multifrequency active galactic nuclei (AGN) catalog of Padovani et al. (1997).
We have selected for X-ray spectroscopy with XMM-Newton and Chandra FSRQ that populate the “HBL box” (Fig. 1). For observations with XMM-Newton we have chosen FSRQ from DXRBS only and have additionally required that the synchrotron emission peak frequency, estimated from a crude multiwavelength SED including only radio, optical and X-ray data points (Padovani et al., 2003), was Hz. Eight sources satisfied these criteria and were proposed. We were granted observing time in Cycle 3 for 4/8 sources (PI: Padovani). For observations with Chandra we have selected sources from the sample of DXRBS and RGB FSRQ imaged with the VLA by Landt et al. (2006) and made an additional constraint that extended radio structure was present. In this case the goal was to study the extended X-ray morphology in addition to the core spectrum. Six sources satisfied these criteria and were proposed. We were granted observing time in Cycle 6 for all six sources (PI: Landt).
Table 1 summarizes the general properties of our sample. For all ten X-ray observed sources we have deep radio observations obtained with the VLA at 1.4 GHz in A configuration and for 8/10 sources also in C configuration. These data have been published recently (Landt et al., 2006) and we reproduce here for convenience also some of these radio measurements.
3 The X-ray Observations
On-board XMM-Newton we used the European Photon Imaging Camera (EPIC). In Table 2 we give the journal of observations for the three CCD cameras, MOS 1, MOS 2 and PN. All three cameras were operated in small window mode and the thin filter was used. The source WGA J10266746 was observed twice. However, the first observation taken on 23 March 2004 was strongly affected by high radiation and, therefore, not useful for our purposes.
On-board Chandra we used the Advanced CCD Imaging Spectrometer (ACIS) with the back-illuminated S3 chip at the aim-point. All sources were observed with a 1/8 subarray, except for WGA J23470852 which was observed with a 1/4 subarray. The observations were performed in faint timed mode. In order to avoid that the readout streak falls on the extended jet structures of our sources we additionally imposed roll angle constraints. In Table 3 we give the journal of observations.
3.1 The X-ray Data Analysis
The EPIC data were processed using the XMM Science Analysis Software (SAS; version 6.1.0). The initial data files were reprocessed with the EMPROC and EPPROC scripts with default settings, using the latest known calibration files (as of August 2005). We used X-ray events with patterns and energies in the range keV for the two MOS cameras. For the PN, we selected X-ray events with patterns (single and double pixel events) and energies in the range keV. The non-X-ray background was relatively high only in the case of WGA J0110.51647. For this source we excluded from the analysis of the PN in the energy range keV time intervals with count rates counts s-1. Source spectra were extracted from circular regions of radius for the two MOS and radius for the PN. This corresponds to an encircled energy of . Background spectra were taken from a similar circular region, offset from the source position. None of the source light curves showed variability over the duration of the observations after the removal of the background.
The ACIS initial event files were reprocessed using the CIAO software package (version 3.3) applying the latest known calibration files (as of February 2006). We filtered for bad grades and used only X-ray events with energies in the range keV. High non-X-ray background periods were not present in our data. Source spectra were extracted from circular regions of radius, corresponding to an encircled energy of at 1.5 keV. Background spectra were taken from a similar circular region, offset from the source position. None of the source light curves showed variability over the duration of the observations after the removal of the background.
3.2 The X-ray Spectral Fits
The background subtracted EPIC and ACIS spectra were fit using XSPEC (version 12.2), with the individual response and ancillary matrices produced with SAS and CIAO, respectively, from the source spectra. Spectra were binned to a minimum of 20 counts per bin in order to apply the minimization technique.
We initially fit the individual X-ray spectra from the three EPIC detectors in order to check for consistency between the datasets. From a simple power-law fit we found that the photon indices agreed within and that the relative normalizations were consistent to within 10%. Therefore, for all sources we proceeded to fit the three datasets simultaneously, allowing for the individual normalizations to vary.
We fit the data both with single and broken power-law models with photo-electric absorption using Wisconsin cross-sections from Morrison & McCammon (1983). The hydrogen column densities were fixed to the Galactic value (Dickey & Lockman, 1990) and in the case of the single power-law fits also allowed to vary in order to check for internal absorption and/or indications of a “soft excess”. The results for the single power-law fits to the EPIC and ACIS spectra are reported in Tables 4 and 5, respectively. The results for the broken power-law fits to the EPIC and ACIS spectra are reported in Tables 6 and 7, respectively.
3.3 Discussion of Individual Sources
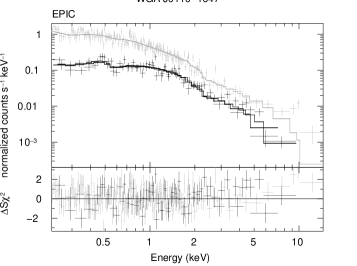
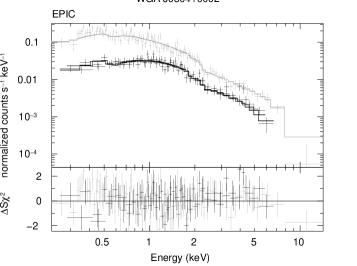
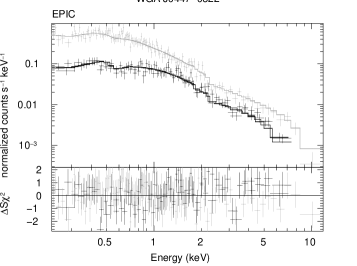
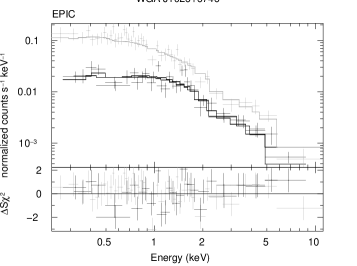
In the following we discuss for each object the results of the X-ray spectral analysis. In Figs. 2 and 3 we show for the XMM-Newton and Chandra observed sources, respectively, the best-fit for the model which we consider the most appropriate. This is a single power-law with Galactic absorption for 7/10 sources and a broken power-law with Galactic absorption for 3/10 sources, namely, WGA J04470322, RGB J01123818, and RGB J22293057.
WGA J01101647. The EPIC data are well fit by a single power-law with Galactic absorption and a spectral index of . The data suggest that a broken power-law is a better fit (-test ) than a single power-law. But since the break is at relatively high energies ( keV), the hard power-law cannot be constrained by the present data. The soft spectral index is in this case similar to the one obtained for the single power-law fit. Additionally, there is a hint in the data of a soft excess; the fit is marginally improved (-test ) assuming an absorption lower than Galactic, but in this case the is not well constrained.
WGA J03040002. The EPIC data are well fit by a single power-law with Galactic absorption and a spectral index of . There is a hint in the data of a soft excess; the fit is marginally improved (-test ) assuming an absorption lower than Galactic. The fit is also marginally improved (-test ) if we assume a broken power-law instead of a single power-law. But in this case both the soft and hard spectral indices are similar to the one obtained for the single power-law.
WGA J04470322. The EPIC data are well fit by a broken power-law with Galactic absorption. This fit represents a significant improvement relative to a fit by a single power-law (-test ). The resulting spectral indices of the soft and hard power-laws are and , respectively, with an observed break at energy keV.
WGA J10266746. The EPIC data are well fit by a single power-law with Galactic absorption and a spectral index .
RGB J01123818. The ACIS data are well fit by a broken power-law with Galactic absorption. This fit represents a significant improvement relative to a fit by a single power-law (-test ). The resulting spectral indices of the soft and hard power-laws are and , respectively, with an observed break at energy keV.
RGB J02543931. The ACIS data are well fit by a single power-law with Galactic absorption and a spectral index .
RGB J22293057. The ACIS data are well fit by a broken power-law with Galactic absorption. This fit represents a significant improvement relative to a fit by a single power-law (-test ). The resulting spectral indices of the soft and hard power-laws are and , respectively, with an observed break at energy keV.
RGB J22562618. The ACIS data are well fit by a single power-law with Galactic absorption and a spectral index .
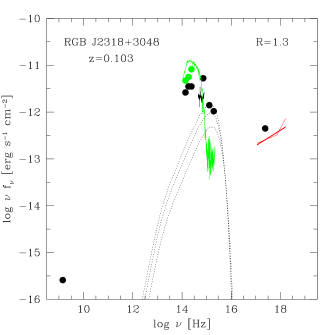
RGB J23183048. The ACIS data are well fit by a single power-law with Galactic absorption and a spectral index of . There is a hint in the data of a soft excess; the fit is marginally improved (-test ) assuming an absorption lower than Galactic, but in this case the is not well constrained. The fit is also marginally improved (-test ) if we assume a broken power-law instead of a single power-law. But in this case both the soft and hard spectral indices are similar to the one obtained for the single power-law.
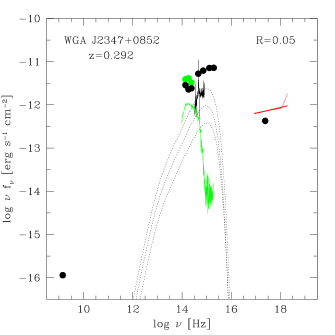
WGA J23470852. The ACIS data are well fit by a single power-law with Galactic absorption and a spectral index of . There is a hint in the data of a soft excess; the fit is marginally improved (-test ) assuming an absorption lower than Galactic. The fit is also marginally improved (-test ) if we assume a broken power-law instead of a single power-law. But in this case the break is at relatively high energies ( keV) and the resulting soft spectral index is similar to the one obtained for the single power-law fit.
4 The Spectral Energy Distributions
In order to constrain the origin of the X-ray emission in our sources, and in particular to understand if it is produced by the synchrotron jet component, we have related it to the multiwavelength SED. Additionally, we have estimated the flux contribution expected from the two thermal emission components present in radio quasars, namely, the accretion disk and the host galaxy.
4.1 The Multiwavelength Data
We have used the following uniform multiwavelength data, which, with the exception of the magnitudes from the Optical Monitor (OM) on-board XMM-Newton, are non-simultaneous with our X-ray observations (but, as noted below, in part simultaneous with each other):
- 1.
- 2.
- 3.
-
4.
optical magnitudes (simultaneous to each other) from the Sloan Digital Sky Survey (SDSS; Adelman-McCarthy et al., 2006) Data Release 6 for WGA J03040002, our only source included in this survey ( mag, mag, mag, mag, and mag);
- 5.
-
6.
optical and UV magnitudes (simultaneous to each other) from the OM for the four sources observed with XMM-Newton (see Table 9);
- 7.
-
8.
unabsorbed ROSAT X-ray flux densities at 1 keV (see Table 1).
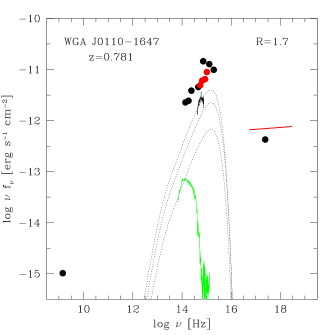
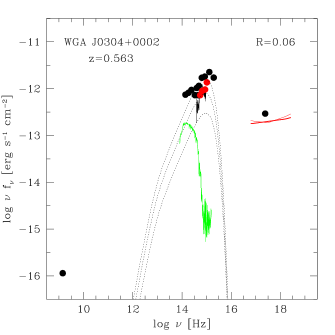
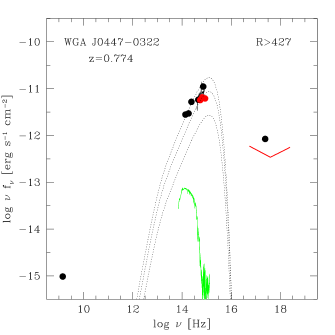
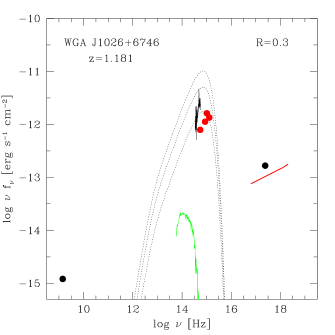
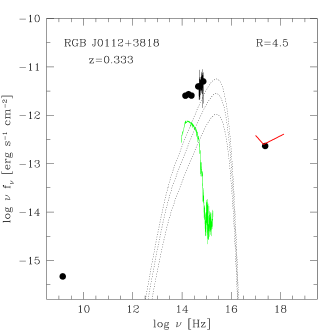
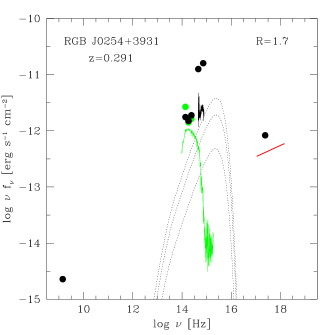
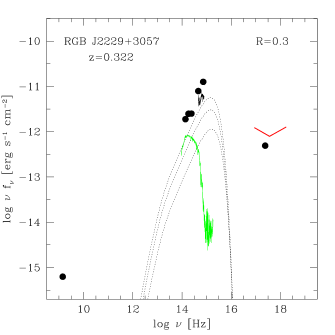
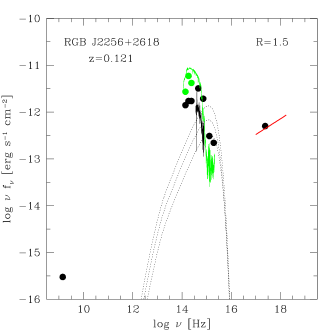
The multiwavelength SEDs of our sources are shown in Figs. 4 and 5 for our XMM-Newton and Chandra observed sources, respectively. We have plotted the SEDs in the observer’s frame as log vs. log . In such a representation the peak indicates directly at which frequency most of the energy is emitted. All magnitudes have been corrected for Galactic extinction prior to their inclusion in Figs. 4 and 5. For this purpose we used the analytical expression for the interstellar extinction curve of Cardelli et al. (1989) and a parameter of to transform the values to values. We note that the optical spectra were obtained through a relatively small () aperture, and, therefore, in particular for nearby objects, are not expected to account for all the flux from extended emission components, such as, e.g., the host galaxy (see Section 4.2.2).
4.2 The Thermal Emission Components
In addition to the relativistically beamed, non-thermal jet emission, two thermal emission components are expected to be present in radio quasars: the accretion disk and the host galaxy. We have estimated their contribution to the multiwavelength SED as follows.
4.2.1 The Accretion Disk
We have calculated accretion disk spectra assuming a steady geometrically thin, optically thick accretion disk. In this case the emitted flux is independent of viscosity and each element of the disk face radiates roughly as a blackbody with a characteristic temperature, which depends only on the mass of the black hole, , the accretion rate, , and the radius of the innermost stable orbit (e.g., Peterson, 1997; Frank et al., 2002). We have adopted the Schwarzschild geometry (non-rotating black hole) and for this the innermost stable orbit is at , where is the gravitational radius defined as with the gravitational constant and the speed of light. Furthermore, we have assumed that the disk is viewed face-on.
The accretion disk spectrum is fully constrained by the two quantities, accretion rate and mass of the black hole, which we have estimated as follows. We have calculated the accretion rate from the luminosity of the broad emission lines using the two relations: (1) , where and are the total ionizing power of the disk and the efficiency for converting matter to energy, respectively, with 6% in the case of a Schwarzschild black hole; and (2) , where and are the BLR covering factor and luminosity, respectively. We have calculated BLR luminosities from the fluxes of the observed broad emission lines as described in Celotti et al. (1997). The optical spectra of our sources cover mostly the broad emission lines Mg II and H, and in two cases also H. The BLR covering factor is not well known, but is derived to be in the range of % (Maiolino et al., 2001, and references therein) and in general a canonical value of % is assumed (Peterson, 1997).
Assuming that the BLR is gravitationally bound, the mass of the black hole can be estimated based on the virial theorem from the width of a broad emission line and the ionizing luminosity. In this case the ionizing power is used as a surrogate for the BLR radius. Following D’Elia et al. (2003) we have calculated black hole masses for 6/10 sources using the full width at half maximum (FWHM) of H and the ionizing power , the latter calculated from the BLR luminosity as above. For 4/10 sources, for which the optical spectrum does not cover the wavelength of H, we have used the Mg II FWHM as a substitute for that of H. As McLure & Jarvis (2002) have shown, the widths of H and Mg II are almost identical, indicating that, as expected from their (similar) ionization potentials, these two broad emission lines are produced at similar radii.
In Table 10 we list for our sources the observed BLR luminosities and line widths along with the accretion rates and black hole masses calculated assuming %. We note that in two sources, namely, WGA J03040002 and WGA J23470852, H has a clear narrow component, which we have subtracted before measuring the width. In Figs. 4 and 5 we show accretion disk spectra (black, dotted curves) for three sets of accretion rates and black holes masses corresponding to and 30% (from top to bottom).
4.2.2 The Host Galaxy
The host galaxies of radio quasars are bright ellipticals that exhibit a relatively narrow range in luminosity (standard deviation mag; e.g., McLure et al., 2004; Dunlop et al., 2003, 1993; Kotilainen et al., 1998). Therefore, we have estimated the contribution from this emission component using the elliptical galaxy template of Mannucci et al. (2001), which extends from near-IR to UV frequencies, and assuming a fixed absolute luminosity in the (rest-frame) -band of mag. This is the average value obtained by McLure et al. (2004) for the host galaxy luminosities of a sample of 41 radio galaxies imaged with the Hubble Space Telescope in the (observer’s frame) I-band. The green, solid curves in Figs. 4 and 5 show our results.
5 Results and Discussion
We now address the main question of this paper: Have we found among this subsample of “X-ray loud” radio quasars as expected strong-lined blazars with Hz and thus X-rays dominated by synchrotron emission?
5.1 Is the X-ray Emission Synchrotron?
In a representation of the SED as a logarithmic plot (as in Figs. 4 and 5) the two main jet components, synchrotron and inverse Compton radiation, form two humps peaking at lower and higher energies, respectively. The synchrotron emission in our sources presumably peaks at UV/soft-X-ray frequencies. Therefore, if the X-ray emission was synchrotron in origin, it would be necessarily the part of the synchrotron spectrum after the emission peak and thus curved downward. In the simplest approximation this means that in this case a single power-law with slope is expected.
In our sample, 7/10 sources are well fit by a single power-law, however, all with values . Therefore, synchrotron X-ray emission is not observed in the large majority of our sources. Three sources, namely, WGA J04470322, RGB J01123818, and RGB J22293057, are well fit by a broken power-law. The best-fits give in all three cases soft and hard spectral indices and , respectively. This suggests that, as in “intermediate” BL Lacs, we observe the spectral transition between the synchrotron and inverse Compton jet components, which in these radio quasars occurs at relatively low X-ray energies of keV.
5.2 Is the Synchrotron Peak in the UV?
In the seven sources well fit by a single power-law synchrotron emission does not dominate at X-ray frequencies. Therefore, the X-ray emission is either produced by the inverse Compton jet component as in “classical” FSRQ, indicating a relatively low , or by an emission component unrelated to the jet, indicating that the jet is generally weak. The first scenario is excluded by the values of our sources, which are much lower than the typical value of of “classical” FSRQ (Padovani et al., 2003). The latter scenario seems likely. As Table 1 shows, these FSRQ are either lobe-dominated (i.e., have , where and are the radio core and extended luminosity, respectively; 3/7 objects) or are only slightly core-dominated (i.e., have ; 4/7 objects), which suggests that their jets are weakly beamed. In this case a Hz cannot be excluded, but then these sources were not selected as high-energy peaked blazar candidates based on their jet SED.
Out of the three sources well fit by a broken power-law, only WGA J04470322 has an SED sampled simultaneously at optical/UV and X-ray frequencies (by XMM-Newton) and an extrapolation of its soft X-ray power-law to lower energies predicts fluxes a factor of below the observed OM magnitudes. This discrepancy suggests that a single emission component cannot account for the fluxes at both frequencies. Therefore, either the soft-X-ray flux is synchrotron and the optical/UV fluxes are not, in which case the accretion disk could produce the optical/UV emission (see Section 5.3), or the optical/UV magnitudes sample the synchrotron jet component (which has Hz), but the observed soft X-ray spectral slope is too flat (we refer here and in the following to “flat” and “steep” in ) to be synchrotron emission alone.
A similar argument for an additional emission component can also be made for RGB J22293057, but less stringently so, since its optical/UV magnitudes and X-ray spectrum are not simultaneous. Nevertheless, it is likely that RGB J22293057 and WGA J04470322 are similar cases, since their best-fit X-ray broken power-laws have similarly flat spectral slopes and low break energies. For RGB J01123818, an extrapolation of the soft X-ray power-law to lower energies predicts fluxes similar to the observed optical magnitudes. However, also for this source the optical and X-ray observations are not simultaneous and, moreover, its soft X-ray power-law is not as well constrained as that of WGA J04470322 and RGB J22293057.
The fact that an emission component in addition to synchrotron is required at either optical/UV or soft X-ray frequencies (or both) for WGA J04470322 and RGB J22293057 means that these sources are not strong-lined analogs to HBL. On the other hand, if instead the analogy to “intermediate” BL Lacs holds for the three sources well fit by a broken power-law, as suggested by their X-ray spectrum, we expect their synchrotron emission peak to be at relatively low frequencies (typically Hz; e.g., Giommi et al., 2002).
5.3 Revisiting the Selection Criteria
Given that in none of our sources we detected an X-ray spectrum dominated by jet synchrotron emission the important question arises: Why do the selected radio quasars have multiwavelength flux ratios typical of HBL? Our method selected sources based on their high X-ray to radio flux ratios (low ) as well as high optical to radio flux ratios (low ). Therefore, if it is not a jet synchrotron spectrum peaking at UV/soft-X-ray frequencies and dominating the X-rays that increases both the optical and X-ray fluxes relative to that at radio frequencies (as in HBL), a different emission component must cause a similar effect.
Since our sources are radio quasars with strong broad emission lines, the most likely component increasing the optical flux relative to that at radio frequencies is the accretion disk. However, low-redshift sources have usually low-luminosity AGN and their optical flux could be instead enhanced by the host galaxy emission. Our estimate of the fluxes of these two thermal emission components (Section 4.2) suggests that the accretion disk can contribute significantly to the optical fluxes of the majority of our sources (8/10 objects; see Figs. 4 and 5). The host galaxy, on the other hand, appears to dominate the optical magnitudes of only the two most nearby objects, namely, RGB J22562618 () and RGB J23183048 ().
The estimated accretion disk spectrum approximate well the optical spectra of 5/8, 2/8 and 1/8 objects if a BLR covering factor of , 10 and 30%, respectively, is assumed. In 5/8 sources we observe moderate variability (by factors of ) between the optical spectra and the magnitudes. This variability behavior is compatible with that of radio-quiet quasars (e.g., Paltani & Courvoisier, 1994; Giveon et al., 1999; Vanden Berk et al., 2004; Wilhite et al., 2005) and, as in these, it could be due to a change in accretion rate (Pereyra et al., 2006, and references therein). In this respect we note that in particular the simultaneous OM magnitudes (and in the case of WGA J03040002 also the simultaneous SDSS magnitudes) mimic the slope of the estimated accretion disk spectrum.
Our interpretation that the host galaxy dominates the optical fluxes of the two most nearby objects is supported by the fact that they appear extended on digitized images from the Second Palomar Sky Survey (POSS2). Additionally, their extended near-IR magnitudes lie well above those from the 2MASS Point Source catalog and comply with the estimated flux and spectral shape of the host galaxy. Similarly, their optical spectra mimic the expected spectral shape of the host galaxy, but the small aperture used in spectroscopy underestimates its flux.
Generally, accretion disk emission is expected to be unimportant in FSRQ. Their jets are assumed to be strongly beamed and to dominate the emission even at UV frequencies, where the accretion disk spectrum peaks (D’Elia et al., 2003). However, Landt et al. (2006, see their Fig. 11) have recently shown that a flat radio spectrum does not always ensure that the radio source is highly core-dominated and thus strongly beamed. This means that in some (few) FSRQ the accretion disk emission could dominate over the (weakly beamed) jet spectrum. As already discussed in Section 5.2, our sample seems to fall in this category. In this respect we note that the Chandra sources were chosen also because of their extended radio emission. Nevertheless, among the XMM-Newton sources, which were chosen based on their estimated high , 2/4 sources are lobe-dominated and one source has log .
Given that thermal accretion disk emission is pronounced in our sources one can assume that their X-ray fluxes are increased relative to that at radio frequencies by the same component that renders also radio-quiet quasars strong X-ray emitters. In support of the notion that both the optical/UV and X-ray fluxes in our FSRQ have a similar (non-jet) origin as in radio-quiet quasars are also their values (see Fig. 1), which are not inconsistent with those of radio-quiet quasars (e.g., Giommi et al., 1999; Strateva et al., 2005).
The X-ray emission of radio-quiet quasars is usually dominated by a power-law with a flat spectral index [e.g., (Piconcelli et al., 2005); (Just et al., 2007)], which is generally interpreted as the Comptonized hot corona of the accretion disk. The seven sources well fit by a single power-law have an average X-ray spectral index of , similar ( level) to the averages found for radio-quiet quasars. But more than half of these sources (4/7 objects) show also a hint of a broken power-law in their X-ray spectra (thin, red solid lines in Figs. 4 and 5; see also Section 3.3). In particular, in WGA J01101647, WGA J23470852 and RGB J23183048 a different (steep) component seems to emerge at higher X-ray energies (, 5 and 3 keV, respectively), and in WGA J03040002 a broken power-law similar in break energy to that observed in WGA J04470322 and RGB J22293057 but with much flatter both soft and hard X-ray spectral indices is evident at a lower significance level.
Especially the case of WGA J03040002 suggests that in the selected FSRQ the flat X-ray power-law component present in radio-quiet quasars adds onto the jet SED, leading to an increase in total X-ray flux and to a flattening of both soft and hard X-ray spectral slopes. Then in sources where this component is particularly strong relative to the jet, such as, e.g., WGA J01101647, the jet inverse Compton component can emerge only at higher energies.
To a first approximation we expect in this scenario that the stronger the relativistic beaming, the stronger the jet contribution and, therefore, the less flattened the X-ray spectral slopes. And indeed, two of the three sources well fit by a broken power-law are also those with the highest radio core-dominance values in the sample (log for WGA J04470322 and log for RGB J01123818).
The additional flat X-ray power-law will dominate the jet SED in particular around the spectral transition point between the synchrotron and inverse Compton components. This is exemplified by our simulations in Fig. 7 for which we have used the average blazar SED of Giommi et al. (2005) and to which we have added a component with a spectral index of , assuming flux ratios at the jet SED transition point of 1, 5, 10, 20, 30, 40, 50, 100, and 150. Therefore, an increased X-ray flux relative to that at radio frequencies is expected to be more pronounced in FSRQ whose spectral break is at or around the selection X-ray energy. In this respect we note that 4/10 sources in our sample and 2/4 sources observed by Padovani et al. (2002) have a detected jet SED transition point around keV (the X-ray energy used to calculate the and values).
5.4 A Refined Selection Technique
Padovani et al. (2002) and this work presented X-ray spectroscopy for a total of 14 “X-ray loud” radio quasars and only one source, namely, RGB J16294008, had X-rays dominated by synchrotron radiation. We have shown that this modest success in finding radio quasars with synchrotron X-rays is due to the adopted selection criteria, which efficiently select BL Lacs with synchrotron X-rays, but do not work well for radio quasars. Nevertheless, the important question remains: does a large population of radio quasars with synchrotron X-rays exist, and, if yes, how can they be efficiently found?
An efficient selection of radio quasars candidate to have synchrotron X-rays could be based on the diagram presented by Landt et al. (2006, see their Fig. 12), which plots log versus log , where and are the radio core and total X-ray luminosity, respectively. In this plot high-energy peaked FSRQ are expected to separate from the rest of the population, since they should be those strongly core-dominated radio quasars (i.e., with log ) that have the lowest ratios.
For BL Lacs values of log are known to be indicative of synchrotron X-rays (Padovani & Giommi, 1996). However, based on the results in the previous section lower values must be chosen for radio quasars. E.g., whereas RGB J16294008, which is strongly core-dominated (log ), has a ratio of log (Landt et al., 2006), the two strongly core-dominated sources in our sample, namely, WGA J04470322 and RGB J01123818, have ratios of log and (Landt et al., 2006), respectively, which are apparently not low enough to be indicative of synchrotron X-rays.
But it remains to be shown if radio quasars with synchrotron X-rays exist in large numbers and both a positive and a negative result will reveal highly significant AGN physics. A negative result could tell us that the so-called “blazar sequence” (Sambruna et al., 1996; Fossati et al., 1998; Ghisellini et al., 1998) holds to some level (Padovani, 2007), which would mean that the particles in the relativistic jets of AGN strongly interact with the ambient photon field, such as the one produced by, e.g., the accretion disk - BLR complex, already in the most inner regions where they are produced. A positive result, on the other hand, could mean that the basic properties of AGN jets, such as, e.g., their powers, magnetic field strengths or velocities, are not determined by the presence or absence of emission line regions in the nuclear regions.
Finding radio quasars with synchrotron X-rays in large numbers will also provide present and up-coming -ray missions, such as AGILE and the Gamma Ray Large Area Space Telescope (GLAST), with plenty of targets. A synchrotron spectrum peaking at UV/soft-X-ray energies produces an inverse Compton spectrum with peak at -ray frequencies. But such jets have been detected so far only in a (small) part of the BL Lac population, the HBL. Since at the high fluxes required by the sensitivity of these missions radio quasars are by far more abundant than BL Lacs (e.g., Padovani et al., 2007), high-energy peaked FSRQ instead could become the prime targets.
6 Summary and Conclusions
A considerable fraction of FSRQ discovered in the DXRBS and RGB survey have multiwavelength flux ratios similar to those of BL Lacs with synchrotron X-rays. However, the definite proof of the synchrotron nature of their X-ray emission requires X-ray spectroscopy. Padovani et al. (2002) observed four “X-ray loud” radio quasars and found one object (RGB J16294008) to have X-rays dominated by synchrotron radiation. In this paper we have presented X-ray spectroscopy of a further ten of these sources. The main results are:
1. The X-ray spectrum of 7/10 sources is well fit by a single power-law with spectral index , indicating that synchrotron X-ray emission is not the dominant component. The remaining three sources are well fit by a broken power-law with soft and hard spectral indices and , respectively, which, as in “intermediate” BL Lacs, suggests that we observe the spectral transition between the synchrotron and inverse Compton jet components.
2. The lack of success in finding radio quasars with X-ray spectra dominated by jet synchrotron emission can be attributed to the employed selection method. This was developed for BL Lacs and requires the sources to have high both optical/UV and X-ray fluxes relative to that at radio frequencies (low and values). In the case of radio quasars these criteria yield predominantly those (few) sources that have a thermal and non-thermal accretion disk component strong enough to dominate over the (weakly beamed) jet emission. The majority of the observed FSRQ are either lobe-dominated (i.e., have log ; 4/10 objects) or are only slightly core-dominated (i.e., have ; 4/10 objects).
3. The discovered radio quasars with their relatively low values and strong accretion disk signatures represent a population intermediate between “classical” FSRQ and radio-quiet quasars. This makes them unique probes for studying the poorly known accretion disk - jet connection.
4. A refined selection technique based on the work of Landt et al. (2006) is proposed to be used to search for high-energy peaked FSRQ, which, since their inverse Compton emission is expected to peak at -ray frequencies, could be prime targets for GLAST and AGILE. The recipe is: (i) choose highly core-dominated radio quasars, and among these (ii) choose radio quasars with low radio core to X-ray luminosity ratios of log .
References
- Adelman-McCarthy et al. (2006) Adelman-McCarthy, J. K., et al. 2006, ApJS, 162, 38
- Cardelli et al. (1989) Cardelli, J. A., Clayton, G. C., & Mathis, J. S. 1989, ApJ, 345, 245
- Celotti et al. (1997) Celotti, A., Padovani, P., & Ghisellini, G. 1997, MNRAS, 286, 415
- D’Elia et al. (2003) D’Elia, V., Padovani, P., & Landt, H. 2003, MNRAS, 339, 1081
- Dickey & Lockman (1990) Dickey, J. M., & Lockman, F. J. 1990, ARA&A, 28, 215
- Dunlop et al. (2003) Dunlop, J. S., McLure, R. J., Kukula, M. J., Baum, S. A., O’Dea, C. P., & Hughes, D. H. 2003, MNRAS, 340, 1095
- Dunlop et al. (1993) Dunlop, J. S., Taylor, G. L., Hughes, D. H., & Robson, E. I. 1993, MNRAS, 264, 455
- Fossati et al. (1998) Fossati, G., Maraschi, L., Celotti, A., Comastri, A., & Ghisellini, G. 1998, MNRAS, 299, 433
- Frank et al. (2002) Frank, J., King, A., & Raine, D. 2002, Accretion Power in Astrophysics (Cambridge University Press)
- Gambill et al. (2003) Gambill, J. K., Sambruna, R. M., Chartas, G., Cheung, C. C., Maraschi, L., Tavecchio, F., Urry, C. M., & Pesce, J. E. 2003, A&A, 401, 505
- Ghisellini et al. (1998) Ghisellini, G., Celotti, A., Fossati, G., Maraschi, L., & Comastri, A. 1998, MNRAS, 301, 451
- Giommi et al. (1995) Giommi, P., Ansari, S. G., & Micol, A. 1995, A&AS, 109, 267
- Giommi et al. (2002) Giommi, P., Capalbi, M., Fiocchi, M., Memola, E., Perri, M., Piranomonte, S., Rebecchi, S., & Massaro, E. 2002, in Blazar Astrophysics with BeppoSAX and Other Observatories, ed. E. M. P. Giommi & G. Palumbo (ASI/ESA), 63
- Giommi et al. (1999) Giommi, P., Menna, M. T., & Padovani, P. 1999, MNRAS, 310, 465
- Giommi et al. (2005) Giommi, P., Piranomonte, S., Perri, M., & Padovani, P. 2005, A&A, 434, 385
- Giveon et al. (1999) Giveon, U., Maoz, D., Kaspi, S., Netzer, H., & Smith, P. S. 1999, MNRAS, 306, 637
- Irwin et al. (1994) Irwin, M., Maddox, S., & McMahon, R. G. 1994, Spectrum, 2, 14
- Jones et al. (1974) Jones, T. W., O’Dell, S. L., & Stein, W. A. 1974, ApJ, 188, 353
- Just et al. (2007) Just, D. W., Brandt, W. N., Shemmer, O., Steffen, A. T., Schneider, D. P., Chartas, G., & Garmire, G. P. 2007, ApJ, 665, 1004
- Kotilainen et al. (1998) Kotilainen, J. K., Falomo, R., & Scarpa, R. 1998, A&A, 332, 503
- Landt et al. (2001) Landt, H., Padovani, P., Perlman, E. S., Giommi, P., Bignall, H., & Tzioumis, A. 2001, MNRAS, 323, 757
- Landt et al. (2006) Landt, H., Perlman, E. S., & Padovani, P. 2006, ApJ, 637, 183
- Laurent-Muehleisen et al. (1999) Laurent-Muehleisen, S. A., Kollgaard, R., Feigelson, E. D., Brinkmann, W., & Siebert, J. 1999, ApJ, 525, 127
- Laurent-Muehleisen et al. (1998) Laurent-Muehleisen, S. A., Kollgaard, R. I., Ciardullo, R., Feigelson, E. D., Brinkmann, W., & Siebert, J. 1998, ApJS, 118, 127
- Maiolino et al. (2001) Maiolino, R., Salvati, M., Marconi, A., & Antonucci, R. R. J. 2001, A&A, 375, 25
- Mannucci et al. (2001) Mannucci, F., Basile, F., Poggianti, B. M., Cimatti, A., Daddi, E., Pozzetti, L., & Vanzi, L. 2001, MNRAS, 326, 745
- Martin et al. (2005) Martin, D. C., et al. 2005, ApJ, 619, 1
- McLure & Jarvis (2002) McLure, R. J., & Jarvis, M. J. 2002, MNRAS, 337, 109
- McLure et al. (2004) McLure, R. J., Willott, C. J., Jarvis, M. J., Rawlings, S., Hill, G. J., Mitchell, E., Dunlop, J. S., & Wold, M. 2004, MNRAS, 351, 347
- Morrison & McCammon (1983) Morrison, R., & McCammon, D. 1983, ApJ, 270, 119
- Padovani (2007) Padovani, P. 2007, in The Multi-Messenger Approach to High-Energy Gamma-Ray Sources, Vol. 309 (Astrophysics and Space Science), 63
- Padovani et al. (2002) Padovani, P., Costamante, L., Ghisellini, G., Giommi, P., & Perlman, E. S. 2002, ApJ, 581, 895
- Padovani & Giommi (1995) Padovani, P., & Giommi, P. 1995, ApJ, 444, 567
- Padovani & Giommi (1996) Padovani, P., & Giommi, P. 1996, MNRAS, 279, 526
- Padovani et al. (1997) Padovani, P., Giommi, P., & Fiore, F. 1997, MmSAI, 68, 147
- Padovani et al. (2007) Padovani, P., Giommi, P., Landt, H., & Perlman, E. S. 2007, ApJ, 662, 182
- Padovani et al. (2003) Padovani, P., Perlman, E. S., Landt, H., Giommi, P., & Perri, M. 2003, ApJ, 588, 128
- Paltani & Courvoisier (1994) Paltani, S., & Courvoisier, T. J.-L. 1994, A&A, 291, 74
- Pereyra et al. (2006) Pereyra, N. A., Vanden Berk, D. E., Turnshek, D. A., Hillier, D. J., Wilhite, B. C., Kron, R. G., Schneider, D. P., & Brinkmann, J. 2006, ApJ, 642, 87
- Perlman et al. (1998) Perlman, E. S., Padovani, P., Giommi, P., Sambruna, R., Jones, L. R., Tzioumis, A., & Reynolds, J. 1998, AJ, 115, 1253
- Perlman et al. (2001) Perlman, E. S., Padovani, P., Landt, H., Stocke, J. T., Costamante, L., Rector, T., Giommi, P., & Schachter, J. F. 2001, in Blazar Demographics and Physics, ed. P. Padovani & C. M. Urry (A.S.P., San Francisco), 200
- Peterson (1997) Peterson, B. M. 1997, An Introduction to Active Galactic Nuclei (Cambridge University Press)
- Piconcelli et al. (2005) Piconcelli, E., Jimenez-Bailón, E., Guainazzi, M., Schartel, N., Rodríguez-Pascual, P. M., & Santos-Lleó, M. 2005, A&A, 432, 15
- Sambruna et al. (2006) Sambruna, R. M., Gliozzi, M., Tavecchio, F., Maraschi, L., & Foschini, L. 2006, ApJ, 652, 146
- Sambruna et al. (1996) Sambruna, R. M., Maraschi, L., & Urry, C. M. 1996, ApJ, 463, 444
- Skrutskie et al. (2006) Skrutskie, M. F., et al. 2006, AJ, 131, 1163
- Strateva et al. (2005) Strateva, I. V., Brandt, W. N., Schneider, D. P., Vanden Berk, D. G., & Vignali, C. 2005, AJ, 130, 387
- Tavecchio et al. (2002) Tavecchio, F., et al. 2002, ApJ, 575, 137
- Urry & Padovani (1995) Urry, C. M., & Padovani, P. 1995, PASP, 107, 803
- Vanden Berk et al. (2004) Vanden Berk, D. E., et al. 2004, ApJ, 601, 692
- Wilhite et al. (2005) Wilhite, B. C., Vanden Berk, D. E., Kron, R. G., Schneider, D. P., Pereyra, N., Brunner, R. J., Richards, G. T., & Brinkmann, J. V. 2005, ApJ, 633, 638
- Wolter & Celotti (2001) Wolter, A., & Celotti, A. 2001, A&A, 371, 527
| Object Name | R.A.(J2000) | Decl.(J2000) | z | log | galactic | ||||||
|---|---|---|---|---|---|---|---|---|---|---|---|
| [Jy] | [mJy] | [ cm-2] | |||||||||
| (1) | (2) | (3) | (4) | (5) | (6) | (7) | (8) | (9) | (10) | (11) | (12) |
| RGB J01123818 | 01 12 18.049 | 38 18 56.90 | 0.333 | 0.096 | 0.09 | 32.5 | 0.65 | 0.38 | 1.38 | 0.72 | 5.64 |
| RGB J02543931 | 02 54 42.629 | 39 31 34.75 | 0.291 | 0.344 | 0.31 | 160.2 | 0.24 | 0.44 | 1.39 | 0.76 | 9.54 |
| RGB J22293057 | 22 29 34.151 | 30 57 12.10 | 0.322 | 0.203 | 0.15 | 44.2 | 0.52 | 0.40 | 1.42 | 0.74 | 6.79 |
| RGB J22562618 | 22 56 39.163 | 26 18 43.55 | 0.121 | 0.208 | 0.02 | 21.4 | 0.19 | 0.43 | 1.19 | 0.69 | 5.20 |
| RGB J23183048 | 23 18 36.905 | 30 48 37.00 | 0.103 | 0.185 | 0.12 | 17.5 | 0.12 | 0.29 | 1.35 | 0.65 | 6.34 |
| WGA J01101647 | 01 10 35.516 | 16 48 27.80 | 0.781 | 0.176 | 0.35 | 72.0 | 0.22 | 0.36 | 1.35 | 0.69 | 1.62 |
| WGA J03040002 | 03 04 58.973 | 00 02 35.85 | 0.563 | 0.121 | 0.40 | 8.4 | 1.22 | 0.50 | 1.21 | 0.74 | 7.00 |
| WGA J04470322 | 04 47 54.727 | 03 22 42.20 | 0.774 | 0.348 | 0.47 | 68.0 | 2.63 | 0.32 | 1.31 | 0.66 | 4.01 |
| WGA J10266746 | 10 26 33.850 | 67 46 12.10 | 1.181 | 0.069 | 0.49 | 84.7 | 0.50 | 0.51 | 1.25 | 0.76 | 2.18 |
| WGA J23470852 | 23 47 38.144 | 08 52 46.35 | 0.292 | 0.176 | 0.58 | 8.3 | 1.30 | 0.38 | 1.34 | 0.71 | 6.02 |
Note. — Columns: (1) object name; (2) and (3) position of the radio core measured on VLA 1.4 GHz A array map; (4) redshift; (5) unabsorbed ROSAT X-ray flux density at 1 keV, calculated using an X-ray spectral index derived from hardness ratios; (6) radio spectral index between 1.4 and 5 GHz, calculated from the sum of the fluxes of all NVSS sources within a radius (corresponding roughly to the beam size of the GB6 survey) and the total flux from the GB6 and PMN surveys for northern and southern sources, respectively; (7) radio core flux density measured on VLA 1.4 GHz A array map; (8) radio core dominance parameter at 1.4 GHz, defined as , where and are the core and extended luminosities, respectively; -corrected rest-frame effective spectral indices between: (9) 5 GHz and 5000 Å, (10) 5000 Å and 1 keV, and (11) 5 GHz and 1 keV; and (12) galactic hydrogen column density from Dickey & Lockman (1990).
| Object Name | MOS 1 | MOS 2 | PN | observation | observation | ||||||
|---|---|---|---|---|---|---|---|---|---|---|---|
| tot. exp. | filt. exp. | source | tot. exp. | filt. exp. | source | tot. exp. | filt. exp. | source | ID | date | |
| [sec] | [sec] | counts | [sec] | [sec] | counts | [sec] | [sec] | counts | |||
| (1) | (2) | (3) | (4) | (5) | (6) | (7) | (8) | (9) | (10) | (11) | (12) |
| WGA J01101647 | 7506 | 3106 | 812 | 7508 | 3787 | 1004 | 7242 | 4233 | 5785 | 0203160401 | 12/17/2003 |
| WGA J03040002 | 15157 | 14638 | 939 | 15162 | 14642 | 928 | 14964 | 10432 | 2733 | 0203160201 | 07/19/2004 |
| WGA J04470322 | 7657 | 7439 | 1131 | 7662 | 7443 | 1162 | 7464 | 5238 | 3129 | 0203160101 | 03/06/2004 |
| WGA J10266746 | 9957 | 9571 | 433 | 9962 | 9576 | 412 | 9764 | 6779 | 1420 | 0203160601 | 04/19/2004 |
Note. — Columns: (1) object name; (2) total exposure time; (3) filtered live exposure time; and (4) extracted source counts for MOS 1; (5) total exposure time; (6) filtered live exposure time; and (7) extracted source counts for MOS 2; (8) total exposure time; (9) filtered live exposure time; and (10) extracted source counts for PN; (11) observation ID; and (12) observation date.
| Object Name | tot. exp. | filt. exp. | source | angle | observation | observation |
|---|---|---|---|---|---|---|
| [sec] | [sec] | counts | [deg] | ID | date | |
| (1) | (2) | (3) | (4) | (5) | (6) | (7) |
| RGB J01123818 | 16183 | 13815 | 1897 | 172 | 5641 | 10/07/2005 |
| RGB J02543931 | 10708 | 8613 | 1584 | 153 | 5638 | 10/26/2005 |
| RGB J22293057 | 10628 | 9235 | 3884 | 91 | 5639 | 05/04/2005 |
| RGB J22562618 | 9854 | 8936 | 2042 | 91 | 5642 | 05/04/2005 |
| RGB J23183048 | 11275 | 9219 | 1168 | 316 | 5643 | 01/25/2005 |
| WGA J23470852 | 16675 | 14440 | 4936 | 128 | 5640 | 08/20/2005 |
Note. — Columns: (1) object name; (2) total exposure time; (3) filtered live exposure time; (4) extracted source counts; (5) nominal roll angle; (6) observation ID; and (7) observation date.
| Object Name | /dof | F-test | ||||
|---|---|---|---|---|---|---|
| [ cm-2] | [erg s-1 cm-2] | [erg s-1 cm-2] | null prob. | |||
| (1) | (2) | (3) | (4) | (5) | (6) | (7) |
| WGA J01101647 | 1.62 fixed | 1.960.04 | 1.44e12 | 1.19e12 | 1.08/306 | |
| 0.62 | 1.88 | 1.48e12 | 1.28e12 | 1.07/305 | 0.011 | |
| WGA J03040002 | 7.00 fixed | 1.930.05 | 2.98e13 | 3.53e13 | 0.92/195 | |
| 4.90 | 1.83 | 2.96e13 | 3.75e13 | 0.90/194 | 0.019 | |
| WGA J04470322 | 4.01 fixed | 2.110.04 | 7.31e13 | 5.63e13 | 1.11/219 | |
| 1.79 | 1.97 | 7.60e13 | 6.34e13 | 1.04/218 | 7.10e05 | |
| WGA J10266746 | 2.18 fixed | 1.760.08 | 1.99e13 | 2.39e13 | 1.06/97 | |
| 0.60 | 1.68 | 2.08e13 | 2.55e13 | 1.05/96 | 0.171 |
Note. — Columns: (1) object name; (2) hydrogen column density; (3) photon index; (4) observed PN flux in the range 0.2-2.4 keV; (5) observed PN flux in the 2-10 keV range; (6) reduced and number of degrees of freedom; and (7) -test null probability quantifying the significance of the decrease due to the addition of a new parameter (free ). The errors are quoted at 90% confidence.
| Object Name | /dof | F-test | ||||
|---|---|---|---|---|---|---|
| [ cm-2] | [erg s-1 cm-2] | [erg s-1 cm-2] | null prob. | |||
| (1) | (2) | (3) | (4) | (5) | (6) | (7) |
| RGB J01123818 | 5.64 fixed | 1.890.08 | 4.49e13 | 5.44e13 | 1.07/69 | |
| 4.36e08 | 1.67 | 4.77e13 | 6.25e13 | 0.88/68 | 2.32e04 | |
| RGB J02543931 | 9.54 fixed | 1.800.08 | 5.74e13 | 8.99e13 | 0.83/62 | |
| 6.85 | 1.71 | 5.80e13 | 9.47e13 | 0.81/61 | 0.163 | |
| RGB J22293057 | 6.79 fixed | 2.040.05 | 1.39e12 | 1.40e12 | 1.31/128 | |
| 4.84e07 | 1.76 | 1.48e12 | 1.71e12 | 0.98/127 | 8.69e10 | |
| RGB J22562618 | 5.20 fixed | 1.660.06 | 7.12e13 | 1.18e12 | 1.07/77 | |
| 4.85 | 1.65 | 7.13e13 | 1.19e12 | 1.08/76 | 0.789 | |
| RGB J23183048 | 6.34 fixed | 1.670.09 | 3.93e13 | 6.70e13 | 0.78/46 | |
| 1.91 | 1.52 | 4.04e13 | 7.38e13 | 0.72/45 | 0.039 | |
| WGA J23470852 | 6.02 fixed | 1.860.04 | 1.10e12 | 1.40e12 | 1.34/147 | |
| 3.83 | 1.780.07 | 1.12e12 | 1.49e12 | 1.30/146 | 0.031 |
Note. — Columns: (1) object name; (2) hydrogen column density; (3) photon index; (4) observed ACIS flux in the range 0.3-2.4 keV; (5) observed ACIS flux in the 2-10 keV range; (6) reduced and number of degrees of freedom; and (7) -test null probability quantifying the significance of the decrease due to the addition of a new parameter (free ). The errors are quoted at 90% confidence.
| Object Name | /dof | F-test | ||||||
|---|---|---|---|---|---|---|---|---|
| [ cm-2] | [keV] | [erg s-1 cm-2] | [erg s-1 cm-2] | null prob. | ||||
| (1) | (2) | (3) | (4) | (5) | (6) | (7) | (8) | (9) |
| WGA J01101647 | 1.62 fixed | 1.970.04 | 3.00(unc.) | 6.91 | 1.43e12 | 1.68e12 | 1.03/304 | 1.29e04 |
| WGA J03040002 | 7.00 fixed | 2.07 | 1.81 | 1.26 | 2.92e13 | 3.78e13 | 0.89/193 | 0.012 |
| WGA J04470322 | 4.01 fixed | 2.28 | 1.74 | 1.62 | 7.26e13 | 7.27e13 | 0.94/217 | 9.71e09 |
| WGA J10266746 | 2.18 fixed | 1.96 | 1.66 | 0.99 | 2.02e13 | 2.61e13 | 1.05/95 | 0.246 |
Note. — Columns: (1) object name; (2) hydrogen column density; (3) soft photon index; (4) hard photon index; (5) break energy; (6) observed PN flux in the range 0.2-2.4 keV; (7) observed PN flux in the 2-10 keV range; (8) reduced and number of degrees of freedom and (9) -test null probability quantifying the significance of the decrease due to the addition of two parameters (from a single power-law fit with Galactic absorption to a broken power-law fit). The errors are quoted at 90% confidence.
| Object Name | /dof | F-test | ||||||
|---|---|---|---|---|---|---|---|---|
| [ cm-2] | [keV] | [erg s-1 cm-2] | [erg s-1 cm-2] | null prob. | ||||
| (1) | (2) | (3) | (4) | (5) | (6) | (7) | (8) | (9) |
| RGB J01123818 | 5.64 fixed | 2.57 | 1.740.09 | 0.86 | 4.72e13 | 6.18e13 | 0.82/67 | 6.89e05 |
| RGB J02543931 | 9.54 fixed | 1.97 | 1.72 | 1.17(unc.) | 5.76e13 | 9.50e13 | 0.81/60 | 0.223 |
| RGB J22293057 | 6.79 fixed | 2.31 | 1.70 | 1.50 | 1.40e12 | 1.78e12 | 1.02/126 | 3.79e08 |
| RGB J22562618 | 5.20 fixed | 1.69 | 1.59 | 2.34(unc.) | 7.10e13 | 1.22e12 | 1.09/75 | 0.775 |
| RGB J23183048 | 6.34 fixed | 1.78 | 1.00 | 3.01 | 3.91e13 | 8.72e13 | 0.65/44 | 0.007 |
| WGA J23470852 | 6.02 fixed | 1.900.05 | 0.60 | 4.64 | 1.10e12 | 1.82e12 | 1.28/145 | 0.013 |
Note. — Columns: (1) object name; (2) hydrogen column density; (3) soft photon index; (4) hard photon index; (5) break energy; (6) observed ACIS flux in the range 0.3-2.4 keV; (7) observed ACIS flux in the 2-10 keV range; (8) reduced and number of degrees of freedom and (9) -test null probability quantifying the significance of the decrease due to the addition of two parameters (from a single power-law fit with Galactic absorption to a broken power-law fit). The errors are quoted at 90% confidence.
| Object Name | 2MASS⋆⋆magnitudes from the Extended Source catalog are listed in parenthesis | APM | GALEX | ||||
|---|---|---|---|---|---|---|---|
| J | H | Ks | O | E | FUV | NUV | |
| 1.235 m | 1.622 m | 2.159 m | 4100 Å | 6500 Å | 1530 Å | 2310 Å | |
| [mag] | [mag] | [mag] | [mag] | [mag] | [mag] | [mag] | |
| (1) | (2) | (3) | (4) | (5) | (6) | (7) | (8) |
| RGB J01123818 | 15.5 | 14.6 | 13.9 | 17.3 | 16.5 | ||
| RGB J02543931 | 15.9 (16.1) | 15.3 (15.4) | 14.4 (13.9) | 16.4 | 15.4 | ||
| RGB J22293057 | 15.5 | 14.7 | 14.3 | 16.4 | 15.8 | ||
| RGB J22562618 | 15.9 (15.0) | 15.1 (13.8) | 14.6 (13.8) | 18.3 | 16.7 | 21.7 | 21.0 |
| RGB J23183048 | 15.2 (14.3) | 14.4 (13.9) | 13.9 (13.3) | 17.3 | 20.2 | 19.5 | |
| WGA J01101647 | 15.0 | 14.7 | 14.0 | 15.9 | 16.2 | 17.2 | 16.5 |
| WGA J03040002 | 16.5 | 15.9 | 15.2 | 18.4 | 19.7 | 19.1 | |
| WGA J04470322 | 14.7 | 14.5 | 13.8 | 16.3 | 16.0 | ||
| WGA J23470852 | 15.6 (15.2) | 14.8 (14.2) | 13.8 (13.5) | 17.1 | 16.2 | 18.0 | 17.7 |
| Object Name | V | B | U | UVW1 | UVM2 | observation |
|---|---|---|---|---|---|---|
| date | ||||||
| [mag] | [mag] | [mag] | [mag] | [mag] | ||
| (1) | (2) | (3) | (4) | (5) | (6) | (7) |
| WGA J01101647 | 16.420.01 | 16.6420.007 | 15.5870.006 | 15.2410.008 | 12/17/2003 | |
| WGA J03040002 | 18.760.02 | 19.040.07 | 18.070.05 | 17.750.05 | 07/19/2004 | |
| WGA J04470322 | 16.330.03 | 16.660.01 | 15.760.01 | 03/06/2004 | ||
| WGA J10266746 | 18.410.06 | 17.490.02 | 17.070.02 | 17.230.05 | 03/23/2004 | |
| 17.090.03 | 04/19/2004 |
| Object Name | FWHM | broad | ||||
|---|---|---|---|---|---|---|
| [erg/s] | [/yr] | [km/s] | line | [] | ||
| (1) | (2) | (3) | (4) | (5) | (6) | (7) |
| RGB J01123818 | 2.7e44 | 0.8 | 3144 | Mg II | 3e08 | 0.08 |
| RGB J02543931 | 1.4e44 | 0.4 | 3244 | H | 2e08 | 0.05 |
| RGB J22293057 | 2.6e44 | 0.8 | 5467 | H | 8e08 | 0.03 |
| RGB J22562618 | 6.9e42 | 0.02 | 7888 | H | 3e08 | 0.002 |
| RGB J23183048 | 5.9e42 | 0.02 | 6645 | H | 2e08 | 0.003 |
| WGA J01101647 | 1.5e45 | 5 | 3853 | Mg II | 1e09 | 0.1 |
| WGA J03040002 | 2.7e44 | 0.8 | 7404 | H | 2e09 | 0.01 |
| WGA J04470322 | 6.5e45 | 19 | 4595 | Mg II | 3e09 | 0.2 |
| WGA J10266746 | 1.1e46 | 32 | 6646 | Mg II | 8e09 | 0.1 |
| WGA J23470852 | 8.1e43 | 0.2 | 7926 | H | 9e08 | 0.005 |
Note. — Columns: (1) object name, (2) BLR luminosity, (3) accretion rate (in solar masses per year) calculated from the BLR luminosity assuming a covering factor of 10%, (4) FWHM of the broad emission line listed in (5), (6) mass of the black hole (in solar masses) calculated from the FWHM and the BLR luminosity assuming a covering factor of 10%, and (7) dimensionless accretion rate defined as , where is the accretion rate at the Eddington limit. See text for more details.