2D radiative modelling of He i spectral lines formed in solar prominences
Abstract
We present preliminary results of 2D radiative modelling of He i lines in solar prominences, using a new numerical code developed by us (Léger et al. 2007). It treats self-consistently the radiation transfer and the non-LTE statistical equilibrium of H and, in a second stage, the one of He using a detailed atomic model. Preliminary comparisons with new visible plus near-infrared observations made at high spectral resolution with THéMIS are very satisfactory.
Université de Toulouse, Laboratoire d’Astrophysique de Toulouse-Tarbes, CNRS, 14 ave. E. Belin, F-31400 Toulouse, France
1. Introduction
Multi-dimensional radiative transfer is of general interest in various domains of astrophysics. Hereafter our primary interest concerns the radiative modelling of isolated and illuminated structures in which non-LTE plasma conditions prevail: solar prominences. In particular, spectral lines of He i are commonly used for the diagnosis of magnetic fields in solar prominences. While most inversion codes, except hazel (Asensio Ramos et al. 2008), assume that spectral lines such as and 1083 nm for instance are optically thin, it is not always confirmed observationally (e.g. López Ariste & Casini 2002). We also have a good idea about conditions under which geometry effects may have an impact on the formation of moderately thick lines (Paletou 1997). In order to improve our ability to diagnose prominences using such spectroscopic data, we have thus developed a new 2D numerical radiative transfer code (Léger et al. 2007). Hereafter we present the numerical strategies we adopted and comment on the performances of this code. Finally, preliminary results of the 2D radiative modelling of He i lines and a first comparison with new observations are shown.
2. Context and state-of-the-art
Solar prominences are dense and cool structures hanging in a hot and low density corona (Tandberg-Hanssen 1995). They are often the source of CMEs, and the magnetic field very likely plays a major role in the triggering of those instabilities leading to the onset of such large solar plasma ejections (see for instance Patsourakos & Vial 2001, and references therein).
He i lines such as and 1083 nm are among the best tools for the study of magnetic fields in solar prominences. Full-Stokes observations of these spectral lines, made at THéMIS (Paletou et al. 2001) have also led to a recent revision of magnetic field inversion tools (López Ariste & Casini 2002).
The most recent radiative models (Labrosse & Gouttebroze 2001, 2004) assume 1D static slabs and no atomic fine structure for the He model-atom, leading to non-realistic gaussian synthetic triplet lines profiles. However this fine structure is conspicuous in our observations, and measurement of the ratio between the red and blue peaks of and 1083 nm are often in contradiction with the commonly assumed hypothesis of optically thin spectral lines (see López Ariste & Casini 2002).
It is therefore important to use the best numerical radiative transfer methods, in 2D geometry at least, and a detailed He i atomic model in order to improve our ability: i) to compute realistic synthetic spectral line profiles and then ii) to improve further available magnetic field inversion tools.
3. Numerical strategies
We adopted the following numerical strategies. The formal solution of the radiative transfer equation is solved in 2D using the short characteristics method of Auer & Paletou (1994). To improve convergence, we used a Gauss-Seidel iterative scheme with Successive Over-Relaxation GS/SOR for multilevel atoms (Trujillo Bueno & Fabiani Bendicho 1995; Paletou & Léger 2007). Finally we included this 2D-GS/SOR iterative scheme into a nested multigrid method (see Fabiani Bendicho et al. 1997; Léger et al. 2007).
Then, in order to synthesize He line profiles, we proceed as follows. We solve the statistical equilibrium and the radiative transfer equations for the hydrogen atom. Then the statistical equilibrium equations for the helium atom are solved consistently with the ionization equilibrium already computed for hydrogen. For the first step, we considered a plasma composed of neutral and ionized hydrogen, and neutral helium with an abundance by number fixed at .
As an illustrative example, we adopted a temperature , a gas pressure and a microturbulent velocity . The geometrical width of the slab was and its height , sampled with a 243x243 points spatial grid. We considered just 5 bound levels and the continuum for hydrogen.
| Grid size | MALI | GSM | SOR | MG |
|---|---|---|---|---|
| 163x163 | 184mn29s (156) | 120mn27s (123) | 78mn41s (84) | 31mn46s (29) |
| 243x243 | 698mn38s (259) | 417mn24s (201) | 269mn21s (130) | 65mn31s (41) |
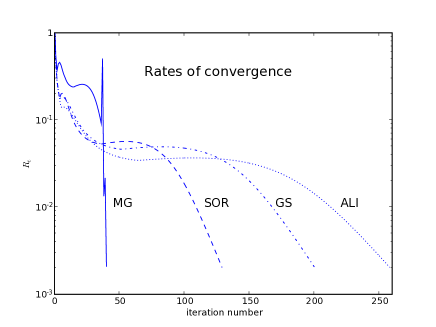
The respective rates of convergence for the ALI, Gauss-Seidel (GS), SOR and multigrid (MG) multilevel iterative processes in 2D geometry are displayed in Fig. 1 where it is plotted the maximum relative change on the populations from an iteration to another, against the number of iterations. In Tab. 1, we also provide the corresponding computing time and number of iterations for two different spatial grids.
This shows that the MG scheme is definitely superior, both in iteration numbers and computing time, against all other numerical schemes. This is especially true when the grid is more and more refined. And we ought to remind again here that grid refinement is very important for the sake of precision, as it was demonstrated by Chevallier et al. (2003).
4. 2D synthetic line profiles vs. observations.
We anticipate that more realistic models should also consider the multi-thread or spatial fine structure, as observed in prominences (see Heinzel 2007, and references therein).
Hereafter, we consider a single thread whose geometrical width and height are taken identical, , and sampled with a 123x123 grid. We also adopted five different temperatures 10 000, 12 000, 15 000, 16 000 and 17 000 K, a gas pressure and a microturbulent velocity .
Concerning the atomic models, we considered 5 bound levels and the continuum for hydrogen, but 17 bound levels (up to =3) and the continuum for helium, including the atomic fine structure for levels , and . We took explicitly into account the hydrogen pumping for UV lines and the continuum of He, and the coronal illumination for UV lines of He (Tobiska 1991).
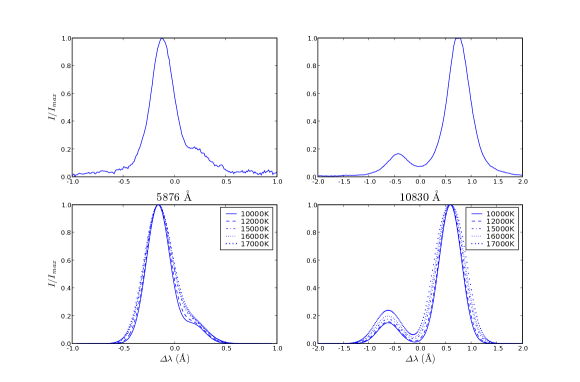
Synthetic profiles and a sample of our observations made at THéMIS in June 2007 are plotted in Fig. 2. At first glance, this preliminary comparison with observations is very promising since we are able to recover very nicely the high-resolution features of the line profiles.
5. Conclusions
We have briefly presented preliminary results of the 2D radiative modelling of He i lines in solar prominences, using a new 2D numerical radiative transfer code developed by us. So far, we favour 2D multi-thread models in order to explain a number of properties of observed He i spectral lines. A more detailed comparison with our new observations made at THéMIS, simultaneously in the visible and the near-IR, has begun. A next step will be to evaluate the impact of such a 2D radiative modelling on magnetic field inversion tools.
References
- Asensio Ramos et al. (2008) Asensio Ramos, A., Trujillo Bueno, J., & Landi Degl’Innocenti, E. 2008, arXiv:0804.2695
- Auer & Paletou (1994) Auer, L.H., & Paletou, F. 1994, A&A, 285, 675
- Chevallier et al. (2003) Chevallier, L., Paletou, F. & Rutily, B. 2003, A&A, 411, 221
- Fabiani Bendicho et al. (1997) Fabiani Bendicho, P., Trujillo Bueno, J., & Auer, L. 1997, A&A, 324, 161
- Heinzel (2007) Heinzel, P. 2007, in ASP Conf. Ser. 368, The Physics of Chromospheric Plasmas, eds. P. Heinzel, I. Dorotovi & R.J. Rutten (San Francisco: ASP), 271
- Labrosse & Gouttebroze (2001) Labrosse, N., & Gouttebroze, P. 2001, A&A, 380, 323
- Labrosse & Gouttebroze (2004) Labrosse, N., & Gouttebroze, P. 2004, ApJ, 617, 614
- Léger et al. (2007) Léger, L., Chevallier, L. & Paletou, F. 2007, A&A, 470, 1
- López Ariste & Casini (2002) López Ariste, A. & Casini, R. 2002, ApJ, 575, 529
- Paletou (1997) Paletou, F. 1997, A&A, 317, 244
- Paletou & Léger (2007) Paletou, F., & Léger, L. 2007, JQSRT, 103, 57
- Paletou et al. (2001) Paletou, F., López Ariste, A., Bommier, V., & Semel, M. 2001, A&A, 375, 39
- Patsourakos & Vial (2001) Patsourakos, S., & Vial, J.-C. 2002, Solar Phys., 208, 253
- Tandberg-Hanssen (1995) Tandberg-Hanssen, E. 1995, The Nature of Solar Prominences (Dordrecht: Kluwer)
- Tobiska (1991) Tobiska, W.K. 1991, J. Atmos. Terr. Phys., 53, 635
- Trujillo Bueno & Fabiani Bendicho (1995) Trujillo Bueno, J., & Fabiani Bendicho, P. 1995, ApJ, 455, 646