Molecular shells in IRC+10216: Evidence for non-isotropic and epsiodic mass loss enhancement
Abstract
We report high angular-resolution VLA observations of cyanopolyyne molecules HC3N and HC5N from the carbon rich circumstellar envelope of IRC+10216. The observed low-lying rotational transitions trace a much more extended emitting region than seen in previous observations at higher frequency transitions. We resolve the hollow quasi-spherical distribution of the molecular emissions into a number of clumpy shells. These molecular shells coincide spatially with dust arcs seen in deep optical images of the IRC+10216 envelope, allowing us to study for the first time the kinematics of these features. We find that the molecular and dust shells represent the same density enhancements in the envelope separated in time by 120 to 360 yrs. From the angular size and velocity spread of the shells, we estimate that each shell typically covers about 10% of the stellar surface at the time of ejection. The distribution of the shells seems to be random in space. The good spatial correspondance between HC3N and HC5N emissions is in qualitative agreement with a recent chemical model that takes into account the presence of density-enhanced shells. The broad spatial distribution of the cyanopolyyne molecules, however, would necessitate further study on their formation.
1 Introduction
Near the end of their lifes, intermediate-mass stars (1 M⊙ M∗ 8 M⊙) evolve through the asymptotic giant branch (AGB), which is characterised by copious mass loss from the stars in the form of a slow and dusty wind driven by stellar radiation pressure on dust particles. It has been commonly assumed that the mass loss from AGB stars is more or less isotropic and steady over time. Recent optical imaging (Sahai et al. 1998, Hrivnak et al. 2001, Schmidt et al. 2002), however, reveals the presence of concentric arcs and/or rings of dust in the circumstellar envelope around a number of AGB and also post-AGB stars. These studies suggest that the mass loss from AGB stars, although approximately isotropic, is modulated on a timescale of a few hundreds years. This timescale is much longer than typical stellar pulsation periods but much shorter than the interval between helium flashes. Several possibilities have been advanced to explain these arcs such as the modulation of mass loss by dust-gas coupling effect (Simis et al. 2001) or magnetic cycle (Soker 2000). A better understanding of the physical properties of these features is needed before we can draw firm conclusions on their formation mechanisms.
IRC+10216 (CW Leo) is a nearby AGB star with a high mass loss rate, estimated at 3x10⁻⁵ M⊙ yr-1. The distance to this star is estimated to be in the range 110 - 150 pc (Groenewegen 1998, Lucas & Guélin 1999). We adopt in this paper a distance of 120 pc, which is within the range of distances to give good agreement between model results and the observations of CO rotational lines (Groenewegen 1998). The combination of proximity and the high mass loss rate makes IRC+10216 one of the strongest sources molecular line emissions in the sky. Deep optical images taken by Mauron & Huggins (1999) and more recently by Leão et al. (2006) show that the dusty envelope is not smooth but consists of a series of arcs or incomplete shells. The average angular separation between the dust arcs suggests a timescale for the change in mass loss rate of order 200 to 800 yrs.
We emphasize here that the lack of kinematic information on the dust arcs precludes any firm conclusion on the real 3-dimension structure of the arcs or shells. From large scale mapping at a relatively low angular resolution ( 12 arcsec) of the CO J=10 emission from the envelope of IRC+10216, Fong et al. (2003) discovered a series of large molecular arcs or shells (at radii of 100 arcsecs) in the outer envelope. They attribute these arcs to reverberations in the envelope generated by a previous helium flash. The timescale inferred from the spacing between these arcs is about 1000 - 2000 years. In addition, they suggest that the dust arcs seen in optical images are actually projections on the plane of the sky of these molecular arcs observed in CO J=10, even though the dust arcs are found much closer (20 to 60 arcsec) to the central star.
The molecular envelope of IRC+10216 has been imaged extensively at high angular resolution (as high as 3 arcsec) using interferometers operating at 3mm wavelengths (see Lucas & Guélin 1999 for a review). The distribution of different molecules show a striking dichotomy: for the molecules originating from the inner region of the envelope, i.e SiO, CS and SiS show a compact centrally peaked distribution, whereas more complex molecules such as carbon chain molecules show hollow quasi-spherical distribution ranging from 15 to 20 arcsecs in radius (Bieging & Nguyen-Q-Rieu 1988, Bieging & Tafalla 1993, and Lucas & Guélin 1999). This morphological differences have been attributed to the active photochemistry and molecule-radical reactions in the envelope of IRC+10216 (Cherchneff et al. 1993). The presence of many different molecules distributed over a large spatial extent of the envelope has been used to probe the structure and dynamics of the envelope, but until now the observations have not had sufficient sensitivity and angular resolution to trace molecular emissions associated with the individual dust arcs or shells.
In this paper, we present observations of the cyanopolyyne molecules HC3N and HC5N from IRC+10216 obtained with the Very Large Array (VLA222The VLA is a facility of the National Radio Astronomy Observatory, which is operated by Associated Universities, Inc., under contract with the National Science Foundation). The VLA allows us to image the molecular emissions from the envelope of IRC+10216 at unprecedented angular resolution of 1.5 arcsec. Our observations reveal the presence of mutiple incomplete molecular shells and larger spatial extent of the cyanopolyyne molecules than previously seen.
2 Observation
We observed IRC+10216 (=09:47:57.38, =13:16:43.7) using the VLA in its most compact configuration (D-array) on 2004, April 12 and 13 under good weather condition. The phase center chosen in our observations coincides with the position of the central compact continuum source at 3mm in IRC+10216 (Guélin et al. 1993). This position is also consistent with the position of the central continuum source at centimeter wavelengths in IRC+10216 as measured by Drake et al. (1991) and Menten et al. (2006). The rest frequency of the HC3N J=4 line (45.490316 GHz) is taken from Lovas/NIST database (Lovas 2004). The rest frequencies of HC5N J=8 (23.963897 GHz) and J=15 (42.602171 GHz) rotational transitions are taken from JPL catalogue (Pickett et al. 1998). The VLA correlator was configured to cover a bandwidth of 6.25 MHz with a frequency resolution of 97.656 kHz over 64 channels in the two-IF mode for the HC3N J=4 line. We used the 4-IF mode to observe simultaneously the HC5N J=15 line and the nearby HC7N J=37 line with a frequency resolution of 195.313 KHz over 32 channels. We found the HC7N line too weak to image, and will not be discussed any further in this paper. For the HC5N J=98 line at 1.3cm, we used the correlator in the 4-IF mode covering a bandwidth of 3.125 MHz over 64 channels.
Nearby quasar 0854+201 was observed every 15 to 20 minutes to correct for time-dependent variations in the antennae gains. The strong quasar 1229+020 was used to correct for the shape of the antennae passband. The absolute flux scale was determined using the standard quasar 1331+305. At 7mm (43 GHz), the field of view of the antennas is approximately 60 arcsecs, comparable with the size of the emitting region. To cover the whole emitting region, we therefore used a 7-pointing (hexagonal pattern) mosaic with 20 arcsecs separation between pointings. At 1.3cm, the field of view of approximately 120 arcsec is sufficient to cover the whole emitting region. We therefore used only a single pointing for observations at 1.3cm. We edited and calibrated the visibilities using the AIPS package. We then exported the calibrated visibilities into the MIRIAD package for imaging and deconvolution. To form the mosaiced images at 7mm, we assumed the primary beam of VLA antennas to be a two-dimensional Gaussian with a FWHM of 60 arcsecs. We applied an inverse Fourier transform of the calibrated visibilities to form the mosaiced images, and then deconvolved the point spread function of the interferometer using the Steer-Dewdney-Ito clean algorithm (Steer et al. 1984). For the HC5N J=8 line at 1.3cm, we deconvolved the single-field image using the clean algorithm of Hogbom, Clark and Steer as implemented in the task CLEAN of the MIRIAD package. A summary of our observations is shown in Table. 1.
3 Results
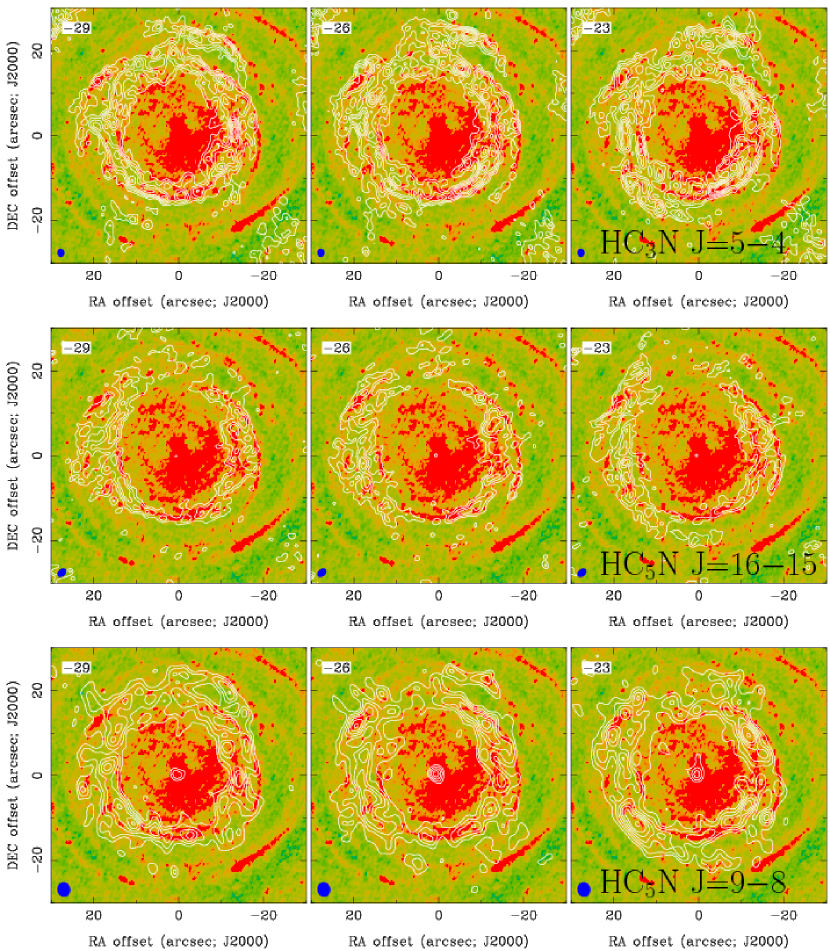
We show in Figure 1. the spatial distribution of the emissions from the HC3N J=4, HC5N J=1615 and HC5N J=98 lines in three velocity channels around the systemic velocity of VLRS=26 kms-1 together with the optical image of Leão et al. (2006), which is color-coded to highlight the presence of numerous dust arcs in the envelope of IRC+10216. Because we did not perform continuum subtraction for our data, continuum emission, which has a flux density of about 3 mJy at 1.3cm, appears at the phase center position in the HC5N J=98 channel maps at the level of 3. The central continuum source is not detectable in the HC3N J=54 and HC5N J=1615 channel maps observed at 7mm. In Figure 2 we show the total flux profiles of the observed transitions. The integration is done within the emitting region of cyanopolyynes, taking into account all pixels with flux above 2 level. The HC3N J=54 and HC5N J=1615 transitions were observed previously with the Nobeyama 45m telescope (Kawaguchi et al. 1995), which has a FWHM beam of 40 arcsec. Using the main beam efficiency provided by Kawaguchi et al. (1995) and a conversion factor of 3 Jy/K, the single dish fluxes of HC3N J=54 and HC5N J=1615 transitions at the systemic velocity are 6 Jy and 1.5 Jy, respectively. Because most of the emitting region of cyanopolyynes is within the beam of the 45m telescope, we estimate that in our VLA observations we recover most of the flux of HC3N J=54 transition and about 70% of the flux of HC5N J=1615 transition. The HC5N J=98 transition was observed by Bell et al. (1992) using the 140 foot telescope. The FWHM telescope beam at the frequency of this transition is 1′.4. Using their quoted value of the beam efficiency and a conversion factor of 3 Jy/K, the flux of the HC5N J=98 transition is about 400 mJy. By comparison with the total flux profile of this transition shown in Figure 2, we estimate that in our VLA observations we recover more than 70% of the single dish flux. We note, however, that lacking a fully sampled single dish map of the cyanopolyyne emission prevents us from estimating precisely the amount of flux recovered.
The emissions of both molecules have a clumpy and hollow quasi-spherical distribution, which is also seen previously in higher frequency transitions (Bieging & Nguyen-Q-Rieu 1989, Bieging & Tafalla 1993 and Lucas & Guélin 1999). Because HC3N is thought to form mainly from the reaction between radical CN, which is a photodissociation product of parent molecule HCN, and acetylene molecule: , while bigger cyanopolyynes are built up step by step from smaller chains, the chemical models for carbon-rich circumstellar envelopes such as IRC+10216 (Cherchneff et al. 1993, Millar & Herbst 1994, Millar et al. 2000) predict significant abundance for cyanoplyynes only in the outer part of the envelope, i.e a hollow-shell spatial distribution. That prediction is broadly consistent with our observations.
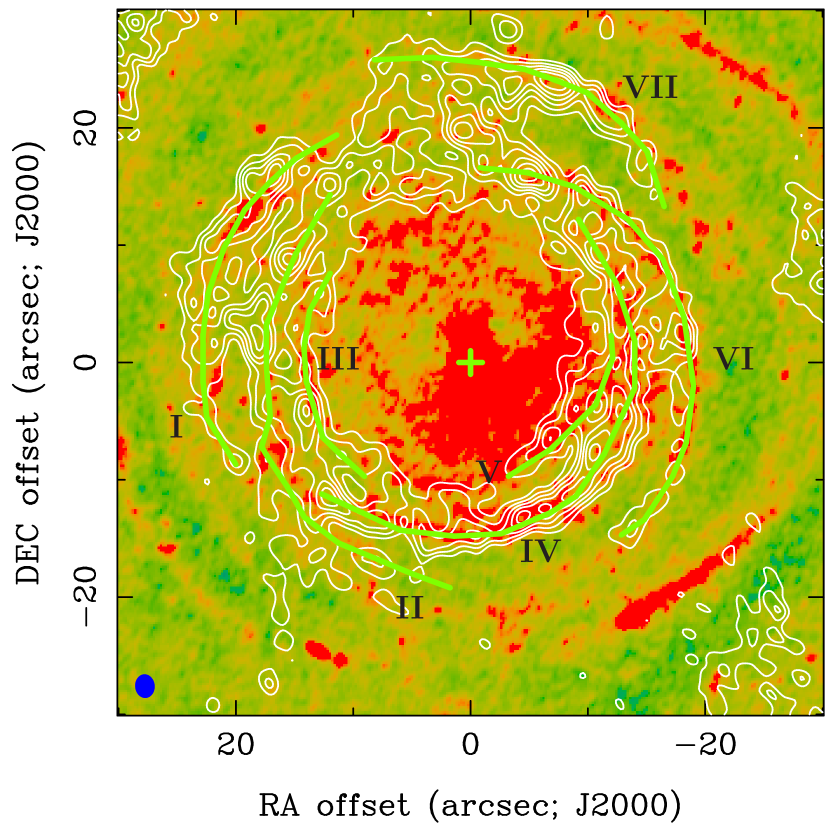
Interestingly, and for the first time, we can trace a series of arcs in the channel maps of both HC3N and HC5N around the systemic velocity of the envelope, i.e spatially located close to the plane of the sky. In Figure 3, we identify and sketch the location of seven such arcs traced by both cyanopolyyne molecules. The location of these arcs can be seen to coincide very closely with the dust arcs identified by Mauron & Huggins (1999, 2000) and more recently by Leão et al. (2006). Our observations therefore show that the arcs are physical structures in the inner envelope and not the projection on the plane of the sky of the larger molecular shells seen by Fong et al. (2003). The good spatial correspondance between molecular and dust arcs also indicates that the molecular shells observed here are not related to any peculiarities in the chemistry of the cyanopolyyne molecules but represent true density variations in the envelope of IRC+10216.
As can be seen in the channel maps, some of the molecular arcs clearly do not span the whole velocity range of the envelope, e.g arcs II and VII. Therefore, the molecular arcs represent incomplete expanding shells in the envelope of IRC+10216. We also note the shapes of the molecular shells identified in our observations are not exactly circular, (e.g most prominently shell VI in Figure. 3), as expected for spherically symmetric and expanding shells, suggesting that there might be slight variations in ejection velocity or in ejection time between different parts of the shell. Furthermore, the spacings between shells are also not regular, ranging from about 3 arcsec up to 9 arcsec. At an expansion velocity of 14.5 kms-1 (Lucas & Guélin 1999) and distance of 120 pc, the kinematic timescale between the shells is in the range 120 yrs to 360 yrs.
In Figure 4, we show the position-velocity diagram of HC3N J=54 emission nearly along the North-South direction (PA=25∘) and along the direction at position angle PA=45∘. Near the systemic velocity of 26 kms-1 there are clearly 4 shells visible in the cut at position angle PA=25∘ and 5 shells in the cut at position angle PA=45∘. For comparison purposes, we also show the expected size as a function of radial velocity, , of a shell with true radius Rshell, an expansion velocity of 14.6 kms-1, and a systemic velocity V∗. By matching the observed size to the prediction we find a radius of 25 arcsecs for shell VII and a radius of 16 arcsecs for shell VI, respectively (see Fig. 4). We estimate an angular size of 60∘ for shell VII in the line of sight direction, based on the velocity range spanned by this shell from 32 kms-1 to 18 kms-1. The angular size of the shell VII in the plane of the sky, as can be seen directly in the channel maps at the systemic velocity, is also about 60∘. Thus, the solid angle subtended by the shell VII is 1 steradian. Other shells are also found to have comparable size. As a result, provided their lateral expansion has been negligible, the shells cover roughly about 10% of the stellar surface at the time of their ejection.
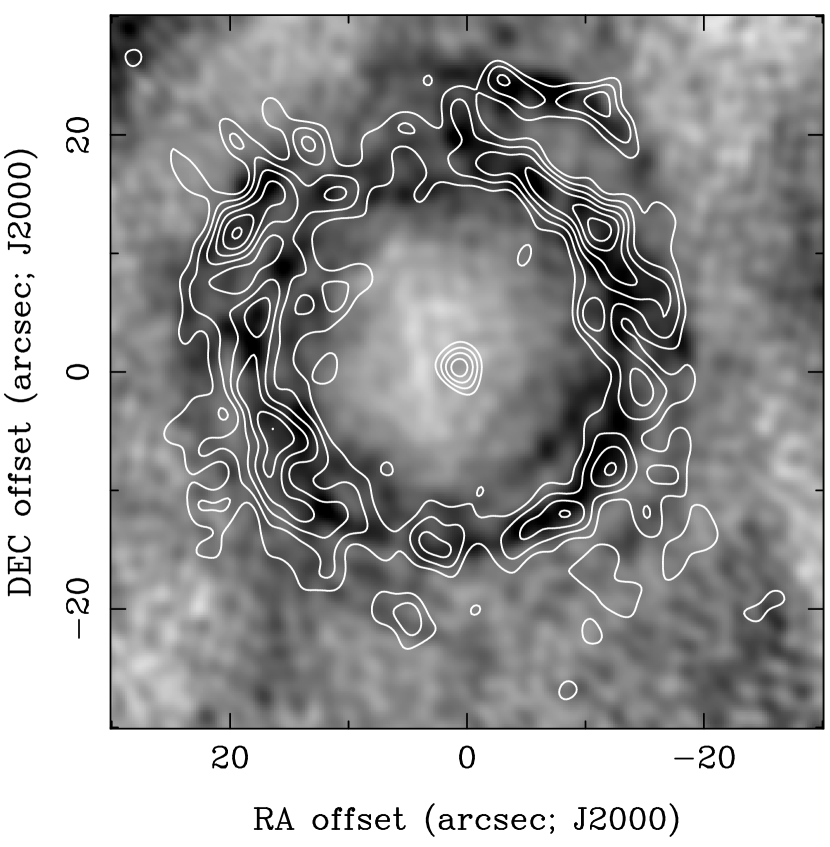
The good spatial correspondance between HC3N and HC5N, as shown in our VLA maps (see Fig. 5), has been noted earlier by Lucas & Guélin (1999) but at higher frequency transitions in the 3mm band. The latter is less radially extended and traces only the inner part of the overall hollow quasi-spherical structure, i.e shells II, IV and the northern end of VI. The higher frequency transitions are therefore excited only in the inner and denser part of the envelope and do not trace the full distribution of cyanopolyyne molecules. The shells shown in Figure 3 seem to be more concentrated on the western part of the envelope and scarce at position angles of 0∘ to 30∘ (measured counterclockwise from north). Previous observations by Guélin et al. (1993) and Lucas & Guélin (1999) also show a lack of molecular emission, interpreted as a gas density minimum in that part of the envelope. Apart from these asymmetries, the shells are distributed more or less randomly around the central star. This asymmetry results in a displacement between the centroid of the overal hollow shell-like structure and the position of the central star as previously noted in lower angular-resolution observations (Guélin et al. 1993).
4 Discussion and Conclusion
Our observations of the molecular envelope of IRC+10216 has the highest angular resolution so far achieved, and clearly establish the correspondance between dust arcs seen previously in scattered light and the molecular shells traced by the emission of cyanopolyyne molecules. These are true 3-dimension expanding features located in the inner envelope, and not projections on the plane of the sky of larger shells as suggested by Fong et al. (2003). With kinematic information, we also show that the molecular (and by implication the dusty) shells seem to occur randomly in space. Our data also provide the lower limit to the gas density variation within the envelope. If we assume that abundance of cyanopolyynes is roughly constant within the emitting region as suggested in the modelling work of Brown & Millar (2003), the density contrast between the gas in the molecular shells and the surrounding gas would correspond to the variation of the intensity of cyanopolyyne emission. A quick inspection of Figure 3 shows that the density contrast is at least a factor of a few up to 10 for the part of the envelope with strongest cyanopolyyne emission. We note that Mauron & Huggins (1998) also inferred that the gas density in the dusty shells is enhanced by up to an order of magnitude with respect to the intershell medium, similar to our rough estimate here. These shells therefore represent brief episodes of enhanced mass loss from the central star separated by irregular intervals of a few hundreds years. The similar radial distance of some shells, such as II and VII, suggest, however, that they are ejected at more or less the same time and, as a result, probably belong to the same episode of mass loss enhancement. The presence of molecular shells with significant density enhancement within the envelope of IRC+10216 is a clear evidence that the mass loss from the central AGB star is neither isotropic nor steady over time.
At the present time, it is still difficult to identify any mechanisms that can create the observed non-isotropic mass loss enhancement over intervals of time much longer than normal stellar pulsation of 649 days for IRC+10216 (Le Bertre 1992), and at the same time much shorter than the interval between helium flashes. By analogy with solar cycle, Soker (2000) suggests that the magnetic cycle of AGB stars might be responsible for the observed phenomenon. According to Soker (2000) during the active phase, magnetic cool spots (stellar spots) appear and reduce the gas temperature of the stellar atmosphere above the spots. That could enhance dust formation and thus lead to higher mass loss from magnetic cool spots. The sporadic appearance and random distribution of magnetic cool spots on the stellar surface might also explain the clumpiness seen in the dust arcs and their obviously random spatial distribution.
Our VLA observations (see Figure 5) show that the spatial distribution of cyanopolyyne molecules is very similar, even at an angular resolution of 1.5 arcsec, corresponding to a linear scale of 200 AU. The good spatial correlation between the molecular shells and the dusty arcs seen in scattered light strongly suggests a close coupling between cyanopolyyne-related chemistry and the density enhancements represented by these shells. The more recent chemical model of Brown & Millar (2003) suggests that by including explicitly the density enhancements in the envelope of IRC+10216 the chemically active region tends to narrow and the model reproduces better the observed close spatial correspondance of cyanopolyyne molecules. Thus, our observations of HC3N and HC5N are in qualitative agreement with the model of Brown & Millar (2003).
We note the presence of strong emissions of HC3N and HC5N in the outer shells, such as shell I and VII, where previously only emission from the CN radical is seen (Lucas & Guélin 1999). The CN radical, which is the photodissociation product of the parent molecule HCN, is predicted by the chemical models of Cherchneff et al. (1993) and Millar & Herbst (1994) to have the most radially extended spatial distribution, whereas the distribution of cyanopolyyne molecules is predicted to be more sharply peaked with radius and spatially much less extended than that for CN radical. Therefore, chemical models previously tailored for IRC+10216 can not account for the similarity in spatial distribution of cyanopolyyne molecules and CN radical. Clearly more sophisticated chemical models, which include explicitly the sporadic mass loss enhancement and complex envelope structure, should be explored to better understand the formation of cyanopolyyne molecules and their relation to other chemically important and very abundant molecules such as CN.
We thank the referee, Dr. A.J. Remijan, for constructive comments, which help to improve our paper. We are also grateful to Dr. I.C. Leão for providing the V-band image of IRC+10216. This research has made use of NASA’s Astrophysics Data System Bibliographic Services and the SIMBAD database, operated at CDS, Strasbourg, France.
References
- Bell et al. (1992) Bell, M.B., Feldman, P.A., Avery, L.W., 1992, ApJ 396, 643
- Bieging & Nguyen-Q-Rieu (1988) Bieging, J.H., Nguyen-Q-Rieu, 1988, ApJ 329, L107
- Bieging & Tafalla (1993) Bieging, J.H., Tafalla, M., 1993, AJ 105, 576
- Brown & Millar (2003) Brown, J.M., Millar, T.J., 2003, MNRAS 339, 1041
- Cherchneff et al. (1993) Cherchneff, I., Glassgold, A., Mamon, G., 1993, ApJ 410, 188
- Drake et al. (1991) Drake, S. A., Linsky, J. L., Judge, P. G., Elitzur, M. 1991, AJ, 101, 230
- Guélin et al. (1993) Guélin, M., Lucas, R., Cernicharo, J., 1993, A&A, 280, L19
- Hrivnak et al. (2001) Hrivnak, B.J., Kwok, S., Su, K.Y.L., 2001, AJ 121, 2775
- Kawaguchi et al. (1995) Kawaguchi, K., Kasai, Y., Ishikawa, S., Kaifu, N., 1995, PASJ 47, 853
- Leão et al. (2006) Leão, I.C., de Laverny, P., Mékarnia, D., De Medeiros, J.R., Vandame, B., 2006, A&A 455, 187
- Le Bertre (1992) Le Bertre, T., 1992, A&AS 94, 377
- Lovas (2004) Lovas, F.J., 2004, J.Phys.Chem.Ref.Data, 33, 177
- Lucas & Guélin (1999) Lucas, R., Guélin, M., 1999, IAU Symposium 191, edited by T. Le Bertre, A. Lebre and C. Waelkens, p. 305
- Mauron & Huggins (1999) Mauron, N., Huggins, P.J., 1999, A&A 349, 203
- Mauron & Huggins (2000) Mauron, N., Huggins, P.J., 2000, A&A 359, 707
- Mauron & Huggins (2006) Mauron, N., Huggins, P.J., 2006, A&A 452, 257
- Menten et al. (2006) Menten, K. M.,Reid, M. J., Krügel, E., Claussen, M. J., Sahai, R., A&A 453, 301
- Millar et al. (2000) Millar, T.J., Herbst, E., Bettens, R.P.A., 2000, MNRAS 316, 195
- Pickett et al. (1998) Pickett, H.M., Poynter, R.L., Cohen, E.A., Delitsky, M.L., Pearson, J.C., Müller, H.S.P., 1998, J. Quant. Spectrosc. Radiat. Transfer, 60, 883
- Sahai et al (1998) Sahai, R., Trauger, J.T., Watson, A.M., et al, 1998, ApJ 493, 301
- Schmidt et al. (2002) Schmidt, G.D., Hines, D.C., Swift, S., 2002, ApJ 576, 429
- Simis et al. (2001) Simis, Y.J.W., Icke, V., Dominik, C., 2001, A&A 371, 205
- Soker (2000) Soker, N., 2000, ApJ, 540, 436
- Steer et al. (1984) Steer, D.G., Dewdney, P.E., Ito, M.R., 1984, A&A 137, 159
| Line | Frequency | Obs. mode | Synthesized beam | rms (mJy/beam) |
|---|---|---|---|---|
| (GHz) | (V = 3 kms-1) | |||
| HC3N J=4 | 45.490316 | 7-field mosaic | 2.0”x1.6” PA=5∘ | 3.6 |
| HC5N J=15 | 42.602171 | 7-field mosaic | 2.4”x1.7” PA=48.6∘ | 1.4 |
| HC5N J=8 | 23.963897 | single field | 3.4”x3.1” PA=8.6∘ | 1.0 |