Quantum and classical mode softening near the charge-density-wave/superconductor transition of CuxTiSe2: Raman spectroscopic studies
Abstract
Temperature- and x-dependent Raman scattering studies of the charge density wave (CDW) amplitude modes in CuxTiSe2 show that the amplitude mode frequency exhibits identical power-law scaling with the reduced temperature, T/TCDW, and the reduced Cu content, x/xc, i.e., (1 - p)0.15 for p = T/TCDW or x/xc, suggesting that mode softening is independent of the control parameter used to approach the CDW transition. We provide evidence that x-dependent mode softening in CuxTiSe2 is caused by the reduction of the electron-phonon coupling constant due to expansion of the lattice, and that x-dependent ‘quantum’ (T 0) mode softening reveals a quantum critical point within the superconductor phase of CuxTiSe2.
pacs:
71.45.Lr, 73.43.Nq, 74.70.-b, 78.30.-jOne of the most important current goals of condensed matter physics research involves elucidating the competition between diverse and exotic phases in strongly correlated matter, such as antiferromagnetism and superconductivity (SC) in the high Tc cuprates,1 heavy fermions,2 and cobaltates,3 and charge density wave (CDW) order and SC in materials such as NaxTaS2.4 Recently, Morosan et al. discovered an interesting new material exhibiting a competition between CDW order and SC: copper intercalated 1-TiSe2, i.e., CuxTiSe2.5 1-TiSe2 is a semimetal or small-gap semiconductor in the normal state,6 ; 7 ; 8 ; 9 which develops a commensurate CDW with a 2ao2ao2co superlattice structure at temperatures below a second-order phase transition at TCDW 200 K.6 ; 10 Increasing Cu intercalation in TiSe2 (increasing x in CuxTiSe2) results in (i) an expansion of the a- and c-axis lattice parameters,5 (ii) increased electronic density of states near the L point,7 ; 8 (iii) a suppression of the CDW transition temperature,5 and (iv) the emergence near x = 0.04 of a SC phase having a maximum Tc of 4.15 K at x = 0.08.5
The CuxTiSe2 system provides an ideal opportunity to investigate the microscopic details of quantum (T 0) phase transitions between CDW order and SC. It is of particular interest to clarify the nature of the “soft mode” in CDW/SC transitions: the behavior of the soft mode - i.e., the phonon mode whose eigenvector mimics the CDW lattice distortion, and hence whose frequency tends towards zero at the second-order phase transition - is one of the most fundamental and well-studied phenomena associated with classical (thermally driven) displacive phase transitions;11 on the other hand, soft mode behavior associated with quantum phase transitions is not well understood. In this investigation, we use Raman scattering to study the temperature- and doping-dependent evolution of the CDW ‘amplitude’ modes in CuxTiSe2. The CDW amplitude mode 12 - which is associated with collective transverse fluctuations of the CDW order parameter - offers detailed information regarding the evolution and stability of the CDW state and the CDW soft mode. In this study, we show that the amplitude mode frequency in CuxTiSe2 exhibits identical power-law scaling with the reduced temperature, T/TCDW, and the reduced Cu content, x/xc, indicating that mode softening in CuxTiSe2 is independent of the control parameter used to approach the CDW transition. Further, we show that ‘quantum’ (T 0) softening of the CDW amplitude mode is consistent with a quantum critical point hidden in the superconductor phase of CuxTiSe2, suggesting a possible connection between quantum criticality and superconductivity.
Raman scattering measurements were performed on high quality single-crystal and pressed-pellet samples of CuxTiSe2 for x = 0, 0.01, 0.02, 0.03, 0.04, 0.05, and 0.06, which were grown and characterized as described previously.5 ; 13 Fig. 1(a) shows the T = 6 K Raman spectra of CuxTiSe2 for various Cu concentrations (x). The T = 6 K Raman spectrum of TiSe2 (top spectrum in Fig. 1) exhibits several spectroscopic features that have been reported previously,14 ; 15 including a Raman-active k = 0 phonon mode near 137 cm-1 that shows little change in energy ( 0.7%), and only a slight increase in linewidth, with increasing x. Also apparent in Fig. 1(a) are several modes that appear below the CDW transition, including an A1g-symmetry amplitude mode near 118 cm-1, which arises from fluctuations of the CDW amplitude that preserve the ground state 222 CDW structure, and an Eg-symmetry amplitude mode near 79 cm-1.14 ; 15 These CDW amplitude modes are associated with the soft zone boundary TA phonon at the L-point,14 ; 15 which is folded to the zone center when the unit cell is doubled below TCDW.16
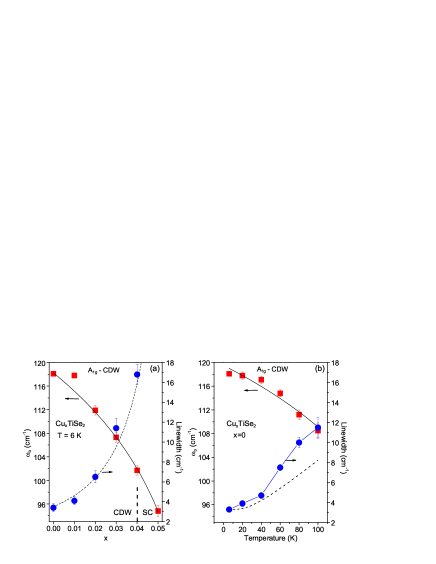
Fig. 2 summarizes the A1g amplitude mode frequency (squares) and linewidth (circles) in CuxTiSe2 as functions of (a) Cu concentration, x (for T = 6 K) and (b) temperature (for x = 0). The A1g amplitude mode frequency and linewidth data were extracted from Lorentzian fits to the data, as illustrated for some select spectra in Fig. 1. Because the A1g amplitude mode (dashed lines, Fig. 1) is in most cases well-separated from, or much broader and stronger than, nearby optical modes (dotted lines, Fig. 1), estimated errors in the amplitude mode frequency obtained in this manner were 1%. Fig. 2(b) illustrates that the A1g amplitude mode of CuxTiSe2 exhibits temperature-dependent soft mode behavior typical of amplitude modes observed in other CDW systems,[17,18] including: (i) a temperature-dependence (filled squares, Fig. 2(b)) given by the power law form (T) (1 - T/TCDW)β with 0.15 (solid line, Fig. 2(b)), (ii) a weakening of the amplitude mode intensity as the CDW lattice loses coherence as T TCDW, and (iii) a dramatic increase in linewidth with increasing temperature (filled circles, Fig. 2(b)); the latter mainly reflects overdamping of the amplitude mode due to an increase in CDW fluctuations, as it is in substantial excess of the broadening expected from anharmonic (i.e., two-phonon) contributions (dashed line, Fig. 2(b)). The anomalous temperature dependence of the 118 cm-1 A1g amplitude mode in CuxTiSe2 confirms that its eigenvector couples strongly to the lattice distortion responsible for the CDW transition at TCDW, and thus mimics the collapse of the soft mode and the CDW gap as T TCDW.
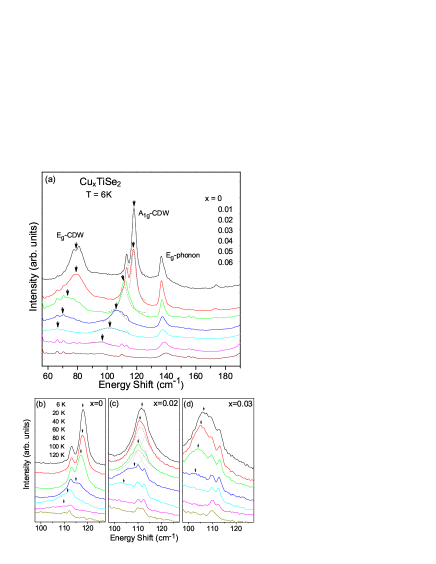
Significantly, Fig. 1(a) shows that both the 79 cm-1 Eg and 118 cm-1 A1g amplitude modes in CuxTiSe2 also exhibit x-dependent mode softening that has nearly identical characteristics to temperature-dependent mode softening in CuxTiSe2. For example, Fig. 2(a) shows that the A1g amplitude mode softens by 18% between x = 0 and x = 0.05 at T = 6 K (solid squares), and exhibits a 400% increase in linewidth between x = 0 and x = 0.04 at T = 6 K (solid circles). Note that the dramatic x-dependent increase in the T = 6 K amplitude mode linewidths (filled circles, Fig. 2(a)) cannot be attributed to the effects of disorder (e.g., inhomogeneous broadening caused by Cu substitution), as there is not a comparably large increase in the other phonon linewidths with increasing x. Rather, x-dependent damping of the CDW amplitude modes in CuxTiSe2 reflects a dramatic enhancement of CDW fluctuations - and a loss of CDW coherence - with increasing x. A microscopic analysis of the nature and origin of x-dependent mode softening in CuxTiSe2 (see Fig. 2(a)) can be made using Rice and collaborators mean-field result for the frequency of a CDW amplitude mode,12
| (1) |
which has been successfully applied to the analysis of CDW soft mode behavior in other dichalcogenides.17 In Eq. 1, is the unscreened (high temperature) phonon frequency, t = (TCDW-T)/TCDW is the reduced temperature, and = N(0)g2(0)/ is the electron-phonon coupling constant associated with the CDW, where g(0) is the electron-phonon coupling matrix element between the soft mode phonon and the electronic states at the Fermi surface involved in the CDW transition, and N(0) is the joint density of states of the electrons and holes involved in the CDW transition.17 Note that the unscreened frequency in Eq. (1) is not expected to have a significant doping dependence between x = 0 and x = 0.06 in CuxTiSe2, which is supported by the fact that the optical phonon frequencies exhibit a negligible change with x (e.g., see 137 cm-1 mode in Fig. 1). Consequently, Eq. 1 suggests that the x-dependent softening of the A1g amplitude mode in CuxTiSe2 is associated with a substantial reduction in the electron-phonon coupling constant with doping in CuxTiSe2. One possible source of this reduction is a decrease in the density of electrons/holes participating in the CDW transition between x = 0 and x = 0.05 in CuxTiSe2, N(0). Indeed, Morosan et al. observed a 50% decrease in the size of the magnetic susceptibility drop below TCDW between x = 0 and x = 0.05 in CuxTiSe2, indicating that fewer electronic states are gapped at the CDW transition with increasing x.5 Importantly, however, this reduction in N(0) is not likely associated with a loss of Fermi surface nesting with increasing x, because ARPES studies of CuxTiSe2 have shown that nesting actually increases with doping.7 Another possibility is that the primary effect of Cu intercalation on the CDW phase is caused by the linear expansion of the a-axis parameter with Cu intercalation in CuxTiSe2,5 which leads to a reduction in by expanding the Ti-Se bond length primarily responsible for the CDW instability in 1-TiSe2.6 ; 16 ; 19 Notably, this alternative is consistent with Castro Neto’s proposal that the layered dichalcogenides have a critical lattice spacing above which CDW order is suppressed.20
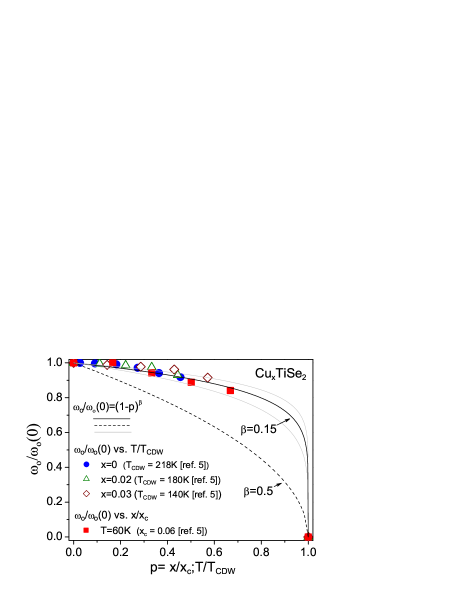
Remarkably, Fig. 3 shows that, in spite of the different microscopic effects of doping (x) and temperature on the lattice, x-dependent and thermal mode softening in CuxTiSe2 exhibit essentially identical scaling behavior. In particular, Fig. 3 compares the following data sets: (i) the normalized A1g amplitude mode frequency /(0) vs. the reduced doping x/xc for T = 60 K (using xc = 0.06 from ref. 5) (filled squares); and (ii) the normalized A1g amplitude mode frequency /(0) vs. the reduced temperature T/TCDW for x = 0 (using TCDW = 218 K from ref. 5) (filled circles), x = 0.02 (TCDW=180K 5 ) (open triangles), and x = 0.03 (TCDW=140K 5 ) (open diamonds) (similar results are obtained from the Eg amplitude mode frequency). The solid line in Fig. 3 shows that all these data sets collapse onto the same curve given by /(0) = (1 - p)β, with p = x/xc or T/TCDW and 0.15. An estimated uncertainty of = 0.05 in the “best fit” value of 0.15 is suggested by the gray lines in Fig. 3, which show the functional form /(0) = (1 - p)β for both = 0.20 (bottom gray line) and = 0.10 (top gray line).
Two key points should be made regarding Fig. 3: First, although we cannot measure the amplitude mode frequency with temperature (doping) all the way to the critical point TCDW (xc), for reasons described above, we can nevertheless extract a reliable value for the scaling parameter from fits to these data in Fig. 3 because we know the values of TCDW (for all x) and xc (at T = 60 K) from ref. 5. Second, we note that the scaling parameter 0.15 obtained from our amplitude mode data is substantially smaller than the value of 1/2 suggested by the mean-field model of Eq. 1.12 However, the scaling parameter of 0.15 in CuxTiSe2 is consistent with the critical exponent for the order parameter in the 2D three-state Potts model, = 0.133;21 this model—which has the same symmetry as the free energy used by McMillan for the layered dichalcogenides14 —is appropriate for CuxTiSe2 because of the 3 commensurate CDWs in this material.6 ; 11
The ‘universal’ scaling of the CuxTiSe2 amplitude mode as functions of both T/TCDW and x/xc in Fig. 3 emphasizes that x-dependent mode softening - like more conventional thermal mode softening - is associated with a critical point at xc that drives both critical softening behavior ( 0) and overdamping of the amplitude mode as x xc. Indeed, the x-dependent amplitude mode softening data between 0 T 100 K, which are summarized in Fig. 4, suggest the presence of a CDW phase boundary line xc(T) in CuxTiSe2 that extends from the phase boundary line established by Morosan et al.5 down to a quantum (T0) critical point. To obtain quantitative estimates of xc(T) in CuxTiSe2 from our data, the vs x curves in Fig. 4 were fit using the same functional form as that used to fit the x-dependent data at T = 60 K in Fig. 3, i.e., (x)= (0)(1 - x/xc)β with 0.15, where (0) is the x = 0 value of the A1g amplitude mode frequency at a particular temperature. Note that the quantities contributing to the prefactor, (0), should not have a significant x-dependence: the reduced temperature factor in Eq. (1) varies less than 5% between x = 0 and x = 0.06, and the unscreened frequency in Eq. (1) is not expected to have a significant doping dependence in CuxTiSe2 for reasons described above. Additionally, in obtaining estimates of xc(T) from our data, we assume that the scaling parameter 0.15 obtained from fits to the T = 60 K data in Fig. 3 doesn’t vary significantly for the vs x curves at the other temperatures shown in Fig. 4 - this assumption is justified by the wide range of vs. T and vs. x curves that scale according the power law form (1 - p)0.15 in Fig. 3 (p = T/TCDW or x/xc), and by theoretical predictions for the critical exponent expected for the order parameter in a 2D system with a three-fold degenerate ground state, = 0.133.11 ; 21 . Thus, the resulting fits of the data in Fig. 4 (solid lines) have only xc(T) as an unconstrained parameter. The estimates of T(xc) obtained from the fits in Fig. 4 are represented by the filled circles in the inset of Fig. 4; also shown for comparison are previous measurements of T(xc) (open circles) by Morosan et al.5 The reasonableness of our T(xc) estimates is supported by two self-consistency checks: First, our estimates of xc(T) provide good fits of the x-dependent A1g amplitude mode linewidths using the functional form, (T) (xc(T) - x)-γ, as illustrated by the dashed line in Fig. 2(a) for 2; and second, our estimated value for xc(T = 80 K) overlaps with the known phase boundary line from Morosan et al.5
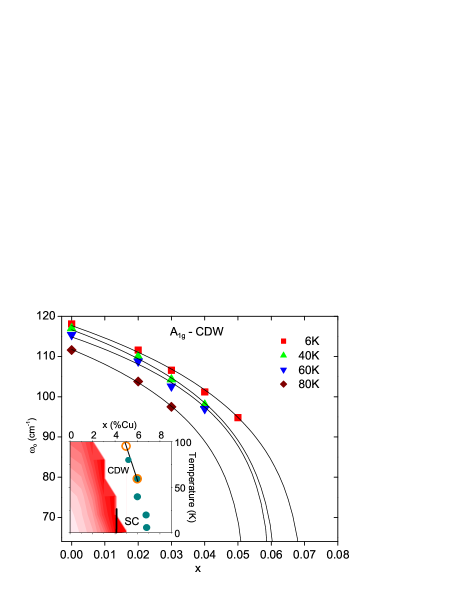
The values of T(xc) estimated from our x-dependent mode softening results in Fig. 4 are consistent with a low temperature CDW phase boundary in CuxTiSe2 that extends from the phase boundary line measured by Morosan et al.5 down to a quantum critical point at roughly xc(T = 0) 0.07. This suggests that SC and fluctuating CDW order coexist in the doping range x 0.04 - 0.07 of CuxTiSe2. Furthermore, this result suggests that the CuxTiSe2 phase diagram is consistent with the T vs. lattice parameter phase diagram plotted by Castro Neto for the layered dichalcogenides, in which there are two quantum critical points as a function of increasing lattice parameter: superconductivity (SC) and CDW order coexist above the lower of the two critical lattice parameters, while SC is present, but CDW order is not, above the higher of the two critical lattice parameters.20 We note, however, that because the amplitude mode becomes overdamped and unobservable very close to the transition region - due to the breakdown of long-range CDW order and zone-folding 17 ; 18 - we cannot rule out the possibility that other effects, e.g., disorder from Cu intercalation, may lead to different quantum critical behavior (i.e., for T 0 and near x 0.07) than that implied by the x-dependent scaling behavior we observe up to x = 0.05 in Fig. 4. Consequently, it would be useful to study the putative transition region xc(T = 0) 0.07 with methods more sensitive to short-range, fluctuating CDW order, such as inelastic x-ray or neutron scattering. It is nevertheless interesting that the value of the quantum critical point xc(T = 0) 0.07 estimated from our x-dependent mode softening data is close to the peak in Tc(x), suggesting a possible connection between SC and the presence of fluctuating CDW order in CuxTiSe2. Indeed, the inset of Fig. 4 also shows a contour plot of the temperature and x-dependent A1g amplitude mode linewidth, , which ranges from light red ( 3 cm-1) to dark red ( 17 cm-1), illustrating the dramatic increase of CDW fluctuations as the phase boundary is approached with increasing x and/or temperature. Another indirect connection between quantum critical behavior and the expansion of the lattice in CuxTiSe2 is also suggested by the fact that pressure studies of 1-TiSe2 14 don’t show evidence for pressure-induced T0 softening of the A1g amplitude mode that would indicate the presence of a quantum critical point; this suggests that pressure (lattice compression) and Cu intercalation (lattice expansion) have fundamentally different effects on the quantum phases of 1-TiSe2.
This material is based on work supported by the U.S. Department of Energy, Division of Materials Sciences, under Award Nos. DE-FG02-07ER46453 and DE-FG02-98-ER45706. We would like to acknowledge A. Castro Neto and M. V. Klein for useful comments.
References
- (1)
- (2) M. Imada, A. Fujimori, and Y. Tokura, Rev. Mod. Phys. 70, 1039 (1998).
- (3) N.D. Mathur et al., Nature (London) 394, 39 (1998).
- (4) K. Takada et al., Nature 422, 53, (2003).
- (5) L. Fang et al., Phys. Rev. B 72, 14534 (2005).
- (6) E. Morosan et al., Nature Phys. 2, 544 (2006).
- (7) F.J. DiSalvo, D.E. Moncton, J.V. Waszczak, Phys. Rev. B 14, 4321 (1976).
- (8) D. Qian et al., Phys. Rev. Lett. 98, 117007 (2007).
- (9) J. F. Zhao et al.., cond-mat/0612091 (2007).
- (10) G. Li et al., cond-mat/0703167 (2007).
- (11) M. Holt et al., Phys. Rev. Lett. 86, 3799 (2001).
- (12) W. L. McMillan, Phys. Rev. B 12, 1187 (1975); G. Gruner, Density Waves in Solids, Perseus Publishing, Cambridge, Massachusetts, 1994; G. Shirane, Rev. Mod. Phys. 46, 437 (1974).
- (13) M.J. Rice and S. Strassler, Solid State Commun. 13, 1931 (1974); P.A. Lee, T.M. Rice, and P.W. Anderson, Solid State Commun. 14, 703 (1974).
- (14) E. Morosan et al., Phys. Rev. B 75, 104505 (2007).
- (15) C.S. Snow et al., Phys. Rev. Lett. 91, 136402 (2003).
- (16) J.A. Holy, K.C. Woo, M.V. Klein, and F.C. Brown, Phys. Rev. B 16, 3628 (1977).
- (17) N. Wakabayashi et al., Sol. St. Commun. 28, 923 (1978); S.S. Jaswal, Phys. Rev. B 20, 5297 (1979).
- (18) J.C. Tsang, J.E. Smith, and M.W. Shafer, Phys. Rev. Lett. 37, 1407 (1976); G. Travaglini, I. Mörke, and P. Wachter, Sol. St. Commun. 45, 289 (1983); W.K. Lee et al., Phys. Rev. B 37, 6442 (1988).
- (19) W.K. Lee et al., Phys. Rev. B 37, 6442 (1988).
- (20) A. Zunger and A.J. Freeman, Phys. Rev. Lett. 40, 1155 (1978).
- (21) A.H. Castro Neto, Phys. Rev. Lett. 86, 4382 (2001).
- (22) R. J. Baxter, Exactly Solved Models in Statistical Mechanics, Academic Press, New York, (1982).