The H Halo Distribution of 10 Nearby Planetary Nebulae based on the SHASSA Imaging Data
Abstract
Here we present initial results of our search for extensive halos around the planetary nebulae (PNe) in our Galaxy based on imaging data from the Southern H-Alpha Sky Survey Atlas (SHASSA). A threshold surface brightness in H emission was used to help identify the spatially extended features of the PNe. We investigated a sample that included 10 PNe, the large majority of which were found to be surrounded by extensive outer halos. The formation of these halos might be closely related to the AGB phase mass loss and/or the interaction of the stellar outflows with the interstellar medium. Most of these outer halos are nearly spherical. Close investigation of some specific objects, such as He 2-111 and NGC 3242, indicate a kinematic age on the order of 105 yrs. The mass loss history can be traced back to the late AGB phase of the evolution of the progenitors. Two objects form the sample (He 2-111, NGC 3242), were found to have outer halos with fragmented arcs that are apparently the result of their interaction with the interstellar medium.
keywords:
ISM: general , Stars: AGB , Planetary Nebulae: Individual (NGC 2438 , NGC 3242 , NGC 7293)PACS:
97.10.Bt , 98.62.Ai , 98.62.Mw1 Introduction
Planetary nebulae (PNe) represent one of the most interesting dynamical phenomena in astrophysics related to the final stage of low-mass stellar evolution. Kwok et al. (1978) suggested that the formation of these many-faceted structures, characterized by strong emission of H, [NII] and [OIII], is the direct result of the interaction of a fast wind originating from the nucleus with a slow wind originatng from the asymptotic giant branch (AGB) phase of evolution of the progenitor. Magnetic fields, on the other hand, could also play an important role in shaping the various asymmetric structures of the PNe (Blackman et al. 2001).
It is also widely acknowledged that the planetary nebula (PN) is a result of an important phase of low-mass stellar evolution that contributes to the recycling of the interstellar medium (ISM). It is therefore of great assistance to our study of the origin of PNe to study the history of mass loss during the AGB phase and to make a systematic census of spatially extended halo structures around the PNe. Jewitt et al. (1986) performed deep exposures of 44 PNe in a H survey. They found that about two thirds of the observed PNe possessed extended outer halos. Chu et al. (1987) later showed that about one-half of their sample of 126 PNe had H halo structures. However, since H emission from these spatially extensive halos are intrinsically diffuse and weak, it is highly desirable to carry out wide-field surveys with greater sensitivity. The release of the Southern H-Alpha Sky Survey Atlas (SHASSA: http://amundsen.swarthmore.edu/SHASSA/) (Gaustad et al. 2001) thus offers us a great opportunity to conduct a more extensive survey of PNe halos. Here we present the results based on this comprehensive data set. The rest of the paper is organized as follow: In section 2 we describe the control sample observations. A concise description of the SHASSA project is presented in section 3. This is followed by a detailed discussion of some objects in section 4, followed by a general discussion in section 5. The main results are summarized in section 6.
2 Observations and data reduction
We performed deep narrow-band imaging of one of the sources in our sample, NGC 2438, to study its halo structures in detail. The initial mapping of the PN was done by Chu et al. in 1987, but the new generation of telescopes makes it easier to resolve the halo structure. Our image was compared to the SHASSA survey image. This process serves to test the quality and reliability of the SHASSA census of PNe outer halos.
Narrow-band observations were carried out from 2003 to 2005 with the 1 m telescope (LOT) at the Lulin Observatory in central Taiwan. A FLI IMG 1024S 1024 1024 pixel CCD and a Princeton Instruments 1340 1300 pixel CCD with a pixel scale of 0.62 pixel-1 were used. The resultant fields of view were 10′ 10′ and 11′ 11′, respectively. Narrow-band images of NGC 2438 were taken using a H filter ( = 6563 Å, = 30 Å) with a total exposure time of 16 hr. Flat fields were obtained at the beginning of the night. The seeing conditions during the observations ranged between 1.2 and 2.4. A summary of the observations is shown in Table 1.
Data reduction included bias and dark current correction, cosmic ray removal, and flat-fielding, utilizing the standard procedures in the NOAO IRAF (Ver. 2.12) package. The LOT image was overlaid on the SHASSA map. The ccmap and ccsetwcs tasks in IRAF were used to find the coordinate information.
3 The SHASSA survey
The SHASSA data were obtained from a wide-angle H survey of the southern celestial hemisphere using the robotic El Enano telescope located at the Cerro Tololo Inter-American Observatory (CTIO) in Chile (Gaustad et al. 1999; McCullough et al. 1999). The El Enano telescope has an aperture size of 52 mm, a focal ratio of f/1.6, and a physical scale of 0′.8 pixel-1. The field of view is about 13 ∘ 13∘. The narrow-band images were taken through a H filter with a bandpass of 3 nm. The emission continuum was obtained using the interference filter with a bandpass of 6 nm on each side of the H.
The exposures were taken in dithered mode to eliminate the ghosts of bright stars, the effects of cosmic ray hits, and other pixels of abnormal response. Background subtraction and median combination were used to process the frames. Each co-added image had an angular extension of roughly 13∘ 13∘. According to Gaustad et al. (2001), some residues of bright H sources could still be left behind after continuum subtraction with appropriate scaling. The sensitivity of the archived SHASSA images were about 0.5 rayleighs (R). One rayleigh is equivalent to /4 photons , corresponding to an emission measure of about 2 pc.
Continuum-subtracted images were obtained from the SHASSA archive. The point spread function (PSF) could vary from image to image due to differences in times of observation or color of the stellar sources. It is a big challenge to remove stars from the image without damaging the extended halo structures around the PNe. We removed residual stellar sources by performing linear interpolation of an annulus around the source with a 4 rejection. This led to striking improvement in the contrast between the extensive halos and the sky background. Saturated sources, on the other hand, had to be treated with a special procedure. Their bleeding spikes can interfere with the extended halo structure of the target PNe, and affect the measurement of their spatial size.
4 Results and analysis
We focused on a subset of 10 well-known PNe in the SHASSA data set. Each had an angular size of greater than 47 and a distance of 1.2 kpc. If extended features surrounding each target matched the following criteria, they were taken as bona-fide PNe halos: (1) surface brightness (SB) must be 10 - 103 times fainter than the peak emission of the main nebula; (2) there was extensive H emission with an intensity above 8 that of the background level; (3) appear as patches or filaments likely in physical association with the central PNe; and (4) the spatial extension of the halo is at least 1.6 times larger than the apparent main nebula. It turned out that the great majority of the sample PNe are surrounded by diffuse H halos. To ascertain the extent of halo structures, and to determine their physical scale, we compared the SB profiles of the target sources with the average PSF of at least 10 nearby stars with similar brightness. To improve the contrast between the bright rim and the faint halo, we normalized the SB profile for each PNe to the peak emission of the rim along particular directions. Table 2 shows the sequence number of the target sources, the designation, the coordinates (J 2000.0), the diameter of the apparent main nebula, previous estimates of the halo sizes if available, and comments about some specific PNe.
An important factor related to the dynamic evolution of the PNe is the kinematic age of the halo. The edge of the halo seems to indicate the location of the last thermal pulse in the AGB phase; the kinematic age of the halo can be estimated from this event occurred. Here the kinematic age (thalo) is obtained from the halo size, the expansion velocity (Vexp), and the adopted distance (D), all of which are available in the literature. Due to the fact that historical measurements of the expansion velocity of the halos are far from complete, we assume an expansion velocity of 15 km s-1, which is the best estimate for the stellar wind that occurs at the end of the AGB phase of the evolution of low-mass stars (Habing et al. 1994). Table 3 presents the above mentioned information and the kinematic ages of the PNe in our study. A few of them (e.g., He 2-111, NGC 3242 and NGC 7293) have large kinematic ages and are therefore of particular interest.
4.1 NGC 2438
The high quality deep H images from the LOT observations (Fig. 1a) provide us with a good opportunity to investigate in detail NGC 2438 and its associated halo structures. Fig. 1a shows the bright, circular structure (hereafter called the rim) which forms the main nebula of NGC 2438. It has a radius of about 25 . It is noteworthy that the central star does not lie at the geometric center of the main nebula. There is a second circular structure with an apparent ridge of H emission at its edge (hereafter called the inner halo). It can easily be seen in our deep exposure image. Existing surveys have already confirmed this nebula’s extensive halo (Balick 1987; Chu et al. 1987; Schwarz et al. 1992; Manchado et al. 1996; Corradi et al. 2000; Corradi et al. 2003). Our deep imaging, however, discloses the existence of a third faint but distinct structure (hereafter called the outer halo). This faint halo is also a circular (as delineated by the sharp edge in the emission). It is most prominent between P.A. = -20 ∘ and P.A. = -160 ∘. The existence of multiple halo structures hints at an episodic or periodic mass loss history for NGC 2438.
The DAOPHOT package of IRAF was used to carry out linear interpolation of the annulus around each stellar source (with a 3 rejection) so as to remove all field stars from the image. The SB profiles derived from the cleaned image yield an the angular radii of the rim, inner and outer halos of 25 (Fig. 1b), 67 and 125 (Fig. 1c), respectively. As shown in Fig. 1c, the distinct halos have a relative SB of 10-1 and 3 10-2, respectively. Baessgen & Grewing (1989) found a size of 104 for the halo of NGC 2438. Our analysis of the LOT data, however, resulted in a considerably larger angular scale of 250, which is in agreement with Corradi et al.’s (2000) measurement of the order of 230. At a distance of 1 kpc (Corradi et al. 2000), the angular distances of the inner and outer halos were 67 and 125, corresponding to physical radii of 0.33 pc and 0.6 pc, respectively. Chu & Jacoby (1989) gave an expansion velocity of about 15 km s-1 from the halo, which leads to an estimated lifetime of 2.12 104 yr and 3.95 104 yr, respectively.
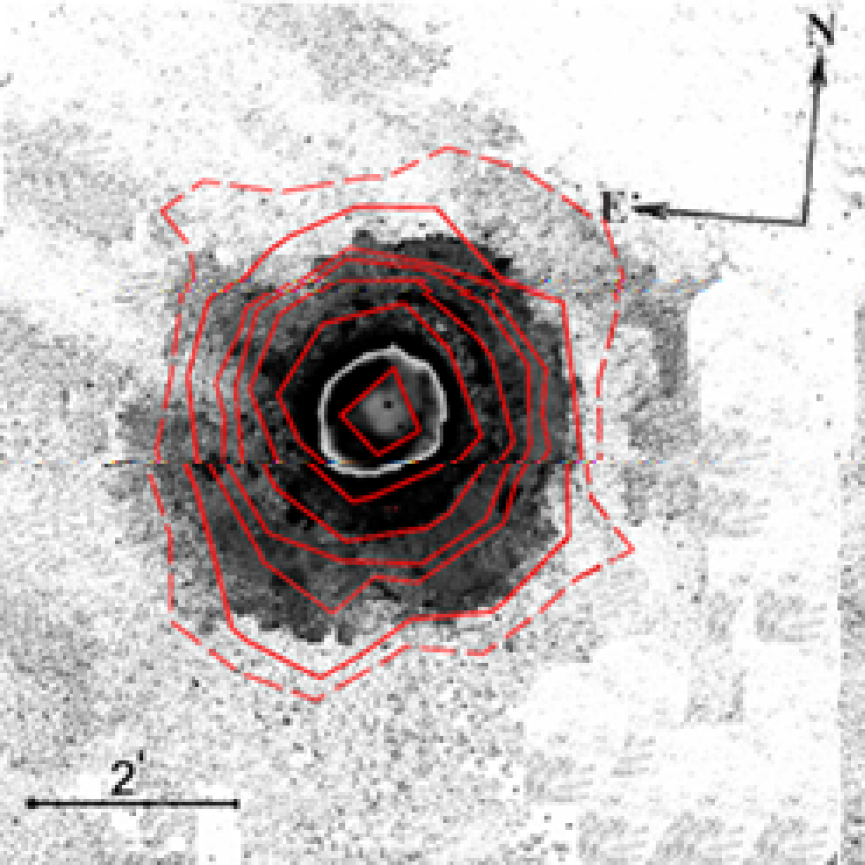
Figure 2 shows the SHASSA contours (starting from 8 of the background level) overlaid onto the cleaned LOT image. The deep exposure image of NGC 2438 confirms the existence of an extensive outer halo to the PN as well as the validity of this search of the SHASSA data for extensive halos within a reasonable distance around PNe.
4.2 He 2-111
Webster (1978) identified He 2-111 as one of the most unusual of the PNe, because of the pair of high velocity lobe-like structures (with an angular size of about 26 10), on either side of the bright nebular core; PK 315-0.1 (Perek, 1967).
The SB profile of He 2-111 (along the bipolar direction with P.A. = 144 ∘), and the average PSF of 10 nearby stars with similar brightness, are shown in Fig. 3a. At an angular resolution of 0′.8 pixel-1, the FWHM of the target source is 107. In comparison, the average FWHM of the nearby field stars with similar brightness is 55. This confirms the existence of extensive emission in association with the excitation source of He 2-111. To guarantee that only the detection of bona fide halo structures are detected, we must take a threshold background level of 8 in this case which head to an estimated radius of the halo of He 2-111 of 340 .
As shown in Figs. 3b and 3c, the extended halo associated with He 2-111 is elongated and the configuration is in alignment with the bipolar distribution of the nebula. The SHASSA image of the nebula indeed indicates enhanced H emission at the tips of the bipolar lobes. This suggests interaction with the surrounding ISM. If a distance of 1.2 kpc (Phillips 2002) is adopted, the physical scale of the halo would be about 3.96 pc. When an expansion velocity of 15 km s-1 (Habing et al. 1994) is assumed, the kinematic age of He 2-111 is estimated to be 1.3 105 yrs.
4.3 NGC 3242
It was Deeming (1966) who first identified the faint arc-like filament, about 10 ′ long, southwest of NGC 3242. Kaftan-Kassim (1966) argued that this arc structure is likely in physical association with the PN based on 1400 MHz radio mapping of NGC 3242. Later, images from the Palomar Sky Survey (POSS) (see Figure 4c) suggested that the arc-like filament was merely a portion of an elliptical halo (with a spatial extension of about 18 ′ 24 ′) (Bond 1981).
Figure 4a shows a comparison of the SB profile of the excitation source of NGC 3242 along P.A. = 173 ∘ and the average PSF of 10 nearby field stars with similar brightness. The FWHM of NGC 3242 was 106 and that of the field stars 70. This confirmed the extensive nature of NGC 3242. Our study of the SHASSA survey, however, shows the halo of NGC 3242 to be much more extensive 36.7 ′ (see Figs. 4b and 4c), that is about 4.48 pc in scale for a distance of 420 pc (Hajian et al. 1995). Our analysis of the SHASSA data showed NGC 3242 to have a larger halo than that found by Corradi et al. (2003), who found a halo size of 33 ′. The implication is that isotropic mass outflow from the progenitor has rammed into clumpy ISM, residing predominantly in the south-west of the PN, which produced the swept-up appearance of this object. This outflow was less disturbed in other directions. The fine structures displayed are likely a result of some kind of instability in the dissipation of the halo. The arc structures indicate a displacement in radial velocity of 16 km s-1, as compared to the systematic velocity of NGC 3242 (Meaburn et al. 2000). The estimated kinematic age of NGC 3242 is thus about 1.37 105 yrs, which places its origin firmly into the AGB phase of the evolution of the progenitor.
4.4 Helix Nebula (NGC 7293)
The peculiar optical appearance at the Helix Nebula (NGC 7293; PK 36-57.1) makes it among the most well known of the bipolar PNe. Its close proximity, a distance of 213 pc away (Harris et al. 1997), and its large angular size 10′ (Pottasch 1984), make it most suitable case for a study of the spatial distribution and kinematics of the multiple envelopes of evolved PNe.
Figure 5a. shows a plot of the SB profile of the Helix Nebula along P.A. = 122 ∘ and the average PSF of 10 surrounding stars of similar brightness. When the angular resolution is 0′.8 pixel-1, the FWHM of NGC 7293 is 595, nearly an order of magnitude larger than the value of 71 obtained for the field stars of similar brightness. Chu et al. (1987) gave an estimated optical diameter of 24.3′ for the Helix Nebula. Young et al. (1999), on the other hand, gave an angular size of 16.7′ for the molecular envelope of the nebula. Based on the SHASSA survey images, however, we found the halo size to be as much as 44.3′, a factor of two larger than those obtained previously (see Figs. 5b and 5c). At a distance of 213 pc (Harris et al. 1997), the physical scale of the halo is 2.74 pc. The kinematic age of the Helix Nebula is estimated to be 8.95 104 yrs, if the expansion velocity of the halo is 15 km s-1 (Habing et al. 1994).
5 Discussion
5.1 Surface brightness
Figures. 6a-11a show the SB profiles for 6 other well-observed PNe (IC 4406, NGC 2818, NGC 2899, NGC 5189, NGC 6072, NGC 6302) along different P.A.. Figs 6b-11b show the contours of their corresponding SHASSA H images overlaid on the DSS II red plate images. An examination of the histograms of the SB distribution of the halos relative to the peak emission of each PN shows that in the majority of the extensive halos detected, the relative SB is less than 10-1. One exception is He 2-111, which has a relative SB of 2 10-1. According to Villaver (2001), the enhanced emission at the tip of the bipolar lobes of He 2-111 can be attributed to their interaction with the ISM.
5.2 Properties of the AGB halos
In our sample the large majority of the extensive halos surrounding the PNe are well-defined in shape and on a physical scale of up to a few parsecs. Their largely smooth and isotropic distribution indicates that they most likely experienced a similar mass loss history during the AGB phase of evolution. However, some PNe, such as NGC 3242 (Fig. 4) and He 2-111 (Fig. 3), have bow-shocked and/or filamentary halo structures. High resolution HST imaging reveals that the central regions of the proto-planetary nebulae (PPNe) show bipolar symmetry (Kwok et al. 2000). This hints at a change in the mode of the mass loss of these objects, either at the end of their AGB evolution or in the early PPNe phase. The shaping process could be a result from external torque caused by the emergence of magnetic fields, or perhaps due to a close binary origin of the central source producing a strong outgoing wind, as suggested by the studies of Hb 12 (Hsia et al. 2006), MyCn 18 (Bryce et al. 1997), and Red Rectangle Nebula (Van Winckel et al. 1995).
Table 2 shows that our PNe halo sizes are much larger than those previously estimated. The presence of extended halos indicates that the progenitors of the PNe were subjected to extensive episodes of mass loss during their AGB evolutionary phase.
Assuming a spherical geometry, we could compute the kinematic ages of the ionized halos from the apparent size, distance, and expansion velocity (Guerrero et al. 1998) available in the literature. The derived kinematic age of the ionized halos agrees well with the timescale of the AGB phase of the evolution of the progenitors.
5.3 Interaction of PNe with ISM
The interaction of PNe with the ISM was first described by Gurzadyan (1969) and later discussed in more detail by Smith (1976). In the past three decades, there have been extensive studies on the process of mass loss by which PNe supply material to the ISM (e.g., Balick 1987; Frank & Mellema 1994; Mellema 1993). Dgani & Soker (1998) suggested that the morphology of interacting PNe may be a result of Rayleigh-Taylor (RT) instability, resulting in fragmentation at the halos of the PNe. The magnetic field could play an important role in this interaction (Tweedy et al. 1995; Soker & Dgani 1997; Zucker & Soker 1997), and should not be ignored in the analysis (Soker & Dgani 1997).
According to Tweedy & Kwitter (1996) and Dgani & Soker (1998), the interaction of the PNe with the ISM has the following distinct characteristics: (1) the outer regions of the nebulae are asymmetric; (2) there is flux enhancement in the outer regions of the nebula accompanied by a drop in the ionization level; (3) there is fragmentation of the halo or the presence of filamentary arcs. Sources were selected from the sample such as He 2-111, and NGC 3242 as probable candidates showing the interaction of the PNe. Some of the impressive morphological features of these objects are revealed for the first time. For example in Figure 3 we see He 2-111 shows a pair of bipolar structures and, in Figure 4 (NGC 3242) we see a prominent arc-like structure; both are typical features of interacting PNe.
6 Summary
Our investigation of a sample of 10 known PNe, taken primarily from SHASSA data, has led to the following results:
-
1.
The large majority of objects in our sample were found to be surrounded by extensive outer halos that likely originated from AGB phase mass loss. Some of the sample sources, such as He 2-111 and NGC 3242, had outer halos with prominent arcs and/or filamentary structures, suggesting apparent interaction with the ISM.
-
2.
Most of the outer halos were isotropic. Close investigation of some specific objects (He 2-111, and NGC 3242) indicate that they had a kinematic age on the order of 105 yrs. This allows us to trace the mass loss history back to the late AGB phase of the evolution of the progenitors.
Acknowledgments
This work is based on an exploration of the Southern H-Alpha Sky Survey Atlas (SHASSA), which was financially supported by the National Science Foundation, USA. We are grateful to Jing-Yao Hu at the National Astronomical Observatory of the Chinese Academy of Sciences for his useful comments and discussions. This project is partially supported by the ”National Science Council of Taiwan under NSC 94-2752-M-008-001-PAE, and NSC 94-2112-M-008-002”, and by the ”Aim for the Top University Program” of the Ministry of Education, Taiwan. Finally, we acknowledge funding from the National Natural Science Foundation of China through grant 10503006.
References
- [1] Baessgen, M., & Grewing, M., 1989, A&A 218, 273
- [2] Balick, B., 1987, AJ, 94 671
- [3] Blackman, E. G., Frank, A., Markiel, J. A., Thomas, J. H. & Van Horn, H. M., 2001, Nature 409, 485
- [4] Bond, H. E., 1981, PASP 93, 429
- [5] Bryce, M., Lpez, J. A., Holloway, A. J., & Meaburn, J., 1997, ApJ L487, 161
- [6] Chu, Y. H., Jacoby, G. H., & Arendt, R. ,1987, ApJS 64, 529
- [7] Chu, Y. H., & Jacoby, G. H., 1989, in IAU Symp. 131, Planetary Nebulae, ed. S. Torres-Peimbert (Dordrecht: Kluwer), 198
- [8] Corradi, R. L. M., Schnberner, D., Steffen, M., & Perinotto M. ,2000, A&A 354, 1071
- [9] Corradi, R. L. M., Schnberner, D., Steffen, M., & Perinotto, M., 2003, MNRAS 340, 417
- [10] Deeming, T. J., 1966, ApJ 146, 287
- [11] Dgani, R., & Soker, N., 1998, ApJ 495, 337
- [12] Frank, A., & Mellama, G., 1994, ApJ 430, 800
- [13] Gaustad, J. E., Rosing, W., McCullough, P. R., & Van Buren, D. , 1999, in IAU Symp. 190, New Views of the Magellanic Clouds, ed. Y.-H. Chu, N. Suntzeff, J. Hesser, & D. Bohlender (San Francisco: ASP), 99
- [14] Gaustad, J. E., McCullough, P. R., Rosing, W., & Van Buren, D. ,2001, PASP 113, 1326
- [15] Grny, S. K., Schwarz, H. E., Corradi, R. L. M., & Van Winckel, H., 1999, A&AS 136, 145
- [16] Guerrero M. A., Villaver E., & Manchado A., 1998, ApJ 507, 889
- [17] Gurzadyan, G. A., 1969, Planetary Nebulae (New York: Gordon & Breach)
- [18] Habing, H. J., Tignon, J., & Tielens, A. G. G. M., 1994, A&A 286, 523
- [19] Hajian, A. R., Terzian, Y., Bignell, C., 1995, AJ 109, 2600
- [20] Harris, H. C., Dahn, C. C., Monet, D. G., & Pier, J. R., 1997, in IAU Symp. 180, ed. H. J. Habing & H. J. G. L. M. Lamers (Dordrecht: Kluwer), 40
- [21] Hsia, C. H., Ip, W. H., & Li, J. Z., 2006, AJ 131, 3040
- [22] Jewitt, D. C., Danielson, G. E., & Kuperfman, P. N. ,1986, ApJ 302, 727
- [23] Kaftan-Kassim, May A., 1966, ApJ 145, 658
- [24] Kwok, S., Purton, C. R., & Fitzgerald, P. M. ,1978, ApJ L219, 125
- [25] Kwok, S., Hrivnak, B. J., & Su, K. Y. L., 2000, ApJ L544, 149
- [26] Manchado, A., Guerrero, M., Stanghellini, L., & Serra-Ricart, M., 1996, The IAC Morphological Catalog of Northern Galactic Planetary Nebulae (Tenerife: IAC)
- [27] McCullough, P. R., Gausted, J. E., Rosing, W., & Van Buren, D. ,1999, in ASP Conf. Ser. 181, Microwave Foregrounds, ed. A. de Oliveira-Costa &M. Tegmark (San Francisco: ASP), 253
- [28] Meaburn, J., Lpez, J. A., & Noriega-Crespo, A., 2000, ApJS 128, 321
- [29] Mellema, G., 1993, Ph.D. thesis, Univ. Leiden
- [30] Perek, K., 1967, Catalogue of Galactic Planetary Nebulae, Academia Publishing House of the Czechoslovak Academy of Sciences
- [31] Phillips, J. P. ,2002, ApJS 139, 199
- [32] Pottasch, S. R., 1984, in Planetary Nebulae, 107, Astrophysics and Space Science Library, (Reidel: Dordrecht), p. 218
- [33] Schwarz, H. E., Corradi, R. L. M., & Melnick, J., 1992, A&A 96, 23
- [34] Smith, H., 1976, MNRAS 175, 419
- [35] Soker, N., & Dgani, R., 1997, ApJ 484, 277
- [36] Tweedy, R. W., 1995, in Asymmetrical Planetary Nebulae, ed. A. Harpaz & N. Soker, Ann. Israel Phys. Soc., 11 (Jerusalem: Israel Phys. Soc.), 219
- [37] Tweedy, R. W., & Kwitter, K. B., 1996, ApJS 107, 255
- [38] Van Winckel, H., Waelkens, C., & Waters, L. B. F. M., 1995, A&A 293L, 25
- [39] Villaver, E., 2001, PhD thesis, University of La Laguna, Spain
- [40] Webster, B. L., 1978, MNRAS 185, 45
- [41] Young, K., Cox, P., Huggins, P. J., Forveille, T., & Bachiller, R., 1999, ApJ 522, 387
- [42] Zucker, D. B., & Soker, N., 1997, MNRAS 289, 665
| Observation Date | Exposure Time (s) | Number of Exposures | Seeing () | Duration (hr) |
|---|---|---|---|---|
| 2003 Mar. 4 | 300 | 21 | 1.4 | 1.75 |
| 2003 Mar. 8 | 300 | 34 | 1.2 1.8 | 2.8 |
| 2003 Mar. 12 | 300 | 26 | 1.2 1.7 | 2.17 |
| 2003 Mar. 13 | 300 | 13 | 1.5 | 1.08 |
| 2005 Jan. 11 | 600 | 21 | 1.4 1.9 | 3.5 |
| 2005 Jan. 12 | 600 | 18 | 1.5 2 | 3 |
| 2005 Jan. 14 | 600 | 9 | 1.5 2.4 | 1.5 |
| Number | Object | RA (J 2000.0) | DEC (J 2000.0) | Main Nebula () | Previous Halo Size () | Halo Size () | Note |
|---|---|---|---|---|---|---|---|
| 1 | NGC 7293 | 22 29 38.6 | -20 50 13.6 | 1460a | 1350e | 2660 | |
| 2 | NGC 2438 | 07 41 51.4 | -14 43 54.9 | 152c | 104b, 226e | 250 | 2 |
| 3 | NGC 3242 | 10 24 46.1 | -18 38 32.6 | 47a | 150b , 194 e | 2200 | 1 |
| 4 | NGC 2818 | 09 16 01.7 | -36 37 38.8 | 123 55d | – | 288 | |
| 5 | NGC 2899 | 09 27 03.1 | -56 06 21.2 | 140 69d | – | 238 | |
| 6 | NGC 5189 | 13 33 33.0 | -65 58 26.7 | 185 152d | – | 302 | |
| 7 | He 2-111 | 14 33 18.4 | -60 49 35.0 | 143 76d | – | 680 | 1 |
| 8 | IC 4406 | 14 22 26.3 | -44 09 04.4 | 103c | – | 282 | |
| 9 | NGC 6072 | 16 12 58.1 | -36 13 46.1 | 145c | – | 246 | |
| 10 | NGC 6302 | 17 13 44.2 | -37 06 15.9 | 155c | – | 278 |
-
(1) Known interaction with ISM
-
(2) 2nd halo
-
(a) Chu et al. 1987
-
(b) Baessgen & Grewing 1989
-
(c) Schwarz et al. 1992
-
(d) Grny et al. 1999
-
(e) Corradi et al. 2003
| Number | Object | l , b | Da (kpc) | Halo Size (′) | Vexpb (km s-1) | thalo ( 10-4 yrs) | Note |
|---|---|---|---|---|---|---|---|
| 1 | NGC 7293 | 036.1-57.1 | 0.213c | 44.34 | 15 | 8.95 | |
| 2 | NGC 2438 | 231.8+04.1 | 1d | 2.23 | 15e | 2.12 | inner halo |
| 4.17 | 15e | 3.95 | outer halo | ||||
| 3 | NGC 3242 | 261.0+32.0 | 0.42f | 36.67 | 16g | 13.7 | |
| 4 | NGC 2818 | 261.9+08.5 | 1.14 | 4.8 | 15 | 5.19 | |
| 5 | NGC 2899 | 277.1-03.8 | 0.69 | 3.96 | 15 | 2.6 | |
| 6 | NGC 5189 | 307.2-03.4 | 0.33 | 5.04 | 15 | 1.58 | |
| 7 | He 2-111 | 315.0-00.3 | 1.2 | 11.34 | 15 | 12.9 | |
| 8 | IC 4406 | 319.6+15.7 | 0.79 | 4.7 | 15 | 3.52 | |
| 9 | NGC 6072 | 342.2+10.8 | 0.57 | 4.1 | 15 | 2.22 | |
| 10 | NGC 6302 | 349.5+01.1 | 0.21 | 4.64 | 15 | 0.93 |
-
(a) Phillips, J. P. 2002
-
(b) Habing et al. 1994
-
(c) Harris et al. 1997
-
(d) Corradi et al. 2000
-
(e) Chu & Jacoby 1989
-
(f) Hajian et al. 1995
-
(g) Meaburn et al. 2000