A populous intermediate-age open cluster and evidence of an embedded cluster among the FSR globular cluster candidates
Abstract
We study the nature of the globular cluster (GC) candidates FSR 1603 and FSR 1755 selected from the catalogue of Froebrich, Scholz & Raftery (2007). Their properties are investigated with 2MASS field-star decontaminated photometry, which is used to build colour-magnitude diagrams (CMDs), and stellar radial density profiles (RDPs). FSR 1603 has the open cluster (OC) Ruprecht 101 as optical counterpart, and we show it to be a massive intermediate age cluster (IAC). Relevant parameters of FSR 1603 are the age Gyr, distance from the Sun kpc, Galactocentric distance kpc, core radius pc, mass function slope , observed stellar mass (for stars with mass in the range ) , and a total (extrapolated to ) stellar mass . FSR 1755, on the other hand, is not a populous cluster. It may be a sparse young cluster embedded in the H II region Sh2-3, subject to an absorption , located at kpc. Important field-star contamination, spatially-variable heavy dust obscuration, even in , and gas emission characterise its field. A nearly vertical, sparse blue stellar sequence shows up in the CMDs.
keywords:
(Galaxy:) open clusters and associations; Galaxy: structure1 Introduction
A catalogue containing 1021 star cluster candidates for Galactic latitudes and all longitudes was recently published by Froebrich, Scholz & Raftery (2007). Their targets (hereafter FSR objects) were detected by means of an automated algorithm that basically identified regions with stellar overdensities, applied to the 2MASS111The Two Micron All Sky Survey, available at www.ipac.caltech.edu/2mass/releases/allsky/ database. The overdensities were classified according to a quality flag, ’0’ and ’1’ representing the most probable star clusters, while the ’5’ and ’6’ flags may be related to field fluctuations.
By means of a combination of three parameters, the number of cluster stars corrected to a common magnitude limit, the core radius and the central star density, Froebrich, Scholz & Raftery (2007) could discriminate known GCs from OCs. When applied to the catalogue, this criterion led them to classify 1012 targets as OC candidates and 9 as GC candidates that should be explored in followup studies. Among the latter are FSR 1603 and FSR 1755.
Several works have already explored the FSR catalogue with varying depths and different approaches, with results that reflect the importance of such catalogue. The recently discovered GCs FSR 1735 (Froebrich, Meusinger & Scholz 2007) and FSR 1767 (Bonatto et al. 2007), and the probable GCs FSR 584 (Bica et al. 2007) and FSR 190 (Froebrich, Meusinger & Davis 2007), are clear examples of the fundamental rôle played by the FSR catalogue to improve the statistics of very old star clusters. Indeed, FSR 1735 and FSR 1767 are the most recent additions to the Galactic GC population, a number that presently amounts to members (e.g. Bonatto & Bica 2007c).
Besides the obvious importance of finding new star clusters of any age throughout the Milky Way, the identification of the IACs FSR 31, FSR 89 and FSR 1744, projected towards the centre of the Galaxy (Bonatto & Bica 2007a), has provided as well important information on cluster disruption processes and survival rates in those regions. In this context, derivation of astrophysical parameters of new star clusters can be used in studies related to the star formation and evolution processes, dynamics of N-body systems, cluster disruption time scales, the geometry of the Galaxy, among others.
Central to the problem of identifying the nature of catalogue stellar overdensities is the availability of a field-star decontamination algorithm to disentangle physical CMD sequences from field fluctuations. Low-noise stellar radial-density profiles (RDPs) spanning a wide radial range are essential as well, especially for objects projected against dense stellar fields (e.g. Bonatto & Bica 2007b). For instance, based on such premises and working with the decontamination algorithm described in Bonatto & Bica (2007b) applied to 2MASS photometry, Bonatto & Bica (2007a) found that the GC candidate FSR 89 is rather a well-defined IAC.
Most of the FSR catalogue remains to be further explored. As another step in the direction of classifying FSR candidates — taking into account CMD and RDP properties — we show in the present work that the candidates FSR 1603 and FSR 1755 are not GCs. Instead, FSR 1603 is a massive IAC projected from the centre of the Galaxy, and FSR 1755 is an embedded cluster from the centre.
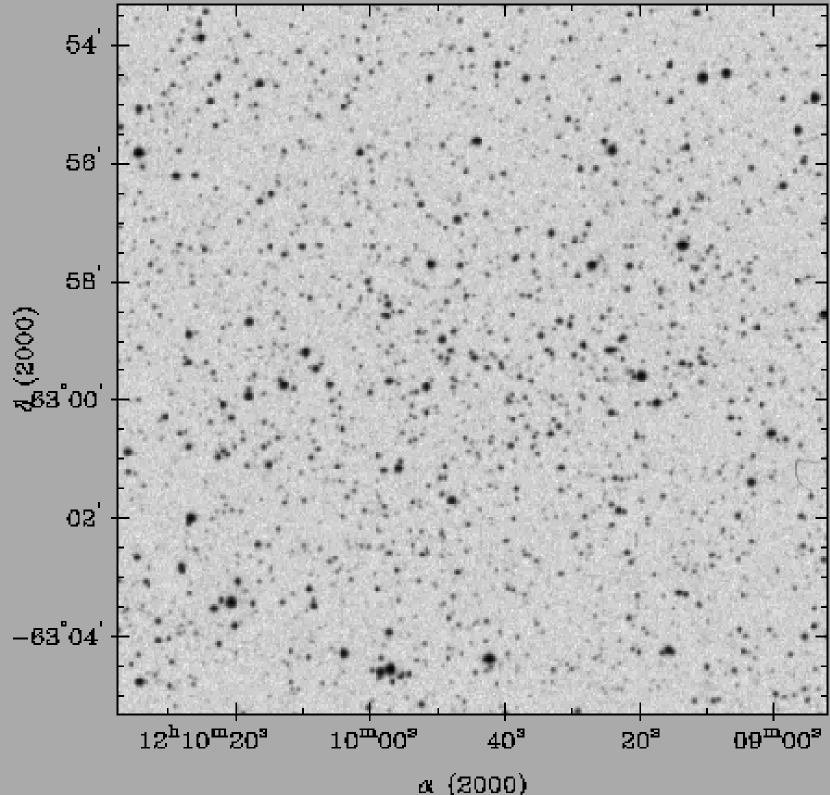
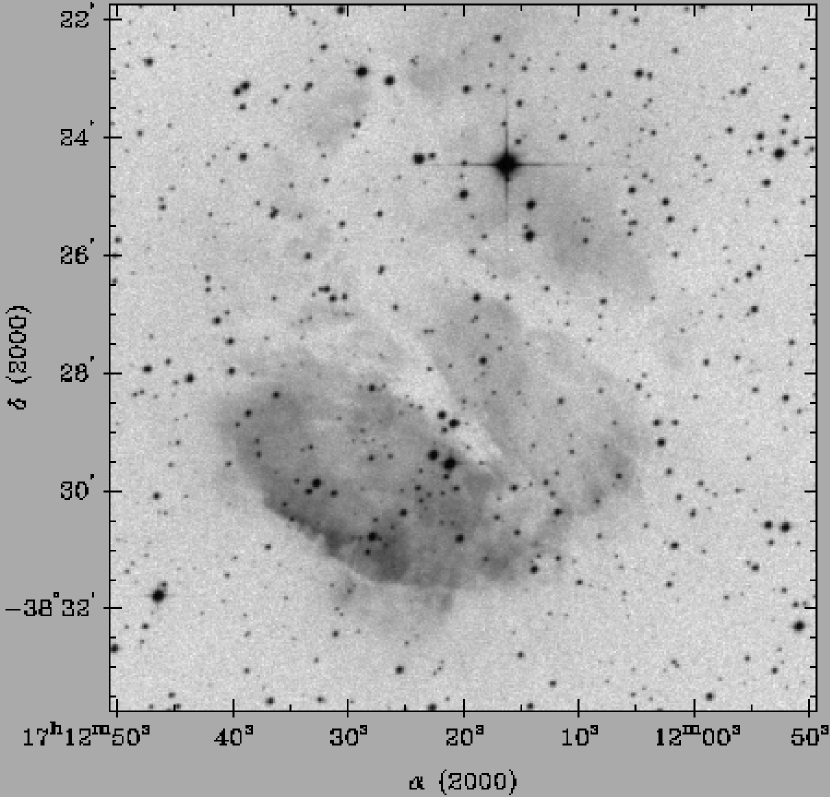
This paper is structured as follows. In Sect. 2 we present fundamental data and optical and near-IR images of FSR 1603 and FSR 1755. In Sect. 3 we present the 2MASS photometry and discuss the methods employed in the CMD analyses, especially the field-star decontamination and the stellar radial density profiles. In Sect. 4 we apply the tools to both candidates and discuss their nature. Concluding remarks are given in Sect. 5.
2 The GC candidates FSR 1603 and FSR 1755
Table 1 provides original information on FSR 1603 and FSR 1755, where we also include the core and tidal radii measured by Froebrich, Scholz & Raftery (2007) in the 2MASS images by means of a King (1962) profile fit. Both candidates have been classified as probable star clusters by Froebrich, Scholz & Raftery (2007); the quality flags are also given. The different quality flags of FSR 1603 and FSR 1755 can be accounted for by the significantly different numbers of prospective cluster members computed by Froebrich, Scholz & Raftery (2007), which we include in the last column of Table 1.
FSR 1603 has the OC Ruprecht 101 as optical counterpart, for which the coordinates are the only data provided by the WEBDA222obswww.unige.ch/webda - Mermilliod (1996) database. The relatively low contrast of FSR 1603 with respect to the background can be seen in the DSS333Extracted from the Canadian Astronomy Data Centre (CADC), at http://cadcwww.dao.nrc.ca/ B image (Fig. 1, left panel). Nevertheless, a few bright stars appear to stand out around the image centre over a rather uniform stellar background.
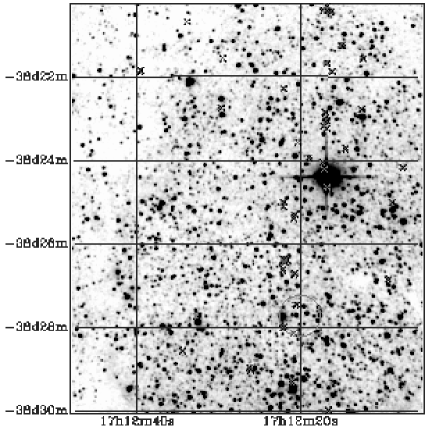
The field of FSR 1755, on the other hand, presents a complex structure that includes important contamination by bulge stars, strong absorption by dust lanes and emission, clearly seen in the XDSS R image (Fig. 1, left panel). These features show up as well in the near IR, as can be seen in the 2MASS images (Fig. 2), in two different spatial scales. Notice the presence of a bright O star about 2 arcmin to the south of the central coordinates of FSR 1755 (Sect. 4.2).
| Object | Classification | Quality flag | |||||||
| (hms) | () | (∘) | (∘) | (′) | (′) | (stars) | |||
| (1) | (2) | (3) | (4) | (5) | (6) | (7) | (8) | (9) | (10) |
| FSR 1603 | 12:09:45 | :59:49 | 298.22 | 1.1 | 29.6 | Probable | 0 | 1842 | |
| FSR 1755 | 17:12:20 | 38:27:44 | 348.25 | 3.2 | 6.4 | Probable | 2 | 90 |
-
Cols. 2-3: Central coordinates. Cols. 4-5: Corresponding Galactic coordinates. Cols. 6 and 7: Core and tidal radii derived from King fits to the 2MASS images. Col. 8: Both candidates have been considered as probable star clusters. Col. 9: FSR quality flag. Col. 10: Number of prospective cluster members, corrected to .
3 Photometry and analytical tools
In this section we briefly describe the photometry and outline the methods we apply in the CMD analyses.
3.1 2MASS photometry
In both cases, , and 2MASS photometry was obtained in a relatively wide circular field of extraction radius centred on the coordinates provided by Froebrich, Scholz & Raftery (2007) (cols. 2 and 3 of Table 1) using VizieR444vizier.u-strasbg.fr/viz-bin/VizieR?-source=II/246. Wide extraction areas can provide the required statistics, in terms of magnitude and colours, for a consistent field star decontamination (Sect. 3.2). They are essential as well to produce stellar RDPs with a high contrast with respect to the background (Sect. 3.5). In the case of FSR 1603, the RDP resulting from the original FSR coordinates presented a dip at the centre. Thus, we searched for new coordinates to maximise the star-counts in the innermost RDP bin. The optimised central coordinates are given in cols. 2 and 3 of Table 2. The offset with respect to the original coordinates is relatively small, and .
As a photometric quality constraint, the 2MASS extractions were restricted to stars with errors in , and smaller than 0.25 mag. A typical distribution of uncertainties as a function of magnitude, for objects projected towards the central parts of the Galaxy, can be found in Bonatto & Bica (2007b). About of the stars have errors smaller than 0.06 mag.
3.2 Colour-magnitude diagrams and field-star decontamination
The CMD morphology is an essential tool to unveil the nature of the stellar overdensities. In the present cases we use 2MASS and CMDs extracted from a central region that, in the case of star clusters, should provide high-contrast CMDs. However, features present in the central CMDs and in the respective comparison field, show that field stars are an important component in the CMDs (Sect. 4). Thus, it is essential to quantitatively assess the relative densities of field stars and potential cluster sequences.
To objectively quantify the field-star contamination in the CMDs we apply the statistical algorithm described in Bonatto & Bica (2007b). It measures the relative number-densities of probable field and cluster stars in cubic CMD cells whose axes correspond to the magnitude and the colours and . These are the 2MASS colours that provide the maximum variance among CMD sequences for OCs of different ages (e.g. Bonatto, Bica & Girardi 2004). The algorithm (i) divides the full range of CMD magnitude and colours into a 3D grid, (ii) computes the expected number-density of field stars in each cell based on the number of comparison field stars with similar magnitude and colours as those in the cell, and (iii) subtracts the expected number of field stars from each cell. By construction, the algorithm is sensitive to local variations of field-star contamination with colour and magnitude. Typical cell dimensions are , and , which are large enough to allow sufficient star-count statistics in individual cells and small enough to preserve the morphology of different CMD evolutionary sequences. As comparison field we use the region around the cluster centre to obtain representative background star-count statistics, where is the limiting radius (Sect. 3.5). Further details on the algorithm, including discussions on subtraction efficiency and limitations, are given in Bonatto & Bica (2007b). The algorithm also gives the parameter which, for a given extraction, corresponds to the ratio of the number of stars in the decontaminated CMD with respect to the Poisson fluctuation measured in the observed CMD. CMDs of star clusters should have significantly larger than 1.
3.3 Fundamental parameters
Fundamental parameters are derived with solar-metallicity Padova isochrones (Girardi et al. 2002) computed with the 2MASS , and filters555stev.oapd.inaf.it/lgirardi/cgi-bin/cmd . The 2MASS transmission filters produced isochrones very similar to the Johnson-Kron-Cousins (e.g. Bessell & Brett 1988) ones, with differences of at most 0.01 in (Bonatto, Bica & Girardi 2004).
The isochrone fit gives the age and the reddening , which converts to and through the transformations , , , and (Dutra, Santiago & Bica 2002), assuming a constant total-to-selective absorption ratio . We also compute the distance from the Sun () and the Galactocentric distance (), based on the recently derived value of the Sun’s distance to the Galactic centre kpc (Bica et al. 2006). Age, , and are given in cols. 5 to 8 of Table 2, respectively.
| Target | Age | ||||||
|---|---|---|---|---|---|---|---|
| (hms) | () | (Gyr) | (mag) | (kpc) | (kpc) | ||
| (1) | (2) | (3) | (4) | (5) | (6) | (7) | (8) |
| Ru 101, FSR 1603 | 12:09:45 | 62:59:17 | |||||
| FSR 1755 | () | () |
-
Cols. 2 and 3: Optimised central coordinates (Sect. 3.1); indicates same central coordinates as in Froebrich, Scholz & Raftery (2007). Col. 4: Ratio of the decontaminated star-counts to the fluctuation level of the observed photometry. Col. 6: . Col. 8: calculated using kpc (Bica et al. 2006) as the distance of the Sun to the Galactic centre.
3.4 Colour-magnitude filters
Colour-magnitude filters are used to exclude stars with colours compatible with those of the foreground/background field. They are wide enough to accommodate cluster MS and evolved star colour distributions, allowing for the photometric uncertainties. Colour-magnitude filter widths should also account for formation or dynamical evolution-related effects, such as enhanced fractions of binaries (and other multiple systems) towards the central parts of clusters, since such systems tend to widen the MS (e.g. Bonatto & Bica 2007b; Bonatto, Bica & Santos Jr. 2005; Hurley & Tout 1998; Kerber et al. 2002).
However, residual field stars with colours similar to those of the cluster are expected to remain inside the colour-magnitude filter region. They affect the intrinsic stellar radial distribution profile to an extent that depends on the relative densities of field and cluster stars. The contribution of the residual contamination to the observed RDP is statistically taken into account by means of the comparison field.
3.5 Stellar radial density profiles
Star clusters usually have RDPs that follow some well-defined analytical profile. The most often used are the single-mass, modified isothermal sphere of King (1966), the modified isothermal sphere of Wilson (1975), and the power-law with a core of Elson, Fall & Freeman (1987). Each function is characterised by different parameters that are somehow related to cluster structure. However, considering that error bars in the present RDPs are significant (see below), and that our goal here is basically to determine the nature of the targets, we decided for the analytical profile , where is the residual background density, is the central density of stars, and is the core radius. This function is similar to that introduced by King (1962) to describe the surface brightness profiles in the central parts of globular clusters.
The stellar RDPs are built with colour-magnitude filtered photometry (Sect. 3.4). Minimisation of the presence of non-cluster stars by the colour-magnitude filter results in RDPs with a significantly higher contrast with the background (e.g. Bonatto & Bica 2007b). To avoid oversampling near the centre and undersampling at large radii, RDPs are built by counting stars in rings of increasing width with distance to the centre. The number and width of the rings are adjusted to produce RDPs with adequate spatial resolution and as small as possible Poisson errors. The residual background level of each RDP corresponds to the average number of colour-magnitude filtered stars measured in the comparison field. The coordinate (and respective uncertainty) of each ring corresponds to the average position and standard deviation of the stars inside the ring.
We also compute the density contrast parameter , that measures the intrinsic contrast of a cluster RDP (in the central region) with the background. In general terms, is a measure of the detectability of clusters by means of star counts. Obviously, the presence of O stars in very young clusters may improve the detectability, even for low- cases. As a caveat we note that values measured in colour-magnitude filtered RDPs do not necessarily correspond to the visual contrast produced by optical/IR images. The minimisation of field star contamination produces RDPs with higher contrast than those resulting from the raw photometry (e.g. Bica et al. 2006a).
As a measure of the cluster size, we also derive the limiting radius and uncertainty, which are estimated by comparing the RDP (taking into account fluctuations) with the background level. corresponds to the distance from the cluster centre where RDP and background become statistically indistinguishable. For practical purposes, most of the cluster stars are contained within (Fig. 4). The limiting radius should not be mistaken for the tidal radius; the latter is usually derived from King (or other analytical functions) fits to RDPs, which depend on wide surrounding fields and as small as possible Poisson errors (e.g. Bonatto & Bica 2007b). In contrast, comes from a visual comparison of the RDP and background levels.
The empirical determination of a cluster-limiting radius depends on the relative levels of RDP and background (and respective fluctuations). Thus, dynamical evolution may indirectly affect the measurement of the limiting radius. Since mass segregation preferentially drives low-mass stars to the outer parts of clusters, the cluster/background contrast in these regions tends to lower as clusters age. As an observational consequence, smaller values of limiting radii should be measured, especially for clusters in dense fields. However, simulations of King-like OCs (Bonatto & Bica 2007b) show that, provided not exceedingly high, background levels may produce limiting radii underestimated by about 10–20%. The core radius, on the other hand, is almost insensitive to background levels (Bonatto & Bica 2007b). This occurs because results from fitting the King-like profile to a distribution of RDP points, which minimises background effects.
4 Discussion
4.1 The IAC nature of FSR 1603
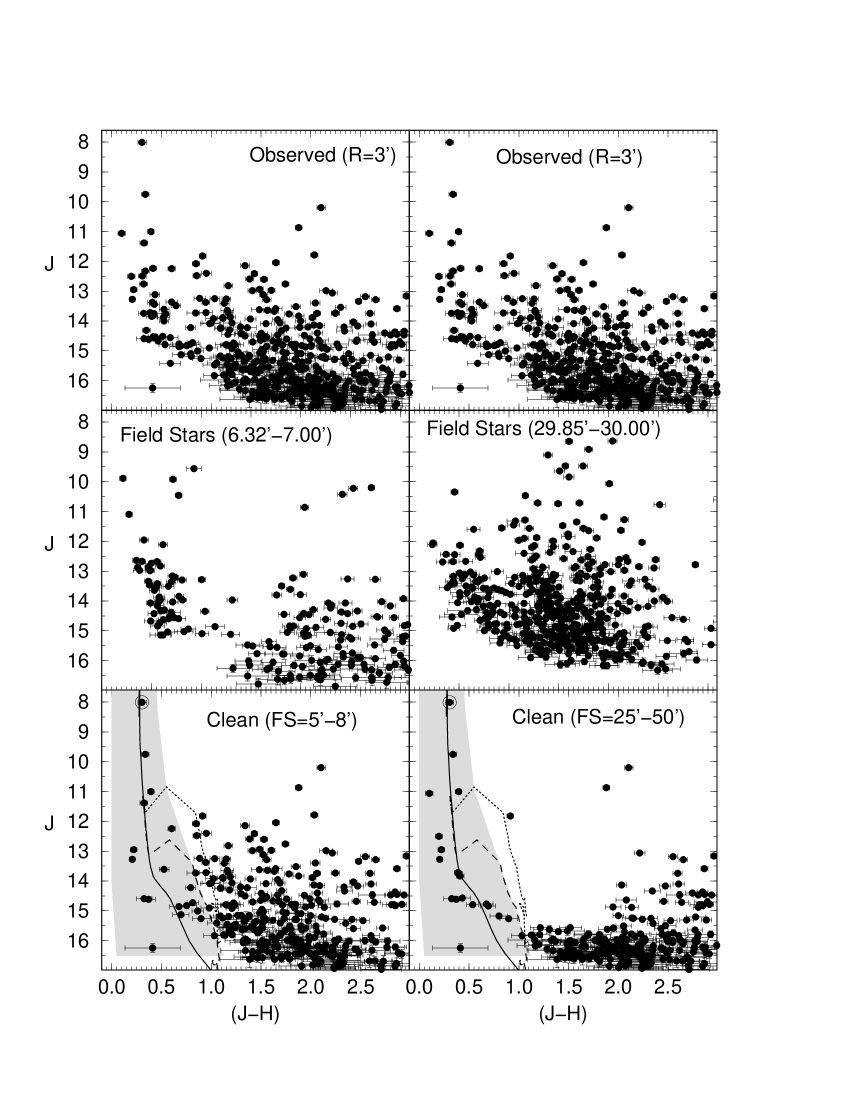
CMDs of the central () region of FSR 1603 are presented in Fig. 3 (top panels). This extraction contains the bulk of the cluster stars (Fig. 4). Features that stand out are a cluster-like population corresponding to a populous MS ( and ), a giant clump ( and ) and a giant branch ( and ), together with a redder sequence (). Some of these features (especially around the MS and the red component) are present as well in the equal-area comparison field (middle panels), extracted from a ring near , which suggests some contamination by disk and bulge stars. However, the central and comparison field extractions present significant differences in terms of CMD densities. Besides, the giant clump and giant branch are not present in the comparison field. Similar features are present in the CMDs (right panels). The qualitative discussion above strongly suggests that FSR 1603 is an intermediate-age OC.
The resulting field star decontaminated CMDs of FSR 1603 are shown in the bottom panels of Fig. 3. The comparison field was taken from the region . Bulge and disk contamination have been properly taken into account, except for about 40 red stars that remain in the decontaminated CMDs. Considering that the original red component contains about 214 stars (top panels), the statistical significance of the leftovers represent , significantly lower than that of stellar sequence identified with FSR 1603 (Table 1). As shown in Bica, Bonatto & Camargo (2007), such low values of are typical of field fluctuations detected as overdensities by Froebrich, Scholz & Raftery (2007). What emerges from the decontaminated CMDs are conspicuous sequences, especially the giant clump and the MS, typical of a relatively populous Gyr-class OC.
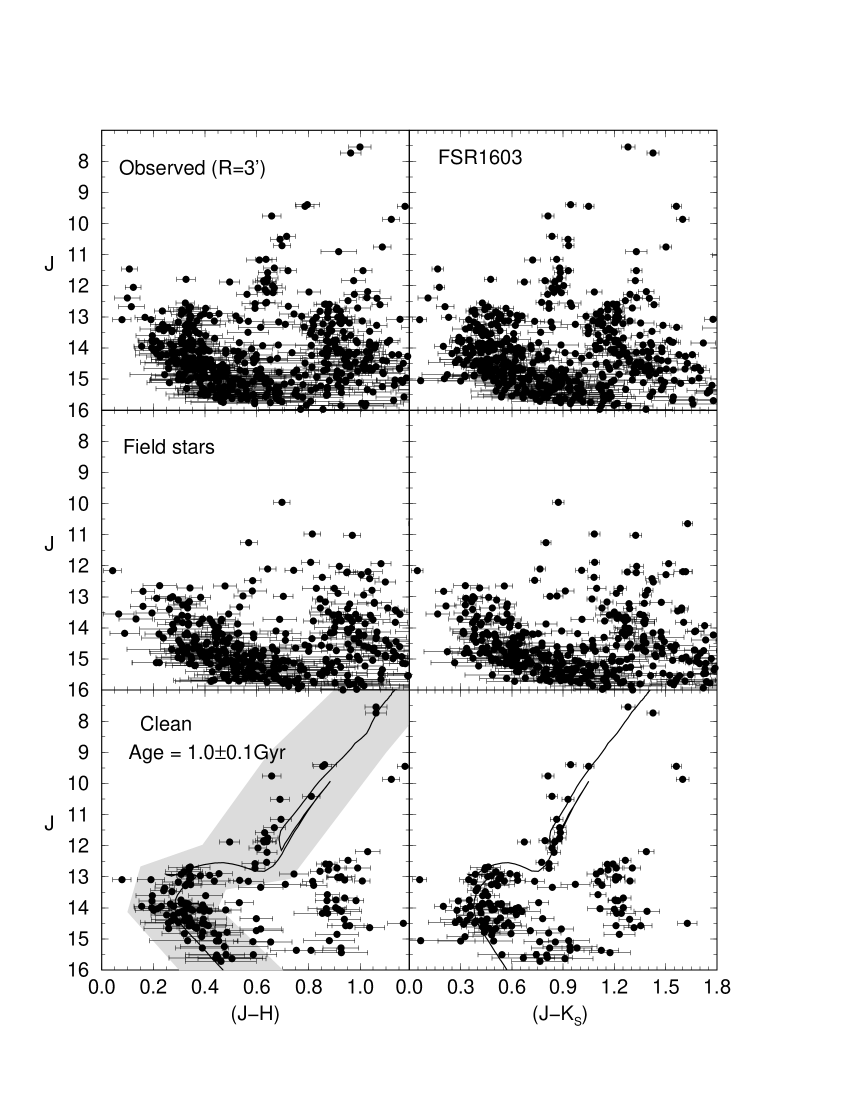
Indeed, the decontaminated CMD morphology of FSR 1603 is well represented by the 1 Gyr isochrone, with a distance modulus , and a reddening , which corresponds to and . Such values imply a distance from the Sun kpc and a Galactocentric distance kpc. At this distance, the scale is pc. The isochrone fit to FSR 1603 is shown in the bottom panels of Fig. 3.
Figure 4 shows the stellar RDP of FSR 1603. Besides the RDP resulting from the colour-magnitude filter, we also show, for illustrative purposes, that produced with the observed (raw) photometry. In both cases, the central region presents a significant density contrast with respect to the background, especially the colour-magnitude filter RDP, with . The adopted King-like function describes well the latter RDP throughout the full radii range, within uncertainties. We derive a core radius and a limiting radius . The central density of stars and the core radius () are derived from the RDP fit, while the background level is measured in the respective comparison field. The best-fit solution is superimposed on the colour-magnitude filtered RDP (Fig. 4). Because of the 2MASS photometric limit, which for FSR 1603 corresponds to a cutoff for stars brighter than (Fig. 3), should be taken as a lower limit to the actual central number-density. Within the uncertainty, the present value of agrees with that given by Froebrich, Scholz & Raftery (2007).
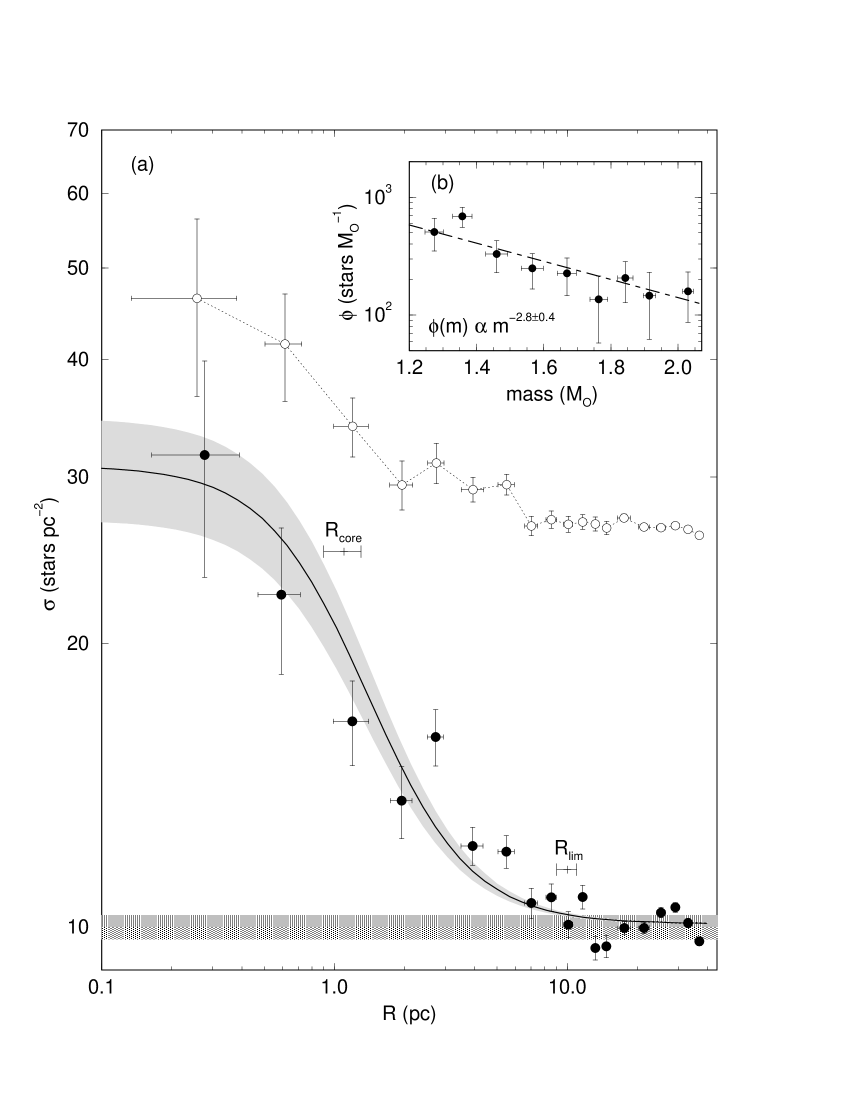
The relatively populous nature of the MS of FSR 1603 can be used to estimate the mass stored in stars. Considering the field-star decontaminated photometry, the number of observed MS and evolved stars for amount to and , respectively. Using the mass-luminosity relation derived from the 1 Gyr Padova isochrone set with the parameters presented above, the observed MS mass is . For the evolved stars we multiply by the stellar mass at the TO (), which yields the estimate . Thus, the total mass stored in the observed stars of FSR 1603 amounts to .
We also build the mass function (MF) , for the MS stars following the methods discussed in Bonatto & Bica (2005). To maximise the statistical significance of field-star counts we take as the comparison field the region at , that lies beyond the limiting radius. First we apply the colour-magnitude filter (Fig. 3) to the stars located inside the limiting radius, which eliminates most of the field stars, leaving a residual contamination. We deal with this statistically by building the luminosity functions (LFs) for the cluster and comparison field separately. , and LFs are built by counting stars in magnitude bins from the respective faint magnitude limit to the TO. To avoid undersampling near the turn-off and oversampling at the faint limit, magnitude bins are wider in the upper MS than in the lower MS. Correction is made for the different solid angles of the comparison field and cluster region. The intrinsic cluster LF is obtained by subtracting the offset-field LF. Finally, the intrinsic LF is transformed into MF using the mass-luminosity relation obtained from the 1 Gyr Padova isochrone and the observed distance modulus . These procedures are applied independently to the three 2MASS bands. The final MF is produced by combining the , and MFs. Further details on MF construction are given in Bica et al. (2006a). The resulting MF, covering the mass range , is shown in the inset of Fig. 4, where we also include the fit with the function . Within the uncertainty, the slope is similar to the of the Initial Mass Function (IMF) of Salpeter (1955).
Finally, with the above MF we can estimate the total stellar mass in FSR 1603. For masses below the observed lower limit of 1.27 , we extrapolate the observed MF down to the H-burning mass limit () using the universal IMF of Kroupa (2001). The latter IMF assumes the slopes for the range and for . With such considerations, the total (extrapolated MS evolved) mass amounts to , which implies the average mass density and the projected density .
As a caveat we note that the total mass estimates should be taken as upper limits, since because of dynamical evolution, significant fractions of the low-mass content may have been lost to the field (e.g. Bonatto & Bica 2007a).
4.2 The possible embedded cluster FSR 1755
The images of FSR 1755 (Figs. 1 and 2) clearly indicate that this object is a complicated case. Indeed, the differential absorption due to the dust clouds produces conspicuous variations in the stellar number-density, as can be seen in Fig. 6.
According to SIMBAD666http://simbad.u-starsbg.fr/simbad/ , the bright star at south of the central coordinates of FSR 1755 is the O star .
FSR 1755 appears to be spatially associated with the H II region Sh 2-3 (Sharpless 1959), located at and , also known as Gum 58 (Gum 1955) and RCW 120 (Rodgers, Campbell & Whiteoak 1960). Russeil (2003) provides the radial velocity , and the kinematic distance kpc for Sh 2-3. According to the spatial distribution of the spiral arms (Russeil 2003), Sh 2-3 appears to be related to the Sagittarius-Carina arm. Sh 2-3 is an optical H II region of dimensions , excited by the O 8V star (LSS 3959), at and . It was identified spectroscopically by Georgelin & Georgelin (1970). Vogt & Moffat (1975) provide kpc as the photometric distance to this star. has the apparent magnitudes and (Zavagno et al. 2007), , , and (2MASS). Based on the optical photometry of , Zavagno et al. (2007) compute and estimate the distance to this star as kpc, which agrees with their kinematic distance of kpc. With the 2MASS photometry of and the absolute and magnitudes of an O 8V synthetic star (Martins & Plez 2006) we compute kpc, which agrees with the previous values. We also derive , , , and .
In Fig. 5 (top panels) we show the CMD extracted from the central region of FSR 1755. An almost vertical, blue (, ) sequence — typical of very young populations — appears to merge into a dominant concentration of red stars. The strong differential reddening in the field of FSR 1755 hinders the quantitative use of the decontamination algorithm. However, it can be applied as a qualitative probe on CMD features, for different choices of the comparison field. Two cases are examined, one taking field stars from the region , that basically corresponds to the deep RDP depression (Fig. 6), and the other from an external region away from the centre. For visual purposes only, we characterise the field contamination on the central CMDs, resulting from both choices of comparison field, by means of the equal-area extractions and , respectively. They are shown in the middle panels of Fig. 5. For statistical representativity of the field stars, the decontamination algorithm uses the full radial scale of the adopted comparison fields, and , respectively. In both cases, the stellar distributions are similar in terms of colour and magnitudes, but they differ significantly in density.
Consequently, the resulting decontaminated CMDs also present differences, especially in the remaining field-star distribution. However, the blue sequence consistently remains in both CMDs.
Assuming that FSR 1755 is associated with Sh 2-3, we apply to the decontaminated CMDs the 3 Myr Padova isochrone as representative of the young age, together with the pre-MS (PMS) tracks of Siess, Dufour & Forestini (2000) with the ages 1 Myr and 5 Myr, set for kpc and . What results in both cases is consistent with a sparse embedded cluster. Thus, most of what remains in the CMDs as the red component results from the strong differential reddening in the rich field. However, because of the strong differential absorption, we cannot exclude the possibility that some fraction of the red component is composed of very reddened PMS stars.
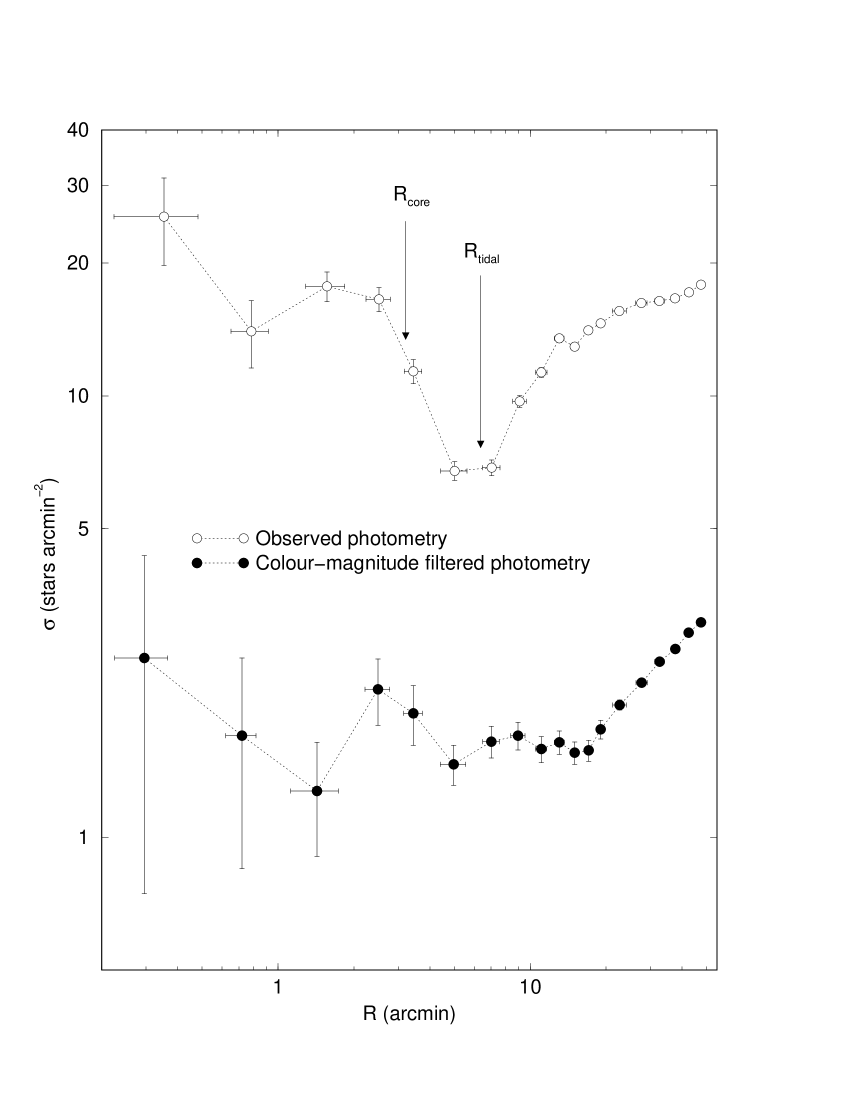
Finally, in Fig. 6 we present the RDPs of FSR 1755. The deep RDP depression, which is due to dust absorption, associated with the large number of stars related to the red component, creates the impression of a high central stellar concentration and large core radius. Taken together, these features match the GC criterion established by Froebrich, Scholz & Raftery (2007). Indeed, the RDP dip (Fig. 6) coincides with the tidal radius computed by Froebrich, Scholz & Raftery (2007).
On the other hand, most of the above features are absent in the colour-magnitude filtered RDP, which has a low-level central concentration of stars typical of a poorly-populated star cluster, and a small bump at that coincides with the radial distance of .
From the above we conclude that the potentially populous cluster FSR 1755 is in fact an artifact produced by the highly spatially variable star-count density and absorption across the field. However, we cannot exclude the possibility of a sparse young cluster embedded in the H II region Sh 2-3.
5 Summary and conclusions
In this paper we investigated the nature of the GC candidates FSR 1603 and FSR 1755, taken from the Froebrich, Scholz & Raftery (2007) catalogue, by means of decontaminated and 2MASS CMDs and stellar RDPs. Both objects were originally classified as GC candidates by Froebrich, Scholz & Raftery (2007) based essentially on the number of cluster stars, the core radius and the central star density. Basically, what results from the present work is that neither object is in fact a globular cluster: FSR 1603 is a populous intermediate-age open cluster and FSR 1755 may consist of a sparse young cluster embedded in a complex H II region.
FSR 1603 corresponds to the OC Ruprecht 101, for which cluster parameters were derived for the first time. It is a massive IAC, with Gyr, located at kpc from the Sun and Galactocentric distance kpc, reddening , core and limiting radii pc and pc, respectively. The mass stored in the observed stars is ; extrapolation to the low-MS stars () increases the mass to . Ru 101 was probably misclassified as a GC candidate because it is a populous OC.
FSR 1755 is related to the optical H II region Sh 2-3, located at kpc. The object is surrounded both by emission and dust absorption even in the band. A nearly vertical, blue CMD sequence, that includes the O 8V star , appears to define FSR 1755 as a sparse embedded cluster. Because of the strong differential reddening in the surroundings, a large number of red stars show up in the CMDs, which probably produced the stellar enhancement that was taken as GC candidate by Froebrich, Scholz & Raftery (2007). We conclude that the GC identification of FSR 1755 is a dust-absorption artifact in a very rich stellar field.
Systematic surveys such as that of Froebrich, Scholz & Raftery (2007) are important to detect new star cluster candidates throughout the Galaxy. Nevertheless, works like the present one, that fine tune the analysis by means of field-star decontaminated CMDs and stellar radial profiles, turn out to be fundamental to probe the nature of such candidates, especially those projected against dense stellar fields.
acknowledgements
We thank the anonymous referee for suggestions. We acknowledge partial support from CNPq (Brazil). This research has made use of the SIMBAD database, operated at CDS, Strasbourg, France, as well as of data products from the Two Micron All Sky Survey (2MASS), which is a joint project of the University of Massachusetts and the Infrared Processing and Analysis Center/California Institute of Technology, funded by the National Aeronautics and Space Administration and the National Science Foundation. We employed Digitized Sky Survey images from the Space Telescope Science Institute (U.S. Government grant NAG W-2166) obtained using the extraction tool from CADC (Canada). We also made use of the WEBDA database, operated at the Institute for Astronomy of the University of Vienna.
References
- Bessell & Brett (1988) Bessell, M.S. & Brett, J.M. 1988, PASP, 100, 1134
- Bica et al. (2006a) Bica, E., Bonatto, C. & Blumberg, R. 2006a, A&A, 460, 83
- Bica et al. (2006) Bica, E., Bonatto, C., Barbuy, B. & Ortolani, S. 2006, A&A, 450, 105
- Bica et al. (2007) Bica, E., Bonatto, C., Ortolani, S. & Barbuy, B. 2007, A&A, 472, 483
- Bica, Bonatto & Camargo (2007) Bica, E., Bonatto, C. & Camargo, D.. 2007, MNRAS, in press, (astro-ph/0712.0762)
- Binney & Merrifield (1998) Binney, J. & Merrifield, M. 1998, in Galactic Astronomy, Princeton, NJ: Princeton University Press. (Princeton series in Astrophysics)
- Bonatto, Bica & Girardi (2004) Bonatto, C., Bica, E. & Girardi, L. 2004, A&A, 415, 571
- Bonatto, Bica & Santos Jr. (2005) Bonatto, C., Bica, E. & Santos Jr., J.F.C. 2005, A&A, 433, 917
- Bonatto & Bica (2005) Bonatto, C. & Bica, E. 2005, A&A, 437, 483
- Bonatto & Bica (2007a) Bonatto, C. & Bica, E. 2007a, A&A, 473, 445
- Bonatto & Bica (2007b) Bonatto, C. & Bica, E. 2007b, MNRAS, 377, 1301
- Bonatto & Bica (2007c) Bonatto, C. & Bica, E. 2007c, A&A, accepted, (astro-ph:0711.1434)
- Bonatto et al. (2007) Bonatto, C., Bica, E., Ortolani, S. & Barbuy, B. 2007, MNRAS, 381, L45
- Dutra, Santiago & Bica (2002) Dutra, C.M., Santiago, B.X. & Bica, E. 2002, A&A, 383, 219
- Elson, Fall & Freeman (1987) Elson, R.A.W., Fall, S.M. & Freeman, K.C. 1987, ApJ, 323, 54
- Froebrich, Meusinger & Scholz (2007) Froebrich, D., Meusinger, H. & Scholz, A. 2007, MNRAS, 377, L54
- Froebrich, Scholz & Raftery (2007) Froebrich, D., Scholz, A. & Raftery, C.L. 2007, MNRAS, 374, 399
- Froebrich, Meusinger & Davis (2007) Froebrich, D., Meusinger, H. & Davis, C.J. 2007, MNRAS, in press (astro-ph:0710-2030)
- Georgelin & Georgelin (1970) Georgelin, Y.P. & Georgelin, Y.M. 1970, A&ASS, 3, 1
- Girardi et al. (2002) Girardi, L., Bertelli, G., Bressan, A., et al. 2002, A&A, 391, 195
- Gum (1955) Gum, C.S. 1955, MmRAS, 67, 155
- Hurley & Tout (1998) Hurley, J. & Tout, A.A. 1998, MNRAS, 300, 977
- Kerber et al. (2002) Kerber, L.O., Santiago, B.X., Castro, R. & Valls-Gabaud, D. 2002, A&A, 390, 121
- King (1962) King, I. 1962, AJ, 67, 471
- King (1966) King, I. 1966, AJ, 71, 64
- Kroupa (2001) Kroupa, P. 2001, MNRAS, 322, 231
- Martins & Plez (2006) Martins, F. & Plez, B. 2006, A&A, 457, 637
- Mermilliod (1996) Mermilliod, J.C. 1996, in The Origins, Evolution, and Destinies of Binary Stars in Clusters, ASP Conference Series, eds. E.F. Milone & J.-C. Mermilliod, 90, 475
- Rodgers, Campbell & Whiteoak (1960) Rodgers, A.W., Campbell, C.T. & Whiteoak, J.B. 1960, MNRAS, 121, 103
- Russeil (2003) Russeil, D. 2003, A&A, 397, 133
- Salpeter (1955) Salpeter, E. 1955, ApJ, 121, 161
- Sharpless (1959) Sharpless, S. 1959, ApJS, 4, 257
- Siess, Dufour & Forestini (2000) Siess, L., Dufour, E. & Forestini, M. 2000, A&A, 358, 593
- Vogt & Moffat (1975) Vogt, N. & Moffat, A.F.J. 1975, A&A, 45, 405
- Wilson (1975) Wilson, C.P. 1975, AJ, 80, 175
- Zavagno et al. (2007) Zavagno, A., Pomarès, M., Deharveng, L., Hosokawa, Y., Russeil, D. & Caplan, J. 2007, A&A, 472, 835