Dynamic force spectroscopy on multiple bonds:
experiments and model
Abstract
We probe the dynamic strength of multiple biotin-streptavidin adhesion bonds under linear loading using the biomembrane force probe setup for dynamic force spectroscopy. Measured rupture force histograms are compared to results from a master equation model for the stochastic dynamics of bond rupture under load. This allows us to extract the distribution of the number of initially closed bonds. We also extract the molecular parameters of the adhesion bonds, in good agreement with earlier results from single bond experiments. Our analysis shows that the peaks in the measured histograms are not simple multiples of the single bond values, but follow from a superposition procedure which generates different peak positions.
I Introduction
Cell adhesion in multicellular organisms is mediated by highly specific, but weak receptor-ligand bonds a:Bell1978 ; a:Bongrand1999 ; c:evan07 . Typical bond energies are in the range of several so that bond lifetimes are finite due to thermal activation from the environment. Since cellular adhesion sites usually operate under mechanical load, different experimental techniques have been developed to study rupture of single biomolecular bonds under an applied load. Motivated by atomic force microscope (AFM) measurements on biotin-streptavidin a:FlorinMoyGaub1994 , it has been shown that the force at which a bond breaks under an applied load is a stochastic variable with a probability distribution which depends on the loading protocol and which can be explained by Kramers theory for the escape of an overdamped particle from a potential well over a sharp transition state barrier a:EvansRitchie1997 ; c:seif98 . This insight led to the new field of dynamic force spectroscopy (DFS) a:Merkel2001 . For the biotin-streptavidin system, the concept of dynamic bond strength has been confirmed by experiments with the biomembrane force probe (BFP) a:MerkelEtAl1999 . If force increases linearly in time with loading rate , i.e. if , a rupture force distribution results in which the most frequent rupture force is proportional to the logarithm of loading rate (the same result has been found for the average rupture force c:tees01 ). Dynamic force spectra use this relation to chart the binding landscape: a straight line in the plot of versus is characteristic for a single dominant barrier limiting escape. The slope is determined by the distance of the barrier from the ground state (the reactive compliance ) and extrapolation to yields the unstressed off-rate of the bond over this barrier. A series of energy barriers reveals itself as a sequence of straight lines with increasing slope, thus defining different regimes, each dominated by one transition state barrier.
Single bond DFS experiments require a very low frequency of successful binding events to avoid multiple attachments. This renders single bond experiments time consuming and accumulation of rupture force histograms difficult. In the following, we describe DFS-experiments with the BFP on the biotin-streptavidin system at four different loading rates, in which we allow formation of multiple bonds. Experimentally, the streptavidin-biotin system is the best studied example for molecular bonding. In detail, it has been investigated with AFM a:FlorinMoyGaub1994 , BFP a:MerkelEtAl1999 and flow chambers c:pier02 . In the latter case, multiple bonds have been probed, but a persistent problem with flow chambers is that force is distributed in a heterogeneous way over the different bonds, thus rendering a quantitative analysis difficult. In contrast, force distribution is expected to be significantly more homogeneous for the BFP as used here. The higher frequency of binding events introduced here makes acquisition of rupture force histograms considerably easier. However, in order to evaluate the histograms, a theoretical model is required which allows to extract the single bond properties from the multiple bond data.
Deterministic models for the rupture of multiple, parallel bonds have been analysed before for constant a:Bell1978 as well as linear loading a:Seifert2000 . While deterministic models describe the average number of bonds and are most appropriate for large systems, stochastic models are required for small systems with a finite number of bonds. Here the simplest possible case is the irreversible rupture of a small number of equivalent bonds, which can be described in the mathematical framework of a one-step master equation c:tees01 . Multiple bonds also allow rebinding of broken bonds, which can be described in the same framework a:ErdmannSchwarz2004a ; a:ErdmannSchwarz2004c . It has also been applied before to the case of linear loading commonly used in DFS a:ErdmannSchwarz2004b . Similar approaches have been also used to describe DFS on titin, where the different bonds may correspond to different hydrogen bonds within a single Ig27-domain maka01 or to the different Ig27-domains within titin c:brau05 .
In this paper, we use the framework of a one-step master equation to evaluate data from multiple bond DFS on the well-established streptavidin-biotin system. Because multiple bonds are now allowed in the experimental setup, the exact number of initial bonds in each experiment is a stochastic variable. By comparing numerical solutions of the master equation to experimental histograms, we can estimate the corresponding probability distribution. In this way, we show for the first time how the dissociation spectrum of multiple bond DFS results from the superposition of the contributions from different numbers of initially closed bonds.
II Experiments
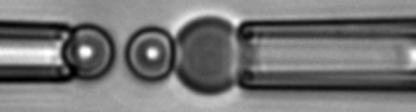
To monitor rupture forces between multiple streptavidin-biotin bonds at different loading rates, we used the BFP-instrument as described previously a:MerkelEtAl1999 and depicted in fig. 1. In brief, for use as force transducers, biotinylated red blood cells were pressurized into a spherical shape with a micropipette. The suction pressure sets the red cell membrane tension, and thus the BFP spring constant, , in a tunable fashion at values as low as . Probe and test glass microspheres were decorated respectively with streptavidin and biotin following a common procedure, in which polyethylene glycol (PEG) crosslinkers (Nektar) were used to inhibit non-specific adhesiona:PerretEtAl2002 . The streptavidin-coated probe bead was firmly attached to the apex of the biotinylated red blood cell capsule. The biotin-coated test bead was maintained in a second micropipette and manoeuvred to/from the BFP probe at controlled impingement forces () and retraction speeds by precision piezo-translators. Bead positions were determined by on-line video processing at a sampling rate up to and with a spatial resolution of about . Validation of our set-up was achieved by measuring rupture forces of individual streptavidin-biotin bonds for loading rates between and (data not shown, see t:Pierrat2004 for details). The obtained dynamic force spectrum, which collects the most probable unbinding force for each loading rate, was in excellent agreement with previous reports a:MerkelEtAl1999 . In particular, the derived energy landscape exhibits two transition barriers characterised by two reactive compliances, and .
As compared with single bond DFS, we mainly implemented two changes in the experimental procedure. First, while an attachment frequency of per touches is the usual criterion that ensures high probability of single bond formation, we increased the surface density of specific sites on the glass beads to reach an adhesion frequency of about per touches. According to Poisson statistics, this increases the likelihood of picking multiple bonds. Second, and more important, since our goal was to quantitatively account for the distribution of all measured rupture forces, good accuracy for both low and high forces was required. Despite its advantages of tunability and softness, the red blood cell-based transducer is only linear for extensions below a:SimsonEtAl1998 . In practice, this led us to set the BFP spring constant around and the range of explored loading rates between and . In consequence, we focused on the regime dominated by the outer barrier of the streptavidin-biotin energy landscape (with a reactive compliance ).
For biotin-streptavidin, rupture experiments with different experimental techniques indicated a dependence of unbinding forces on binding history, namely on the contact time that is available for binding before loading begins. In a:PincetHusson2005 this was assigned to the existence of an additional energy minimum (the absolute ground state) which is reached only after a large contact time and is more stable against rupture than the intermediate ground state that is reached first. In our experiments, we use the same contact protocol as in a:MerkelEtAl1999 with short contact times of , thus we expected the bonds to unbind from the same initial state probed before.
III Model
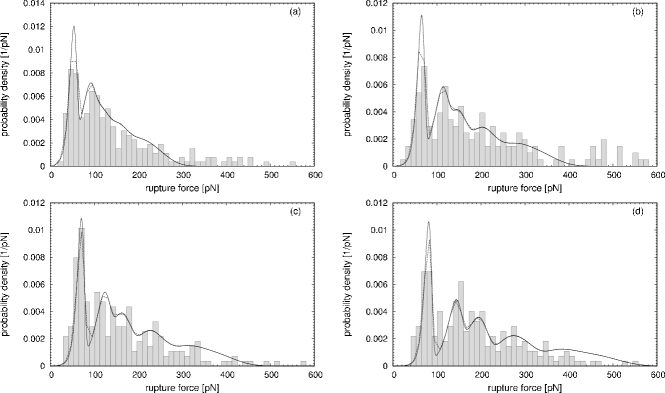
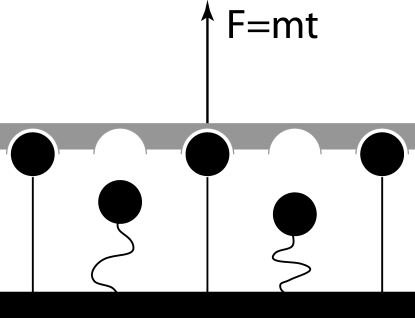
Fig. 2 shows a schematic representation of the experimental setup from fig. 1. Between two opposing surfaces receptor-ligand pairs are arranged in parallel. Each receptor can either be bound to its ligand (closed bond) or unbound (open bond). At a given time there are closed and open bonds. For the large loading rates that we use in our experiments, it is sufficient to consider irreversible bonds which cannot rebind after rupture a:Seifert2000 ; a:ErdmannSchwarz2004b . Thus, the number of bonds which is relevant for the rupture process is the number of closed bonds that has formed prior to loading. Rupture of a bond occurs stochastically through thermal activation. Following Bell a:Bell1978 the off-rate for rupture of a bond increases exponentially with the force exerted to it, i.e. . Here is the unstressed off-rate at vanishing force and is the intrinsic force scale for bond rupture, which is set by thermal energy and reactive compliance .
An essential part of the modelling is a reasonable assumption on how force is distributed over the closed bonds in a cluster. Here we assume that the force , which is determined by the displacement of the red blood cell, is independent of the number of closed bonds and is shared equally between them, i.e. . In our setup, this assumption is appropriate because the bonds are attached to a solid support of finite curvature. Because the binding times of tethered polymer bonds increase very rapidly with the separation of the opposing surfaces a:JeppesenEtAl2001 , our short contact times make formation of bonds at large separations unlikely. Moreover biomolecular bonds carried by extended polymer tethers dissociate rapidly under force uss:erdm07a . Therefore we expect the relevant bonds to form mainly within a narrow range of surface separations corresponding to the area of closest approach. Because the tethers that attach the ligands to the solid support have a contour length () which is small compared to the extension of the soft transducer, unbinding of a tether has a negligible effects on transducer extension and force.
The number of closed bonds in a cluster reduces with time from (initial, bound state) to (final, dissociated state). Because for shared loading all bonds are equivalent, the probabilities () to find closed bonds at time completely characterise the system. Their time evolution follows the one-step master equation
| (1) |
This equation states that decreases through rupture of a closed bond with the rate , where the linear factor accounts for the fact that at any given time, each of the remaining bonds can be the next to break. Once the master equation is solved, one can calculate the cluster dissociation rate as a function of time, which can be converted to using the linear relation between time and force.
Our model contains three unknown parameters, which can be determined through comparison with experiment: the unstressed off-rate , the intrinsic force scale (or, equivalently, the reactive compliance ) and the initial number of closed bonds . In our experiments, the latter is itself a stochastic variable and cannot be controlled for every rupture event. Instead we assume that follows a probability distribution
| (2) |
which is characterised by the set of coefficients . is the maximal number of initial bonds considered and will be chosen in such a way that it does not affect the outcome of our parameter estimation. Because experimentally we only record data involving deformation of the transducer, events with are not considered in the theoretical analysis. If closed bonds formed at a constant rate over a given time interval, would be a Poisson distribution
| (3) |
as has been reported before for similar experimental setups c:pier02 ; a:Zhu2000 . The Poisson distribution contains the single parameter which determines the average number of broken bonds as .
Experimental histograms are linear combinations of the distributions for single in which the distribution eq. (2) determines the coefficients:
| (4) |
For shared loading with a time-dependent force, analytical solutions for eq. (1) do not exist a:ErdmannSchwarz2004b . Therefore we use the Gillespie algorithm mc:Gillespie1976 for exact stochastic simulations to generate rupture trajectories with the stochastic dynamics described by the master equation. For given values of and , distributions of rupture force are calculated for at the four loading rates. The distributions are superimposed via as in eq. (4) and the relative weights are determined by a least-mean-square fit of to the complete set of experimental data. For this purpose, the simulation data are discretized in the same way as the experimental data and every bin is used as one data point. This procedure is iterated until values for and are found that minimize the deviations between simulations and experimental histograms.
IV Results
Fig. 3 shows experimentally obtained rupture force histograms including , , and rupture events for the four different loading rates , , and , respectively. The histograms are compared to simulated rupture force distributions which are calculated using rupture trajectories at each value of and loading rate. Fitting simulations to measurements yielded the unstressed off-rate and the intrinsic force scale , corresponding to the reactive compliance . Thus our results extracted from multiple bond data compare very favorable with earlier results from single bond experiments, which gave (a value for has not been given before). Closer inspection of fig. 3 shows that the simulated distributions approximate the positions and heights of the peaks in the histograms in a reasonable way. Note that the fits were not done separately to the different data sets for the different loading rates, but simultaneously to the complete set of experimental data. Thus the model is capable to fit well the whole range of loading rates probed.
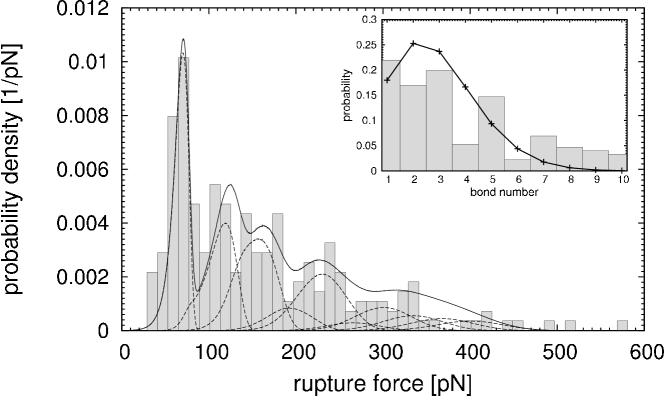
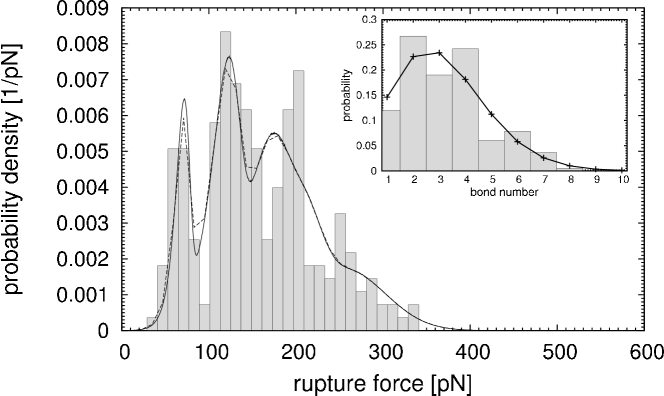
Fig. 4 shows for the case how the different rupture force distributions combine to give . Each curve displays a single maximum followed by a super-exponential decay at large forces. In general, their peaks cannot be identified with the peaks in the experimental histograms as it was done in previous analyses (e.g. in a:FlorinMoyGaub1994 ; a:ZhangMoy2003 ; c:aule04 ). The best agreement is found for , i.e. between the peak of and the first experimental peak. In contrast, the positions of the peaks in or cannot be guessed from the histograms. In general, the peak positions of the do not increase linearly with . Although this has been pointed out before a:Seifert2000 , a force quantum has occasionally been discussed in the literature. Our analysis shows that the situation is more complex and that accurate identification of the from the simulation data is required to extract the single bond data from the multiple bond histograms.

The extracted probability distribution for the number of initial closed bonds is the histogram shown as inset in fig. 4. Its average is . The largest included was , because larger did not make a difference for the estimate of the molecular parameters. The inset also shows the result of a least-mean-square fit to a Poisson distribution, which is characterized by (). The reduced average reflects the fact that the Poisson distribution underrepresents the tail of the distribution extracted from the experimental data. However, it is also important to note that the reconstruction at large forces is not very reliable due to the few events in the experimental data (compare fig. 3). In order to test whether the Poisson distribution is compatible with our experimental data, we generated artificial rupture histograms by drawing random values for from the Poisson distribution exactly as often as experimental data points were present. Fig. 5 shows a corresponding histogram for loading rate pN/s. The lines and the inset represent the same analysis as done before for the experimental data. The new Poisson distribution is slightly different, with instead of , while the extracted values for and are essentially unchanged. Taken together, the data simulation suggests that the finite size of the data set can explain the deviations between experimental data and model fit.
Figs. 3 and 4 suggest that the most salient feature of both the experimental and simulation data is the first peak, which corresponds to single bond rupture. In Fig. 6 we plot the fitted positions of the first peaks as a function of . As expected for dynamic force spectra, the data points can be fitted to a linear curve with the slope and the intersection with at . This again yields and for the unstressed off-rate and the reactive compliance, respectively, demonstrating that our analysis is consistent. These results suggest that the first peaks in a series of multiple bond rupture force histograms at different loading rates as shown in fig. 3 can be used to achieve a quick and simple estimate of the molecular parameters. In particular, this estimate can then be used as a starting point for the detailed numerical analysis presented above.
V Discussion
We have used multiple bond DFS-measurements with the BFP-setup to probe the outer barrier of the biotin-streptavidin bond. If multiple attachments are allowed, the frequency of successful binding events is larger than in classical single bond experiments so that information can be obtained more efficiently in the form of rupture force histograms. As demonstrated here, analysis of these histograms requires theoretical modelling of the rupture of parallel adhesion bonds under an applied load because the peaks of the histograms follow from a superposition procedure. Using an established stochastic model for bond rupture under shared loading in combination with the assumption of a variable number of initial bonds, we showed for the first time how this superposition looks in practise, compare fig. 4. The molecular bond parameters and were extracted in good agreement with previous results from single bond experiments.
One particular feature of our approach is that with a simple model for multiple bond rupture we arrived at an extraction of single bond data which is both successful and efficient. Our model for force transduction and adhesion bonds is rather generic and can be easily extended to include additional effects like finite transducer and tether stiffnesses or generalised models for the binding landscape. E.g. it was shown for protein unfolding that analysis of histograms can be used to identify the shape of the binding landscape and identify deviations from the assumption of sharp transition barriers underlying DFS a:SchlierfRief2006 . We expect that the agreement between experimental and theoretical histograms can be improved by including more substructure into the model. Recently, it has been proposed that deviations in rupture force histograms from the DFS predictions are caused by an intrinsic heterogeneity of bond parameters a:RaibleEtAl2006 . The increased width and large force tails could be described imposing Gaussian noise on . Although this effect will be small compared to the variations caused by the distribution of and will not alter the basic results, it might explain residual events at large rupture forces (another possible explanation is that some initial population of the biotin-streptavidin ground state exists after all). Both examples show that for detailed studies of adhesion bonds, a model-based analysis of the histograms is required.
In this work, rebinding effects could be safely neglected. It has been shown before that rebinding is only relevant if the dimensionless loading rate a:Seifert2000 ; a:ErdmannSchwarz2004b . Using the smallest value for the loading rate, , and the extracted bond parameters and , we get a value of , which is much larger than the largest value used here. In principle, multiple bond experiments also offer the chance to measure rebinding rates, in marked contrast to single bond experiments. This could be done in different ways. For example, one could control the time allowed for bond formation prior to loading a:Zhu2000 . The mean number of formed bonds could be extracted as described here and then converted into a value for the rebinding rate. Alternatively, one could work at small loading rate. Then the master equation from eq. (1) had to be extended by rebinding terms a:ErdmannSchwarz2004b . A similar procedure as described here then could be used to extract the rebinding rate. For biotin-streptavidin, the above estimate suggests that then loading rates had to be smaller by at least one order of magnitude. Therefore adhesion bonds with faster off-kinetics than biotin-streptavidin might be more appropriate for this purpose.
Finally, investigating multiple bond rupture will help to understand properties of biological adhesion sites which usually consist of clusters of adhesion molecules. For example, it has been found with image correlation microscopy that in living cells during cell migration, integrin adhesion receptors are preclustered with an average cluster size of three to four, which is very similar to the average cluster size studied here c:wise04 . Thus biomimetic studies like the one presented here are essential to understand the way biological systems make use of adhesion clusters.
This work was supported by the German Research Foundation (DFG) through the Emmy Noether Program, the Center for Modeling and Simulation in the Biosciences (BIOMS) at Heidelberg and the Human Frontier Science Program (RG#52/2003). Support from Corning Corporation through the fellowship provided to one of us (S.P.) is also gratefully acknowledged.
References
- (1) Bell G. I. Science 200 1978 618.
- (2) Bongrand P. Rep. Prog. Phys. 62 1999 921.
- (3) Evans E.A. Calderwood D.A. Science 316 2007 1148.
- (4) Florin E.-L. et al. Science 264 1994 415.
- (5) Evans E. Ritchie K. Biophys. J. 72 1997 1541.
- (6) Shillcock J. Seifert U. Phys. Rev. E 57 1998 7301.
- (7) Merkel R. Phys. Rep. 346 2001 343.
- (8) Merkel R. et al. Nature 397 1999 50.
- (9) Tees D. F. J. et al. J. Chem. Phys. 114 2001 7483.
- (10) Seifert U. Phys. Rev. Lett. 84 2000 2750.
- (11) Erdmann T. Schwarz U. S. Phys. Rev. Lett. 92 2004 108102.
- (12) Erdmann T. Schwarz U. S. J. Chem. Phys. 121 2004 8997.
- (13) Erdmann T. Schwarz U. S. Europhys. Lett. 66 2004 603.
- (14) Makarov D. E. et al. J. Chem. Phys. 114 2001 9663.
- (15) Braun O. Seifert U. Eur. Phys. J. E 18 2005 1.
- (16) Pierres A. et al. Biophys. J. 82 2002 3214.
- (17) Perret E. et al. Langmuir 18 2002 846.
- (18) Pierrat S. PhD thesis Université Paris 6 2004.
- (19) Simson D. A. et al. Biophys. J. 74 1998 2080.
- (20) Pincet F. Husson J. Biophys. J. 89 2005 4374.
- (21) Jeppesen C. et al. Science 293 2001 465.
- (22) Erdmann T. Schwarz U. S. Eur. Phys. J. E 22 2007 123.
- (23) Zhu C. J. Biomech. 33 2000 23.
- (24) Gillespie D. T. J. Comp. Phys. 22 1976 403.
- (25) Zhang X. Moy V. Biophys. Chem. 104 2003 271.
- (26) Auletta T. et al. J. Am. Chem. Soc. 126 2004 1577.
- (27) Schlierf M. Rief M. Biophys. J. 90 2006 L33.
- (28) Raible M. et al. Biophys. J. 90 2006 3851.
- (29) Wiseman P. W.,et al. J. Cell Sci. 117 2004 5521.