The Spitzer Gould Belt Survey of Large Nearby Interstellar Clouds: Discovery of a Dense Embedded Cluster in the Serpens-Aquila Rift
Abstract
We report the discovery of a nearby, embedded cluster of young stellar objects, associated filamentary infrared dark cloud, and 4.5 m shock emission knots from outflows detected in Spitzer/IRAC mid-infrared imaging of the Serpens-Aquila Rift obtained as part of the Spitzer Gould Belt Legacy Survey. We also present radial velocity measurements of the region from molecular line observations obtained with the Submillimeter Array (SMA) that suggest the cluster is co-moving with the Serpens Main embedded cluster to the north. We therefore assign it the same distance, 260 pc. The core of the new cluster, which we call Serpens South, is composed of an unusually large fraction of protostars (77%) at high mean surface density (430 pc-2) and short median nearest neighbor spacing (3700 AU). We perform basic cluster structure characterization using nearest neighbor surface density mapping of the YSOs and compare our findings to other known clusters with equivalent analyses available in the literature.
1 Introduction
The aim of the Spitzer Gould Belt (GB; Allen et al. in prep.) and c2d (Evans et al., 2003) Legacy Surveys is to build a complete mid-infrared record of star formation in all of the large molecular clouds within 500 pc, largely dominated by the Gould Belt itself. This is one of several surveys of the Gould Belt being performed at many wavelengths from the near-IR (Two-Micron All Sky Survey; 2MASS Skrutskie et al., 2006) through the far-infrared (Herschel; André & Saraceno, 2005) to the submillimeter (Submillimeter Common User Bolometer Array 2; SCUBA-2; Ward-Thompson et al., 2007). In combination, the resulting database offers a nearly complete and unbiased view of all nearby star formation in large molecular clouds. This penetrating examination of regions that have often received little attention in the literature is likely to reveal new regions of star formation.
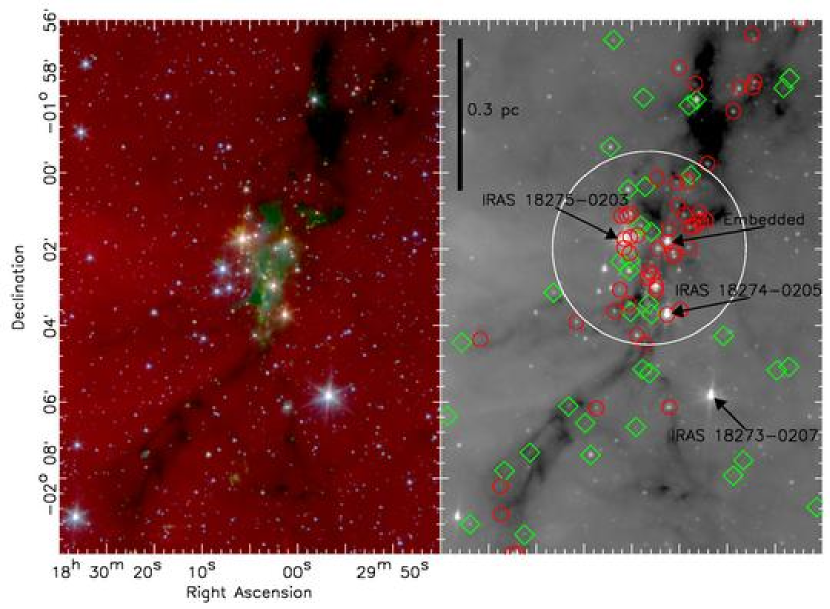
The Spitzer Infrared Array Camera (IRAC) imaging presented here reveals a dense cluster of sources with excess infrared emission and associated 4.5 m-bright structured nebulosity (typically shocked H2 emission from outflows, cf. Smith et al., 2006) within a filamentary infrared dark cloud seen in absorption against bright diffuse 5.8 and 8.0 m emission. This emission is most likely PAH-feature emission (Morris et al., 2004) excited by the young, high mass stars in W40 (Smith et al., 1985), 20′ to the east. We found structured nebulosity at the site in 2MASS Atlas images, but few sources. The region is flanked by two Infrared Astronomy Satellite (IRAS) sources (IRAS 18275-0203 and IRAS 18274-0205), and Midcourse Space Experiment (MSX) coverage of this region reveals only a few additional point sources. No deep X-ray images of this region are available.
2 Observations
We obtained 3.6, 4.5, 5.8, and 8.0 m imaging of 5.1 square degrees of the Serpens-Aquila Rift with IRAC (Fazio et al., 2004) onboard Spitzer (Werner et al., 2004) as part of the GB Legacy Survey (PID: 30574) on 27 October 2006. In this letter, we focus on the 14′ 10′ field of view centered on Serpens South (R.A., Dec. (2000) = 18:30:03, 02:01:58.2). High Dynamic Range mode was used, resulting in 0.4 and 10.4 second integrations for each of four dithered images at each mosaic position. Mosaics were constructed at 12 per pixel with Basic Calibrated Data (BCD) products from the Spitzer Science Center’s data pipeline v14.4. All artifact treatment, mosaic construction, point source detection and aperture photometry, and photometric classification of sources presented here has been performed using custom Interactive Data Language (IDL) routines (Gutermuth et al., 2007). We adopted aperture radii and inner and outer background annulus radii of 24, 24, and 72, respectively. Point source flux calibration is discussed in detail in Reach et al. (2005). Field averaged 90% differential completeness magnitude limits are 14.5, 14.2, 13.2, and 12.0 for the 14′ 10′ submosaics at 3.6, 4.5, 5.8, and 8.0 m, respectively (Gutermuth et al., 2005). The sensitivity of these data are equivalent to the IRAC data presented by Winston et al. (2007) for the Serpens Main cluster, which will be discussed in Section 4. IRAC photometry catalogs are bandmerged together with a radial matching tolerance of 1″, and then merged with the 2MASS Point Source Catalog (PSC) at a tolerance of 1″.
2.1 Submillimeter Array
Observations with the SMA111The Submillimeter Array is a joint project between the Smithsonian Astrophysical Observatory and the Academia Sinica Institute of Astronomy and Astrophysics and is funded by the Smithsonian Institution and the Academia Sinica. (Ho et al., 2004) were performed on 30 January 2007. The array was tuned to cover the frequency range 219.4-221.4 GHz (LSB) and 229.4-231.4 GHz (USB), which includes the lines of 12CO, 13CO, and C18O 2-1, with a resolution of 0.5 km s-1/channel. Three positions were observed for 30 minutes each; IRAS 18275-0203 (R.A.,Dec. (2000) = 18:30:05.8, 02:01:45) and a nearby embedded source (R.A.,Dec. (2000) = 18:30:01.3, 02:01:48, labelled “Embedded” in Figure 1), both in Serpens South, and a position near to the 12CO 1-0 peak of W40, as determined from the maps of Grabelsky et al. (1987), at R.A.,Dec. (2000) = 18:31:20.7, 02:01:07. Ganymede was observed for passband calibration. No flux or complex gain calibration was performed. More detailed SMA results will be discussed in a future paper.
3 Results
3.1 Distance
Serpens South appears to be associated with a filamentary cloud seen in absorption against PAH emission from W40 (Fig. 1). Thus the distance to W40 (550 150 pc Radhakrishnan et al., 1972; Smith et al., 1985) is an upper limit to the distance to Serpens South. The Serpens Main cluster has local standard of rest (LSR) velocities in the range 6-11 km s-1, when observed in the isotopologues of CO (White et al., 1995), with Gaussian FWHM widths of km s-1. Thus, its molecular line emission can be separated from that associated with W40, which occurs in the LSR range of 2-6 km s-1 (Zeilik & Lada, 1978; Vallee et al., 1992; Zhu et al., 2006), and is spatially compact. The SMA data clearly show that the velocities of IRAS 18275-0203 and the nearby embedded source are the same as that of the Serpens Main cluster, and not of the W40 cluster. We therefore assign the distance of 260 37 pc (Straižys et al., 1996) to Serpens South. This is consistent with more recent results for the entire Serpens-Aquila Rift (Straižys et al., 2003).
3.2 Identification, Membership, and Spatial Distribution of YSOs
We identify likely YSOs from their excess infrared emission over that expected from a typical photosphere and high infrared flux compared to extragalactic contaminants (Gutermuth et al., 2007). These candidates are classified as Class I (protostar) or Class II (pre-main sequence star with disk) YSOs222Class III (diskless) YSOs cannot be distinguished from field stars in this way (Megeath et al., 2004), but can be effectively identified with X-ray observations (cf. Feigelson et al., 2007). by the their value of , the linear least squares fit to their spectral energy distribution (log vs. log ) through the four IRAC bandpasses (Lada et al., 2006). In this way, we have identified 54 Class I and flat spectrum “protostars” ( Greene et al., 1994) and 37 Class II () YSOs, a total of 91 (59% protostars), within the 14′ 10′ (1.1 pc 0.8 pc) field of view presented in Fig. 1. Half of the sources in this field of view are located in a region that stands out as both relatively high in surface density and dominated by sources that are protostellar. Of the YSOs identified, 37 Class I and 11 Class II sources are located within a 25 (0.2 pc) radius circle centered on R.A., Dec. (2000) = 18:30:03, 02:01:58.2, making up the core of the Serpens South Cluster (Fig. 1). In this core, 77% of the YSOs are protostellar, with a mean density of 430 pc-2. This dense grouping appears elongated in an alignment similar to the dust filament seen in absorption (150∘ east of north). The asymmetric distribution suggests that the mean surface density of 430 pc-2 in the core is likely a significant underestimate. To demonstrate this, we note that the median projected distance between nearest neighbor YSOs here is 132, or 3700 AU. Sources uniformly spaced at a density of 430 pc-2 are 214 apart, or 5600 AU.
3.3 YSO Surface Density Mapping
To characterize the two dimensional structure of the Serpens South cluster, we have constructed a nearest neighbor surface density map of all the Spitzer-identified YSOs (Fig. 2). The method used to generate these maps is documented in Gutermuth et al. (2005)333In summary, from each position in a uniform grid, we measure the distance that defines a circle that contains the nearest sources. From this radial distance, a surface density is directly computed as (Casertano & Hut, 1985). , though we have used nearest neighbors here to sample the surface densities at higher fidelity (33% uncertainty; Casertano & Hut, 1985). The elevated density is evident in the center of the map, with a peak density of 1600 pc-2. The apparent boundary contour for the dense cluster core is 590 pc-2, a more reasonable mean surface density than was measured over the poorly matched circular area used in Section 3.2 above. Lower density star formation along the dust filaments is also apparent at densities from 50 to 120 pc-2. The overall structure is elongated, reflecting the same orientation and extent as the filamentary cloud structures seen in absorption (Fig. 1).
4 Putting Serpens South in Context
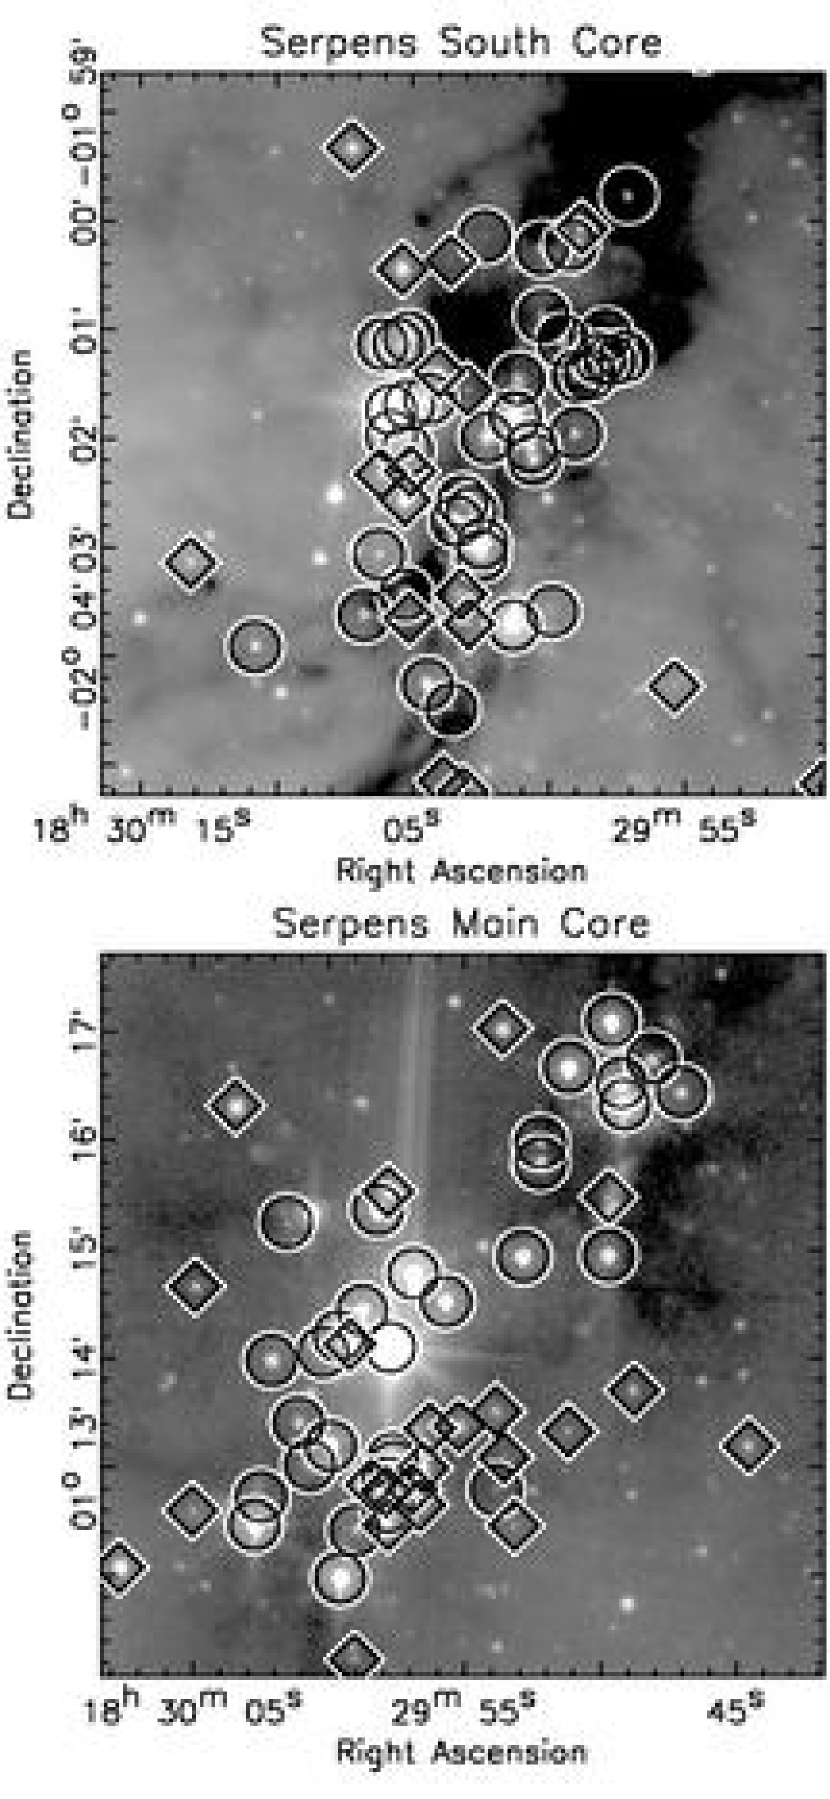
The Serpens South core’s high mean surface density (430 pc-2), exceptionally large fraction of Class I sources (77%), and relatively large membership (48, with 43 more along the 0.5 pc cloud filaments) suggest both a very recent onset of star formation (within the typical lifetime of the protostellar phase, yr, cf. Kenyon & Hartmann, 1995) and high star formation rate (90 Myr-1 in the core, assuming the above protostellar phase lifetime and 0.5 per source). Visually, the region bears some resemblance to the Serpens Main cluster (Harvey et al., 2006; Winston et al., 2007) that we have shown lie at similar distances. In Fig. 3, we present 6.5′ 6.5′ (0.5 pc 0.5 pc) 8 m images of the dense cores of both the Serpens South and Serpens Main clusters, overplotted with the positions of Spitzer identified Class I and Class II sources (Winston et al., 2007). Over these fields of view, the two regions have nearly identical numbers of YSOs with excess infrared emission and similar protostar fractions (55 at 71% and 54 at 57% in Serpens South and Serpens Main, respectively). However, Serpens South is more concentrated and confined to its filament axis than Serpens Main, as evidenced by median nearest neighbor distances between YSOs of 3700 AU and 4800 AU, respectively. These results suggest that Serpens South is at least as young and as prolific a star forming region as Serpens Main, though sampling statistics prevent us from making any claims beyond similarity. At larger scales, both Serpens Main and Serpens South are active star forming sites embedded in larger, less dense, less extinguished distributions of YSOs. Given the high likelihood that both clusters are associated with the Serpens-Aquila Rift and their structural and evolutionary similarity over such a large projected distance from each other (197′ or 15 pc), we speculate that the initial conditions of this region play a strong role in defining these qualities.
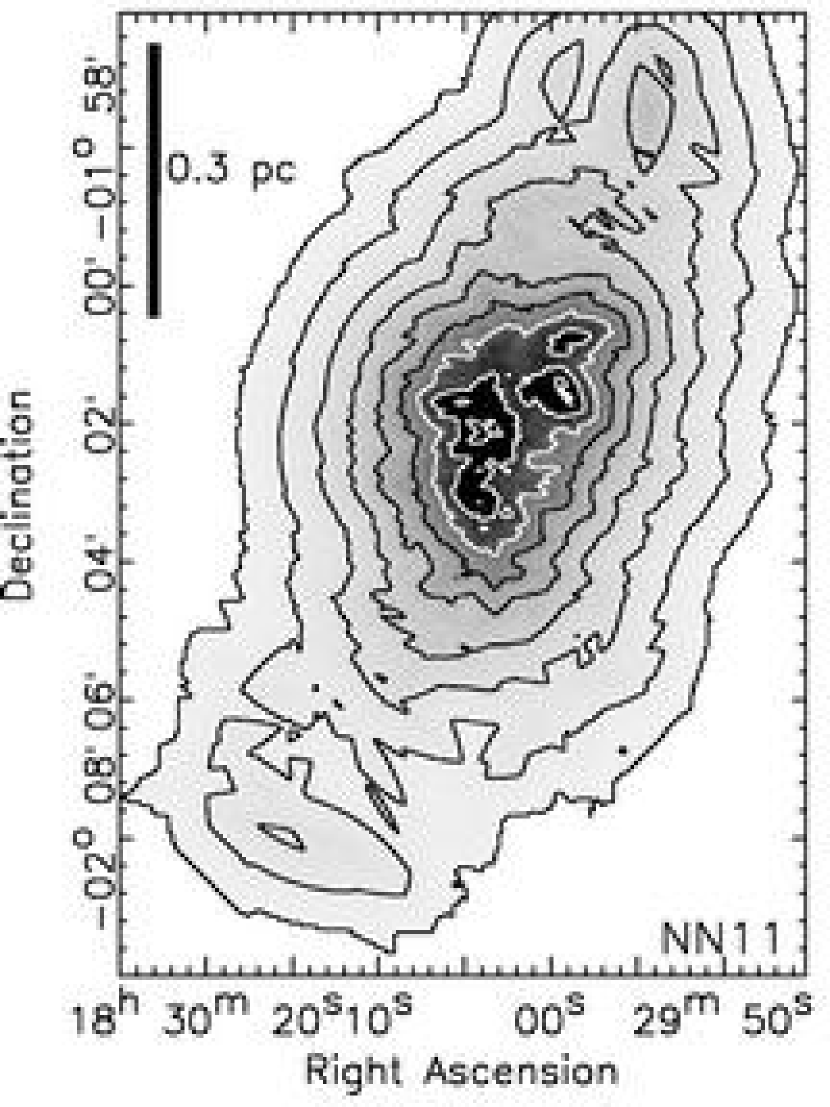
Serpens South joins a growing number of young clusters that are protostar rich and asymmetrically structured. The more typical asymmetric clusters (e.g. NGC 1333, IRAS 20050+2720, GGD 12-15) have evolved to the point that star formation is active throughout most sites of dense gas in their natal clouds. This is supported by their large numbers of protostars (active current star formation), their larger numbers of stars with disks (star formation in the recent past), and the distributions of both YSO types that appear to reflect the typically filamentary dense gas distributions (Gutermuth, 2005; Allen et al., 2007). Serpens South has a particularly high protostar fraction though (59%; NGC 1333 is 29% protostars, excluding transition disks; Gutermuth et al., 2007), and it is part of a dense, dusty cloud filament that is currently forming stars at a rather low surface density compared to the core. If the rest of the filament continues forming stars within the next few yr, we speculate that this region could evolve into an asymmetric cluster of similar number of sources and protostar fraction to the aforementioned asymmetric examples. Therefore, the Serpens South cluster could be described as a protocluster, a region with a sufficiently high star formation rate to produce a large number of stars before gas dispersal processes (outflows, radiation, etc.) from the growing cluster membership terminate the process. Given its close proximity, follow-up observations (e.g. to characterize the gas distribution and kinematics) and detailed analysis should offer a new and unique view of the earliest stages of clustered star formation.
References
- Allen et al. (2007) Allen, L., et al. 2007, Protostars and Planets V, 361
- André & Saraceno (2005) André, P., & Saraceno, P. 2005, ESA Special Publication, 577, 179
- Casertano & Hut (1985) Casertano, S., & Hut, P. 1985, ApJ, 298, 80
- Dame et al. (2001) Dame, T. M., Hartmann, D., & Thaddeus, P. 2001, ApJ, 547, 792
- Evans et al. (2003) Evans, N. J., II, et al. 2003, PASP, 115, 965
- Fazio et al. (2004) Fazio, G. G. et al. 2004, ApJS, 154, 10
- Feigelson et al. (2007) Feigelson, E., Townsley, L., Güdel, M., & Stassun, K. 2007, Protostars and Planets V, 313
- Flaherty et al. (2007) Flaherty, K. M., Pipher, J. L., Megeath, S. T., Winston, E. M., Gutermuth, R. A., Muzerolle, J., Allen, L. E., & Fazio, G. G. 2007, ApJ, 663, 1069
- Grabelsky et al. (1987) Grabelsky, D. A., Cohen, R. S., Bronfman, L., Thaddeus, P., & May, J. 1987, ApJ, 315, 122
- Greene et al. (1994) Greene, T. P., Wilking, B. A., André, P., Young, E. T., & Lada, C. J. 1994, ApJ, 434, 614
- Gutermuth et al. (2005) Gutermuth, R. A., Megeath, S.T., Pipher, J. L., Williams, J. P., Allen, L. E., Myers, P. C., & Raines, S. N. 2005, ApJ, 632, 397
- Gutermuth (2005) Gutermuth, R. A. 2005, PhD thesis, University of Rochester
- Gutermuth et al. (2007) Gutermuth, R. A., et al. 2007, ArXiv e-prints, 710, arXiv:0710.1860
- Harvey et al. (2006) Harvey, P. M., et al. 2006, ApJ, 644, 307
- Ho et al. (2004) Ho, P. T. P., Moran, J. M., & Lo, K. Y. 2004, ApJ, 616, L1
- Kenyon & Hartmann (1995) Kenyon, S. J., & Hartmann, L. 1995, ApJS, 101, 117
- Lada et al. (2006) Lada, C. J., et al. 2006, AJ, 131, 1574
- Megeath et al. (2004) Megeath, S. T., et al. 2004, ApJS, 154, 367
- Morris et al. (2004) Morris, P. W., Crowther, P. A., & Houck, J. R. 2004, ApJS, 154, 413
- Radhakrishnan et al. (1972) Radhakrishnan, V., Goss, W.M., Murray, J.D., & Brooks, J.W. 1972, ApJS, 24, 49
- Reach et al. (2005) Reach, W. T., et al. 2005, PASP, 117, 978
- Ridge et al. (2003) Ridge, N. A.. Wilson, T. L., Megeath, S. T., Allen, L. E., Myers, P. C., 2003, AJ, 126, 286
- Skrutskie et al. (2006) Skrutskie, M. F., et al. 2006, AJ, 131, 1163
- Smith et al. (1985) Smith, J., Bentley, A., Castelaz, M., Gehrz, R. D., Grasdalen, G. L., & Hackwell, J. A. 1985, ApJ, 291, 571
- Smith et al. (2006) Smith, H. A., Hora, J. L., Marengo, M., & Pipher, J. L. 2006, ApJ, 645, 1264
- Straižys et al. (1996) Straižys, V., Černis, K., & Bartašiūtė, S. 1996, Baltic Astronomy, 5, 125
- Straižys et al. (2003) Straižys, V., Černis, K., & Bartašiūtė, S. 2003, A&A, 405, 585
- Vallee et al. (1992) Vallee, J. P., Guilloteau, S., & MacLeod, J. M. 1992, A&A, 266, 520
- Ward-Thompson et al. (2007) Ward-Thompson, D., et al. 2007, PASP, 119, 855
- Werner et al. (2004) Werner, M. W., et al. 2004, ApJS, 154, 1
- White et al. (1995) White, G. J., Casali, M. M., & Eiroa, C. 1995, A&A, 298, 594
- Winston et al. (2007) Winston, E., et al. 2007, ApJ, 669, 493
- Zeilik & Lada (1978) Zeilik, M., II, & Lada, C. J. 1978, ApJ, 222, 896
- Zhu et al. (2006) Zhu, L., Wu, Y.-F., & Wei, Y. 2006, Chinese Journal of Astronomy and Astrophysics, 6, 61