Blue Straggler Stars in the Unusual Globular Cluster NGC 6388111Based on observations with the NASA/ESA HST, obtained at the Space Telescope Science Institute, which is operated by AURA, Inc., under NASA contract NAS5-26555. Also based on WFI observations collected at the European Southern Observatory, La Silla, Chile.
Abstract
We have used multi-band high resolution HST WFPC2 and ACS observations combined with wide field ground-based observations to study the blue straggler star (BSS) population in the galactic globular cluster NGC 6388. As in several other clusters we have studied, the BSS distribution is found to be bimodal: highly peaked in the cluster center, rapidly decreasing at intermediate radii, and rising again at larger radii. In other clusters the sparsely populated intermediate-radius region (or “zone of avoidance”) corresponds well to that part of the cluster where dynamical friction would have caused the more massive BSS or their binary progenitors to settle to the cluster center. Instead, in NGC 6388, BSS still populate a region that should have been cleaned out by dynamical friction effects, thus suggesting that dynamical friction is somehow less efficient than expected. As by-product of these observations, the peculiar morphology of the horizontal branch (HB) is also confirmed. In particular, within the (very extended) blue portion of the HB we are able to clearly characterize three sub-populations: ordinary blue HB stars, extreme HB stars, and blue hook stars. Each of these populations has a radial distribution which is indistinguishable from normal cluster stars.
1 INTRODUCTION
The present work is a continuation of a series of papers exploring the interplay of dynamics and stellar evolution in Galactic globular clusters (GCs), through the detailed study of their peculiar stellar populations. To date we have primarily focused on Blue Straggler Stars (BSS). BSS are brighter and hotter than the Main Sequence (MS) Turnoff (TO) and are thought to form by the evolution of primordial binaries and/or by the effect of stellar dynamical interactions. They are most abundant in the central regions of GGCs, which are usually very congested in the optical bands, but relatively open in the UV. To fully understand the role of dynamics one must track how the population of BSS (or any other population arising from binary evolution or stellar interactions) varies over the entire radial extent of the cluster. The results of the earlier papers in the series are summarized in Table 1.
Of the clusters we have explored so far NGC 6388 is perhaps the strangest. As shown for the first time by Rich et al. (1997), this bulge cluster has an extended blue Horizontal-Branch (HB), despite its high metal content (; Carretta et al., 2007). Such an HB morphology is contrary to expectations: metal-poor clusters usually have predominantly blue HBs, while metal-rich clusters have stubby red HBs. NGC 6388 is a vivid example of the so-called second-parameter phenomenon (see, e.g., Sweigart & Catelan, 1998; Catelan et al., 2006). Moreover, hints for the presence of an intemediate mass black hole (IMBH) at the center of NGC 6388 have been recently inferred from the observed surface brightness profile (which shows a deviation from a flat core behavior in the inner ) and from detailed dynamical modeling (Miocchi, 2007; Lanzoni et al., 2007c). More robust evidence (through kinematics, X-ray and/or radio observations) is needed to confirm this finding.
In this paper we present multi-wavelength observations of NGC 6388. We have combined high-resolution ultraviolet (UV) and optical images of the cluster center obtained with HST, with complementary wide-field observations from the ground, covering the entire cluster extension. The data and photometric reductions are described in § 2. A general overview of the color-magnitude diagram (CMD) is discussed in § 3. The BSS population is described in § 4, and the Discussion is presented in § 5.
2 OBSERVATIONS AND DATA ANALYSIS
2.1 The data sets
We have used a combination of high-resolution and wide-field photometric data sets:
1. The High resolution set consists of a series of public multiband (from the UV, to the optical) WFPC2 and ACS HST images, which have been retrieved from the ESO/ST-ECF Science Archive. The WFPC2 images were obtained through filters (mid-UV) and (), with total exposure times () of 9200 and 1060 s, respectively (Prop. 8718, P.I. Piotto), and trough filters () and (), with and 62 s, respectively (Prop. 6095, P.I. Djorgovski). This combined dataset allows us to examine both the hot (HB and BSS) and the cool (red giant branch and subgiant branch, RGB and SGB, hereafter) stellar populations in the cluster. In this dataset the planetary camera (PC, with the highest resolution of ) was roughly centered on the cluster center, while the wide field cameras (WFCs, at a lower resolution of ) sampled the surrounding outer regions. The photometric reduction of these images was performed using ROMAFOT (Buonanno at al. 1983), a package developed to perform accurate photometry in crowded regions and specifically optimized to handle under-sampled Point Spread Functions (PSFs; Buonanno & Iannicola 1989), as in the case of the WF chips. The ACS dataset is composed of a series of images (Prop. 9821, P.I. Pritzl) obtained through filters () and (), with and 7 s, respectively. It gives complete coverage of the central cluster region out to from the center (see the following section). All the ACS images were corrected for geometric distortions and effective flux (Sirianni et al. 2005). The photometric analysis was performed independently in the two images by using the the aperture photometry code SExtractor (Bertin & Arnouts 1996) and adopting an aperture radius of 3 pixels (corresponding to 015).
2. The Wide field set is a complementary set of public and images obtained with the Wide Field Imager (WFI) mounted at the 2.2m ESO-MPI telescope at La Silla ESO-Observatory and retrieved from the ESO Science Archive. The WFI is a mosaic of 8-CCD chips, each of pixels, with a pixel size of . It has exceptional image capability, with a global field of view (FoV) of . Thanks to such a FoV, this dataset covers the entire cluster extension with the cluster roughly centered on the CCD #7. The WFI images have been corrected for flatness, bias and overscan using IRAF tools. The PSF fitting was performed independently on each image using DAOPHOT (Stetson, 1987).
2.2 Astrometry, Photometric Calibration, and Sample Definition
Using the procedure described in Ferraro et al. (2001, 2003) the WFI catalogue has been placed on the absolute astrometric system. The 8 WFI CCDs have been astrometrized by cross-correlating each of them with the new astrometric 2-MASS catalogue using a specific tool developed at Bologna Observatory. Several hundred astrometric reference stars were found in each WFI chip, thus allowing an accurate absolute positioning of the sources. As a second step, a few hundred stars in the overlapping area between the WFI, and the WFPC2 and ACS FoVs were used as secondary astrometric standards, in order to place the HST catalogs on the absolute astrometric system. At the end of the procedure the rms residuals (that we take as representative of the astrometric accuracy) were of the order of both in RA and Dec.
By using the procedure described in Ferraro et al. (1997, 2001), the photometric calibration of the UV magnitudes ( and ) has been performed in the STMAG system, adopting the Holtzman et al. (1995) zero-points. The optical ( and ) magnitudes have been transformed to the Johnson system by using the stars in common with the catalog of Piotto et al. (2002). Linear transformations were adopted, and only small color equation terms were required to correct the response of the different filter profiles.
Final lists with the absolute coordinates and homogeneous magnitudes for all the stars in the three considered catalogs were obtained. To minimize incompleteness effects in the ground based observations of the crowded central regions of the cluster, while still taking advantage of the superior capability of UV observations in detecting the BSS (Ferraro et al 1999a, 2001), we divided the dataset in two main samples: The HST sample, includes only stars in the WFPC2 and complementary ACS catalogs. It covers approximately the inner of the system (with the WFPC2 FoV almost entirely included in the ACS FoV; see Figure 1). The WFI sample includes only stars observed with WFI and lying beyond the WFPC2 and ACS FoVs. The WFI sample covers the outer regions, well beyond the cluster extension (see Figure 2).
By combining the data sets described above, with additional images of the cluster center obtained with the HST ACS High Resolution Camera, very accurate determinations of the center of gravity, surface density profile, and surface brightness profile have been recently obtained by Lanzoni et al. (2007c). In particular, it has been found that the observed profiles show a deviation from a flat core behavior in the inner , suggesting that NGC 6388 might host an IMBH of in its center. However, by excluding the points at , the density profile is well fit by an isotropic single-mass King model. The resulting cluster structural parameters (concentration, core radius and tidal radius) are listed in Table 2, together with the new estimate of the center of gravity.
3 CMD OVERVIEW
3.1 The HST Sample
The CMDs of the HST sample in the UV and the optical bands are shown in Figures 3 and 4, respectively. As apparent, all of the cluster evolutionary sequences are clearly defined and well populated.
Particularly notable is the Horizontal Branch (HB) morphology. Beside the red clump, which is a typical feature of metal rich stellar populations, the HB clearly shows an extended blue tail (BT), first noticed by Rich et al. (1997) and by Piotto at al. (1997). Among a total of 1763 HB stars counted in the HST sample, five sub-populations can be distinguished (see Sect. 3.1.1 and 3.1.2 for details): (i) the red-HB (RHB) population, consisting of 1418 stars grouped in the red clump; (ii) 15 RR Lyrae variables, which we identified by cross correlating the positions in our catalog with those published by Pritzl et al. (2002) 222Since our photometry is just a snapshot, the position of each variable star in the CMD is not an indication of the mean properties. The remaining stars found within the ”RR Lyrae region” of the CMD, but not included in the Pritzl et al. catalog are not considered in the following analysis, since they possibly are field contaminating stars.; (iii) 267 blue-HB (BHB) stars ; (iv) 26 Extreme-HB (EHB) stars ; and (v) 37 Blue Hook (BHk, to avoid confusion with BH for black hole) stars.
Several previous works have shown that the HB morphology in NGC 6388 is complex. A new extensive study, based on much of the same observational data used here, and also discussing the HB morphology of NGC 6441, has recently been published by Busso et al. (2007). In the present paper we take advantage of the complex HB structure of NGC 6388 to review the HB nomenclature, which has become rather confused in the literature and is often ambiguously used. Then, we briefly discuss the blue HB sub-populations and the HB red clump, the latter being used as cluster reference population for the study of the BSS radial distribution (Sect. 4.2).
3.1.1 The HB population: nomenclature and radial distribution
The HB is composed by helium-core/hydrogen-shell burning stars. It is traditionally split into red, variable, and blue (RHB, VHB, and BHB, respectively), depending on whether the stars are redder than, within, or bluer than, the RR Lyrae instability strip.
The concept of HB blue tails probably originated with the CMD of NGC 6752, which was presented by Russell Cannon at the 1973 Frascati globular cluster workshop, but not published for many years. In visual CMDs of NGC 6752 (and many others to follow), the HB drops downward at high temperature often becoming an almost vertical sequence. This feature looked like a tail hanging from the horizontal part of the BHB, hence the name. Rood & Crocker (1989), Fusi Pecci et al. (1993), and Recio-Blanco et al. (2006) have each suggested ways to measure BTs, and the fact that measures of BTness keep being invented demonstrates a lack of consensus on a definition of BTs. In addition, sub-populations like EHB or BHk stars are sometimes recognized within the observed BTs, even if without a precise observational definition.
The extreme HB population is theoretically well defined: EHB stars lie at the hottest extreme of the zero-age HB (ZAHB), and they do not return to the asymptotic giant branch (AGB), but rather spend their He-shell burning phase as hot AGB-manqué or Post-early AGB stars (for example, Dorman et al., 1993). There is no comparably precise way to observationally select EHB stars. If far-UV (FUV) (e.g., HST F160W) photometry is available, detailed comparisons with stellar models can be made. These suggest that in a few clusters, the transition between BHB and EHB stars may be associated with a gap in the HB morphology (Ferraro et al., 1998). In the present paper we have assumed this to be the case (see below), but at this point that is only an assumption. The importance of EHB stars is also connected with the fact that they and their progeny are thought to be the source of the UV radiation excess observed in the integrated spectra of some elliptical galaxies (Dorman et al 1995; Yi et al. 1998), and one might be able, for example, to determine the age of the galaxy on the basis of its UV excess. In this context NGC 6388 plays a particularly important role, since it is one of the most metal-rich systems containing EHB stars that can be individually observed.
In a few clusters, including NGC 6388, there is an additional population hotter and less luminous than the EHB stars. Following nomenclature used in recent studies, we call this population Blue Hook stars. In visual and even some UV (e.g., ) CMDs, BHk stars appear as fainter extension of the BT and are separated from the EHB population by a gap. While the effective temperature of HB stars can be reasonably well determined from their position along the BT, it is not appropriate to extrapolate this to the BHk. Accurate stellar parameters for BHk stars require FUV photometry (see for example the BHk studies in NGC 2808 and Cen by Moehler et al., 2004). Indeed, it is only in FUV CMDs that the origin of the name “blue hook” becomes apparent.
Not all BT clusters have EHB stars (see the case of NGC 1904 Lanzoni et al., 2007b), and not all clusters with EHB stars have BHk stars (see the cases of M13 and M80 Ferraro et al., 1998). In order to clearly show the difference between cluster with BTs populated up to the EHB region, and clusters with BHk stars, UV photometry is essential. In Figure 5 we compare the () CMDs of NGC 6388 to that of M80 (Ferraro et al. 1997, 1999a). We chose M80 because, among the clusters for which we have a full range of data, it is the one with the HB extending to highest . From comparison with evolutionary tracks in the () plane (Dorman and Rood, unpublished) we know that the M80 HB is populated all the way to the extreme blue-end of the ZAHB. In this plane the HB of M80 shows a clear gap at the transition from BHB to EHB (Ferraro et al., 1998). In Fig. 5 this gap is also visible at . Since there is a corresponding gap in NGC 6388, we tentatively identify the stars with as EHB. The HB sequence of NGC 6388 is significantly more extended than that observed in M80, where there is no analogous population at . For that reason we identify the latter as BHk stars in NGC 6388, as do Busso et al. (2007). The BHk extends well below the cluster TO in the optical CMD: in the plane (see Fig. 6). Because of the uncertainties in detection of these faint stars using optical wavelengths in such crowded regions, our BHk sample is selected from the UV CMD (WFPC2 sample). By using these criteria we have defined the selection boxes sketched in Figs. 3 and 6, and obtained the values quoted in the previous section for the number of HB stars belonging to each sub-population.
It has been suggested that EHB might originate in binary systems (Bailyn 1995), or they were formed through a collisional channel. Indeed, similar stars in the field and in old open clusters have been found to often belong to binary systems (Green et al., 2001; Heber et al., 2002). In contrast, a recent study by Moni Bidin et al. (2006) has found no evidence of binarity in the EHB population of two globular clusters (M80 and NGC5986). The nature of BHk stars is still a matter of debate. They may be related to the so-called late hot flashers (Moehler et al., 2004), or to high helium abundances (Busso et al., 2007). Given that the origin of EHB and BHk stars is still uncertain, it is useful to check whether their radial distributions show any suggestion of binarity or stellar interaction, as it is the case for BSS. We have therefore compared the cumulative radial distributions of the BHB, EHB, and BHk stars to that of RHB stars, which are representative of normal cluster populations (see Sect. 4.2). As shown in Figure 7, all radial distributions are consistent with being extracted from the same parent population, with Kolmogorov-Smirnov (KS) test probabilities of 59%, 46% and 60%, respectively. Thus, the radial distribution of BHB, EHB and BHk populations is consistent with that of normal cluster stars, in agreement with previous findings by Rich et al. (1997), and possibly suggesting a non-binary nature for these systems. However, a binary EHB star could consist of a 0.5 He-burning star with a 0.2 He white dwarf companion, i.e., a total mass smaller than the TO mass and comparable to RHB masses. As a consequence, even if the initial binary mass were large enough to have sunk to the cluster core, the central relaxation time of NGC 6388 is yr (Djorgovski, 1993), less than the HB lifetime, so that an EHB binary could move outward, instead of being segregated into the center.
3.1.2 The red HB clump and the distance of NGC 6388
Since the HB red clump in this cluster is very well defined in the optical CMDs, we have selected the RHB population in this plane, and then used the stars in common between the optical and the UV WFPC2 samples to identify it in the ) CMD. The selected stars are marked as pentagons in Figs. 3 and 6.
With our high-quality data set and such a well defined HB red clump, we have estimated the distance modulus and the reddening of NGC 6388 by comparing its CMD and luminosity function to those of the proto-type of metal-rich GCs: 47 Tuc. As shown in Figure 8, other than the blue HB, the overall CMD properties of NGC 6388 closely resemble those of a normal metal-rich cluster. In order to overlap the CMDs, and align the HB red clump and the RGB bump of the two clusters, the color and the magnitude of NGC 6388 have to be shifted by and , respectively. Thus, by adopting and for 47 Tuc (Ferraro et al. 1999b), we obtain and for NGC 6388. This yields a true (unreddened) distance modulus of , which corresponds to a distance of Kpc (to be compared with 10 Kpc quoted by Harris, 1996).
The proper comparison of the CMDs of the two clusters deserves additional comments. First, NGC 6388 is known to be slightly more metal-rich (; Carretta et al., 2007) than 47 Tuc (; Carretta et al., 2004). However, current theoretical models suggest that such a small overabundance ( dex) would generate just a small difference in the HB absolute magnitude ( mag). Second, the presence of differential reddening of the order of 0.07 (see Busso et al. 2007) can spread the HB red clump, increasing the uncertainties of the entire procedure. However, this contribution is significantly smaller than the conservative estimate of the error in the derived cluster distance, mag. Finally, the morphology of the HB red clump is not exactly the same in the two clusters. However, as discussed by Catelan et al. (2006), who compared the two CMDs by using a reddening-independent quantity, the main difference between the two red HB clumps consists in the fact that the bluer RHB stars in NGC 6388 ( of the total RHB population) are slightly brighter than the average in 47 Tuc. This feature might be interpreted in the framework of a sub-population with a higher helium content. However comparison of the luminosity functions in Figure 8 clearly shows that the relative position of the HB red clump and RGB bump is quite similar in the two clusters. Since the location in magnitude of the RGB bump is quite sensitive to the helium content (see Fusi Pecci et al. 1990), such a nice correspondence clearly demonstrates that at least the main component of the stellar population of NGC 6388 has an helium abundance fully compatible with that of 47 Tuc, while only a minor fraction of the cluster stars could be helium enhanced (this is also in agreement with the findings of Catelan et al. 2006, and Busso et al. 2007). The possible impact on the relative distance of the two clusters derived above is therefore negligible.
3.2 The WFI Sample and Background Contamination
Figure 9 shows CMDs of four radial zones of the WFI sample. The sequences seen in Fig. 4 are still obvious in the interval , but there is also significant contamination from field stars. The CMDs are progressively more contaminated as increases: cluster sequences are barely visible in the region , less so for , and have vanished for . The contamination has two main components (the bulge and the disk populations of the Galaxy): the first is an almost vertical blue sequence with , the second is another vertical sequence with , which clearly indicates the presence of metal rich stars.
Indeed, Figure 9 shows that field contamination is particularly severe in this cluster. For this reason we decided to limit the following analysis to the HST sample, and to use the most external region of the WFI sample () to statistically estimate the field contamination level. We have counted the number of background stars and derived an appropriate background density for each selection box discussed in the paper (see Sect. 4 for the definition of the BSS population). Then, we have used this background density to statistically decontaminate each population in the HST sample, by following a procedure similar to that described by Bellazzini, Ferraro & Buonanno (1999). Table 4 shows the observed sample size and the resulting statistical estimate of field contamination for each of the sub-populations in each radial region of the cluster. Statistical decontamination has the disadvantage that we don’t know whether a given star is a member of a given sub-population or not. However, all of the conclusions of the current paper depend on number counts, so that background correction only increases the noise without affecting the conclusions. Future proper motion studies currently ongoing for this cluster will finally assess the real membership of each star. Preliminary results indicate contamination counts which are in agreement with those listed in Table 4.
4 THE BLUE STRAGGLER STAR POPULATION
4.1 The BSS Selection
Hot populations like BSS and BHB stars are the brightest objects in UV CMDs, while the RGB stars, that dominate the emission of GCs in the optical bands, are faint at these wavelengths. In addition, the high spatial resolution of HST minimizes problems associated with photometric blends and crowding in the high density central regions. Thus HST UV CMDs are the optimal tool for selecting BSS in GCs. Given this, our main criterion for the selection of the BSS population is the position of stars in the () CMD. To avoid incompleteness biases and contamination from TO and sub-giant stars, we adopt a magnitude threshold that is about one magnitude brighter than the TO point: . Figure 3 shows the adopted selection box and the candidate BSS in the UV CMD. Using the BSS in common between the WFPC2 and the ACS FoVs, we have transformed the BSS selection box from the UV plane into the optical plane. To avoid regions with very high risk of Galactic contamination, we have considered only stars with . The resulting candidate BSS in the complementary ACS field are shown in Fig. 6.
The final sample is of 153 BSS in the HST sample: 114 are found in the WFPC2 dataset, and 39 in the complementary ACS sample. The magnitude and the positions of the selected BSS are listed in Table 3, which is available in full size in electronic form.
4.2 The BSS Projected Radial Distribution
In order to study the radial distribution of BSS (or any other population) for detecting possible peculiarities, a reference population representative of normal cluster stars must be defined.
In our previous papers we have used both the RGB or the HB as reference populations. In NGC 6388 the RGB population is affected by a significantly larger field contamination, with respect to the HB. On the other hand, the HB morphology is quite complex, the presence of a BT in such a metal-rich cluster is unusual, and the nature of EHB and BHk stars is still unclear (see Sect. 3.1.1). Instead, the HB red clump is a common feature of similar metallicity GCs, it is bright and well defined both in the UV and in the optical CMDs, and it comprises the majority (80%) of the HB population (see § 3.1). We have verified that RHB and RGB stars share the same radial distribution over the region (), suggesting that RHB stars are indeed representative of normal cluster populations. For all these reasons, we have chosen the RHB as the reference population for NGC 6388.
We first compare the BSS and the RHB cumulative radial distributions. Since we expect a negligible number of field stars contaminating the BSS and RHB sample (see Table 4) no correction has been applied to the observed sample used to construct these cumulative radial distributions. As shown in Figure 10, the trend is bimodal, with the BSS more segregated than RHB stars in the central cluster regions, and less concentrated outward. This result replicates what we found in a number of other clusters and listed in Table 1 (See also for M5 (Warren et al., 2006) and for M55 (Zaggia et al., 1997)). The KS probability that the two populations are extracted from the same parent distribution is .
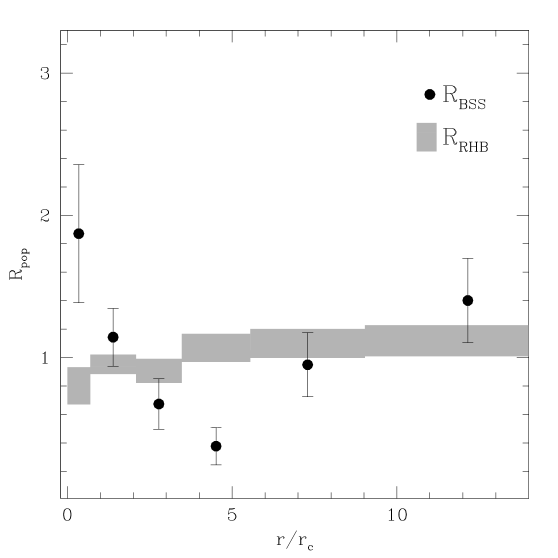
For a more quantitative analysis we have divided the surveyed area in 6 concentric annuli (sketched in Fig. 1), and the number of BSS () and RHB () stars was counted in each annulus (see the values listed in Table 4). We have then computed the double normalized ratio (Ferraro et al. 1993):
where pop=BSS, RHB, refers to statistically decontaminated number counts (see Sect. 3.2), and the luminosity in each annulus has been calculated by integrating the single-mass King model that best fits the observed surface density profile (see Lanzoni et al., 2007c), with the distance modulus and the reddening previously quoted, and by properly taking into account the incomplete spatial coverage of the outermost annulus.
As expected from stellar evolution theory (Renzini & Fusi Pecci 1988), the radial trend of is essentially constant with a value close to unity. On the contrary, the BSS radial distribution is very different and is clearly bimodal. As shown in Figure 11, reaches a value of almost two at the center, while has no central peak. decreases to a minimun near , and rises again near .
5 DISCUSSION
In Figure 12 we have compared the radial distribution of the ratio between the BSS and HB number counts computed for NGC 6388, with that obtained for other GCs showing a bimodal distribution (see for example Lanzoni et al., 2007). The position of the observed minimum in NGC 6388 resembles that of M3, but NGC 6388 has a core radius 3 times smaller. In physical units its minimum is closer to the cluster center than in any previously observed cluster. By equating the dynamical friction timescale (; Binney & Tremaine, 1987, see also Mapelli et al. 2006) to the cluster age (assumed to be Gyr), one can estimate the value of the radius of avoidance (). This is defined as the radius within which all the stars of (the expected average mass for BSS) have already sunk to the core because of dynamical friction effects. As shown in Fig. 12, the position of well corresponds to that of the observed minimum for all the clusters studied to date in a similar way. For NGC 6388, by adopting and as central velocity dispersion and stellar density (Pryor & Meylan, 1993), and by assuming the cluster structural parameters derived from the best-fit King model by Lanzoni et al. (2007c, see Table 2), we have obtained . This is about 3 times larger than the location of observed minimum, thus representing the first case where the two distances do not coincide. This result is quite puzzling and somehow suggests that NGC6388 appears “dynamically younger” than expected on the basis of its structural properties. In fact, our observations suggest that the dynamical friction in this cluster has been effective in segregating BSS (and similar massive objects) out to only 4–5 , whereas the theoretical expectation indicates that, within , all stars with the mass of BSS or their binary progenitors should have already sunk to the center. Note that significantly larger (by a factor of 2) velocity dispersion, or lower (by a factor of 7) central density would be necessary to reconcile the expected and the observed minima. Why is dynamical friction less efficient in this cluster? Could the presence of an IMBH in the cluster center be important? As discussed in Lanzoni et al (2007), the radius of influence of a BH at the center of NGC 6388 is only 0.07 pc or 0.15 , so it is not obvious how it might affect cluster evolution at 5–15 . Perhaps the BSS that we observe at are stars which have “visited” the central region and have been put on highly eccentric orbits by the interaction with the BH. However this effect would probably fill-in the BSS avoidance region in the projected radial distribution.
Could the BHk population, the suspected presence of a central IMBH, the anomalous position of the BSS radius of avoidance be connected to each other? While it is tempting to think that such a connection exists, we are at a loss to what that connection actually is.
References
- Bailyn (1995) Bailyn, C. D. 1995, ARA&A, 33, 133
- Beccari et al. (2006a) Beccari, G., Ferraro, F. R., Possenti, A., Valenti, E., Origlia, L., & Rood, R. T. 2006a, AJ, 131, 2551
- Bellazzini, Ferraro & Buonanno (1999) Bellazzini, M., Ferraro, F. R., & Buonanno, R. 1999, MNRAS307, 619
- Bellazzini et al. (2002) Bellazzini, M., Fusi Pecci, F., Messineo, M., Monaco, L., & Rood, R. T. 2002, AJ, 123, 1509
- Binney & Tremaine (1987) Binney, J., & Tremaine, S. 1987, Galactic Dynamics, (Princeton University Press)
- Buonanno et al. (1983) Buonanno, R., Buscema, G., Corsi, C. E., Ferraro, I., & Iannicola, G. 1983, A&A, 126, 278
- Buonanno & Iannicola (1989) Buonanno, R., & Iannicola, G. 1989, PASP, 101, 294
- Busso et al. (2007) Busso, G., et al. 2007, A&A, 474, 105
- Catelan et al. (2006) Catelan, M., Stetson, P. B., Pritzl, B. J., Smith, H. A., Kinemuchi, K., Layden, A. C., Sweigart, A. V., & Rich, R. M. 2006, ApJ, 651, L133
- Carretta et al. (2004) Carretta, E., Gratton, R. G., Bragaglia, A., Bonifacio, P., & Pasquini, L. 2004, A&A, 416, 925
- Carretta et al. (2007) Carretta, E., et al. 2007, A&A, 464, 967
- Djorgovski (1993) Djorgovski, S. 1993, in ASPC Conf. Ser. 50, Structure and Dynamics of Globular Clusters, ed. S. G. Djorgovski & G. Meylan (San Francisco: ASP), 373D
- Dorman et al. (1993) Dorman, B., Rood, R. T., & O’Connell, R. W. 1993, ApJ, 419, 596
- Dorman et al. (1995) Dorman, B., O’Connell, R. W., & Rood, R. T. 1995, ApJ, 442, 105
- Ferraro et al. (1993) Ferraro, F. R., Fusi Pecci, F., Cacciari, C., Corsi, C., Buonanno, R., Fahlman, G. G., & Richer, H. B. 1993, AJ, 106, 2324
- Ferraro et al. (1997) Ferraro, F. R., Paltrinieri, B., Fusi Pecci, F., Cacciari, C., Dorman, B., Rood, R. T., Buonanno, R., Corsi, C. E., Burgarella, D., & Laget, M., 1997, A&A, 324, 915
- Ferraro et al. (1998) Ferraro, F. R., Paltrinieri, B., Pecci, F. F., Rood, R. T., & Dorman, B. 1998, ApJ, 500, 311
- Ferraro et al. (1999a) Ferraro, F. R., Paltrinieri, B., Rood, R. T., & Dorman, B. 1999a, ApJ 522, 983
- Ferraro et al. (1999b) Ferraro F. R., Messineo M., Fusi Pecci F., De Palo M. A., Straniero O., Chieffi A.,& Limongi M. 1999b, AJ, 118, 1738
- Ferraro et al. (2001) Ferraro, F. R., D’Amico, N., Possenti, A., Mignani, R. P., & Paltrinieri, B. 2001, ApJ, 561, 337
- Ferraro et al. (2003) Ferraro, F. R., Sills, A., Rood, R. T., Paltrinieri, B., & Buonanno, R. 2003, ApJ, 588, 464
- Ferraro et al. (2004) Ferraro, F. R., Beccari, G., Rood, R. T., Bellazzini, M., Sills, A., & Sabbi, E. 2004, ApJ, 603, 127
- Ferraro et al. (2006a) Ferraro, F. R., et al. 2006a, ApJ, 647, L53
- Ferraro et al. (2006b) Ferraro, F. R., Sollima, A., Rood, R. T., Origlia, L., Pancino, E., & Bellazzini, M. 2006b, ApJ, 638, 433
- Fusi Pecci et al. (1990) Fusi Pecci, F., Ferraro, F. R., Crocker, D. A., Rood, R. T., & Buonanno, R. 1990, A&A, 238, 95
- Fusi Pecci et al. (1993) Fusi Pecci, F., Ferraro, F. R., Bellazzini, M., Djorgovski, S., Piotto, G., & Buonanno, R. 1993, AJ, 105, 1145
- Green et al. (2001) Green, E. M., Liebert, J., & Saffer, R. A. 2001, 12th European Workshop on White Dwarfs, 226, 192
- Harris (1996) Harris, W.E. 1996, AJ, 112, 1487
- Heber et al. (2002) Heber, U., Moehler, S., Napiwotzki, R., Thejll, P., & Green, E. M. 2002, A&A, 383, 938
- Holtzman et al. (1995) Holtzman, J. A., Burrows, C. J., Casertano, S., Hester, J. J., Trauger, J. T., Watson, A. M., & Worthey, G. 1995, PASP, 107, 1065
- Lanzoni et al. (2007) Lanzoni, B., Dalessandro, E., Ferraro, F. R., Mancini, C., Beccari, G., Rood, R. T., Mapelli, M., & Sigurdsson, S. 2007, ApJ, 663, 267
- Lanzoni et al. (2007b) Lanzoni, B., et al. 2007b, ApJ, 663, 1040
- Lanzoni et al. (2007c) Lanzoni, B., Dalessandro, E., Ferraro, F. R., Miocchi, P., Valenti, E., & Rood, R.T. 2007c, ApJ, 668, L139
- Lanzoni et al. (2007d) Lanzoni, B., Dalessandro, E., Perina, S., Ferraro, F. R., Rood, R. T., & Sollima, A. 2007d, ApJ, 670, 1065
- Mapelli et al. (2004) Mapelli, M., Sigurdsson, S., Colpi, M., Ferraro, F. R., Possenti, A., Rood, R. T., Sills, A., & Beccari, G. 2004, ApJ, 605, L29
- Mapelli et al. (2006) Mapelli, M., Sigurdsson, S., Ferraro, F. R., Colpi, M., Possenti, A., & Lanzoni, B. 2006, MNRAS, 373, 361
- Miocchi (2007) Miocchi, P. 2007, MNRAS, 381, 103
- Moehler et al. (2004) Moehler, S., Sweigart, A. V., Landsman, W. B., Hammer, N. J., & Dreizler, S. 2004, A&A, 415, 313
- Moni Bidin et al. (2006) Moni Bidin, C., Moehler, S., Piotto, G., Momany, Y., Recio-Blanco, A., & Mendez, R. A. 2006, in ”Globular Clusters: Guides to Galaxies”, March 2006, Concepcion (Chile); astro-ph/0606035
- Piotto et al. (1997) Piotto, G., et al. 1997, Advances in Stellar Evolution, 84
- Piotto et al. (2002) Piotto, G., King, I. R.; Djorgovski, S. G.; Sosin, C.; Zoccali, M.; Saviane, I.; De Angeli, F.; Riello, M.; Recio-Blanco, A.; Rich, R. M.; and 2 coauthors et al. 2002, A&A, 391, 945
- Pritzl et al. (2002) Pritzl, B. J., Smith, H. A., Catelan, M., & Sweigart, A. V. 2002, AJ, 124, 949
- Pryor & Meylan (1993) Pryor C., & Meylan G., 1993, Structure and Dynamics of Globular Clusters. Proceedings of a Workshop held in Berkeley, California, July 15-17, 1992, to Honor the 65th Birthday of Ivan King. Editors, S.G. Djorgovski and G. Meylan; Publisher, Astronomical Society of the Pacific, Vol. 50, 357
- Recio-Blanco et al. (2006) Recio-Blanco, A., Aparicio, A., Piotto, G., de Angeli, F., & Djorgovski, S. G. 2006, A&A, 452, 875
- Renzini & Fusi Pecci (1988) Renzini, A., & Fusi Pecci, F. 1988, ARA&A, 26, 199
- Rich et al. (1997) Rich, R. M., et al. 1997, ApJ, 484, L25
- Rood & Crocker (1989) Rood, R. T., & Crocker, D. A. 1989, IAU Colloq. 111: The Use of pulsating stars in fundamental problems of astronomy, 103
- Sabbi et al. (2004) Sabbi, E., Ferraro, F. R., Sills, A., & Rood, R. T., 2004, ApJ 617, 1296
- Sirianni et al. (2005) Sirianni, M., et al. 2005, PASP, 117, 1049
- Stetson (1987) Stetson, P. B. 1987, PASP, 99, 191
- Sweigart & Catelan (1998) Sweigart, A. V., & Catelan, M. 1998, ApJ, 501, L63
- Warren et al. (2006) Warren, S. R., Sandquist, E. L., & Bolte, M., 2006, ApJ 648, 1026 (W06)
- Zaggia et al. (1997) Zaggia, S. R., Piotto, G., & Capaccioli, M., 1997, A&A, 327, 1004 (Z97)
- Zhao et al. (2006) Zhao, J.-L., Chen, L., & Wen, W. 2006, Chinese Journal of Astronomy and Astrophysics, 6, 435
- Yi et al. (1998) Yi, S., Demarque, P., & Oemler, A. J. 1998, ApJ, 492, 480
| NAME | ARGUMENT | REFERENCES |
|---|---|---|
| M3 | First detection of a BSS bimodal radial distribution | Ferraro et al. 1993,1997 |
| M80 | BSS population in the core | Ferraro et al. 1999 |
| 47Tuc | BSS radial distribution | Ferraro et al. 2003 |
| NGC288 | BSS population in the core | Bellazzini et al. 2002 |
| 47Tuc | BSS dynamical modeling and introduction of zone of avoidance concept | Mapelli et al. 2004 |
| NGC6752 | BSS radial distribution | Sabbi et al. 2004 |
| Cen | The first and so far only flat BSS radial distribution | Ferraro et al. 2006a |
| 47Tuc | BSS chemical signatures | Ferraro et al. 2006b |
| NGC6266 | BSS population in the core | Beccari et al. 2006a |
| – | BSS dynamical modeling of four GCs | Mapelli et al. 2006 |
| M5 | BSS obs and theoretical studies | Lanzoni et al. 2007a |
| NGC 1904 | BSS obs and theoretical studies | Lanzoni et al. 2007b |
| M55 | BSS radial distribution | Lanzoni et al. 2007d |
| Center of Gravity | ||
|---|---|---|
| Concentration () | 1.8 | |
| Core Radius () | 72 | 0.46 pc |
| Tidal radius () | 454″ | 29 pc |
| Distance | 13.2 kpc | |
| Reddening |
| Name | RA | DEC | U | B | V | ||
|---|---|---|---|---|---|---|---|
| [degree] | [degree] | ||||||
| BSS-1 | 264.0713276 | -44.7367013 | 19.586 | 19.232 | 19.995 | — | |
| BSS-2 | 264.0744196 | -44.7337510 | 19.883 | 19.252 | 18.321 | 17.876 | |
| BSS-3 | 264.0662077 | -44.7330923 | 20.279 | 19.453 | 18.507 | 17.842 | |
| BSS-4 | 264.0684376 | -44.7363620 | 20.298 | 19.463 | 18.457 | 17.709 | |
| ……. |
Note. — The complete table is available in electronic form.
| obs | bck | obs | bck | obs | bck | obs | bck | obs | bck | |||
|---|---|---|---|---|---|---|---|---|---|---|---|---|
| 0 | 5 | 22 | 0 | 91 | 0 | 18 | 0 | 1 | 0 | 6 | 0 | 0.08 |
| 5 | 15 | 43 | 0 | 346 | 0 | 57 | 0 | 7 | 0 | 8 | 0 | 0.26 |
| 15 | 25 | 17 | 0 | 221 | 0 | 43 | 0 | 3 | 0 | 5 | 0 | 0.18 |
| 25 | 40 | 10 | 1 | 247 | 1 | 54 | 0 | 3 | 0 | 4 | 0 | 0.17 |
| 40 | 65 | 24 | 2 | 248 | 2 | 52 | 1 | 8 | 0 | 8 | 0 | 0.16 |
| 65 | 110 | 37 | 7 | 237 | 6 | 40 | 1 | 4 | 0 | 6 | 0 | 0.15 |
Note. — The values listed as “obs” correspond to the observed number of stars counted, while those listed as “bck” quote the estimated number of contaminating field stars in each radial annulus (see Sect. 3.2).