Spatially Resolved Imaging at 350m of Cold Dust in Nearby Elliptical Galaxies
Abstract
Continuum observations at 350 m are presented of seven nearby elliptical galaxies, for which CO-gas disks have recently been resolved with interferometry mapping. These SHARC II mapping results provide the first clearly resolved far-infrared(FIR) to submillimeter(submm) continuum emission from cold dust (with temperatures 32 K 22 K) of any elliptical galaxy at a distance Mpc. The measured FIR excess shows that the most likely and dominant heating source of this dust is not dilute stellar radiation or cooling flows, but rather star-formation, that could have been triggered by an accretion or merger event and fueled by dust-rich material that has settled in a dense region co-spatial with the central CO-gas disks. The dust is detected even in two cluster ellipticals that are deficient in H I, showing that, unlike the H I, cold dust and CO in ellipticals can survive in the presence of hot X-ray gas, even in galaxy clusters. No dust cooler than 20 K, either distributed outside the CO disks, or co-spatial with and heated by the entire dilute stellar optical galaxy (or very extended H I), is currently evident.
Accepted and scheduled for ApJ 2008, v677 n1 issue
1 Introduction
Cold gas and dust in nearby elliptical galaxies were detected only fairly recently (Sadler & Gerhard, 1985; Knapp et al., 1989; Lees et al., 1991; Wiklind & Henkel, 1995). Compared to that in spiral galaxies, the cold Interstellar Medium (ISM) in ellipticals is present in relatively small amounts and is seen in only 50% to 80% of nearby ellipticals. The source and content of the cold ISM in these galaxies is still uncertain, with optical and far-infrared (FIR) dust-mass estimates differing by 10 to 100 (e.g., Goudfrooij & de Jong, 1995).
There is some evidence for an internal origin of the dust arising in circumstellar envelopes of red giant stars. This internal origin is supported by the detection of m emission in excess of the stellar emission, with the same de Vaucouleurs profile as the optical stellar images and near- to mid-IR photospheric emission (e.g., Athey et al., 2002). Some have suggested that this dust would come in contact with the hot ISM ( K) and be eroded in thermal collisions with ions and destroyed in only to years (e.g., Schweizer, 1998). However, Mathews & Brighenti (2003) have argued that the dust may induce efficient cooling of the hot gas on a timescale shorter than the destruction lifetimes of the dust in the hot gas, allowing some dust to survive and settle primarily in the centers of the galaxies while the hot gas cools. They propose that if this dust-induced cooling is the dominant evolutionary path of the dust from stars, the thermal energy released by the hot ISM should be re-radiated by dust in the FIR and could be responsible for the central dusty disks and clouds seen in ellipticals.
It has also been suggested that mergers or accretion events that include a gas-rich galaxy may be the dominant source of dust in ellipticals. The total far-IR luminosities (e.g., Temi et al., 2004) and cold gas content (Knapp et al., 1985; Lees et al., 1991) of ellipticals are observed to be uncorrelated with their optical luminosities. This lack of correlation, together with HST detections of irregular dust lanes and filaments with random orientations with respect to the optical major axes (e.g., Tran et al., 2001) is usually interpreted as evidence that the dust has been externally acquired. The external origin is likely to be accretion via the interaction of an elliptical galaxy with a gas-rich spiral, or in mergers of gas-rich spirals that evolve through an FIR-bright (starburst) phase as they relax to form ellipticals (e.g., Toomre & Toomre, 1972; Schweizer, 1998). In fact, if elliptical galaxies are formed through spiral mergers, then starbursts are necessary to produce the high phase-space densities seen in the centers of elliptical galaxies (e.g., Rothberg & Joseph, 2004, and references therein). Numerical simulations by Barnes (2002) have shown that 20% to 60% of the gas from two spirals merging can form relaxed disks of sizes up to 20 kpc, with some of the gas maybe losing angular momentum, falling to the nucleus of the galaxy, and perhaps leading to star-formation.
Observations of dust emission from elliptical galaxies have been made using or primarily (e.g., Knapp et al., 1989; Temi et al., 2004). These measurements favored the warm dust components of the ISM and produced unresolved images of the dust emission. The and derived SEDs of these galaxies clearly show that there are multi-temperature components to the dust. Indeed, the presence of an additional, low-level, very cold ( K) dust component in ellipticals has been suggested by limited detections of unresolved mm and submm emission in some nearby galaxies (Knapp & Patten, 1991; Wiklind et al., 1995; Leeuw et al., 2004; Temi et al., 2004), as well as clearly extended FIR to submm detections from the dust lane in the nearest giant elliptical galaxy NGC 5128 that hosts the active galactic nucleus (AGN) Centaurus A (e.g., Leeuw et al., 2002; Quillen et al., 2006). Observations of CO emission from a number of ellipticals show that many of them contain significant amounts of molecular gas (Lees et al., 1991; Wiklind & Henkel, 1995), but many of these observations do not spatially resolve the CO emission.
Recently, interferometric measurements by Young (2002, 2005) and Wiklind et al. (1997) have spatially resolved the CO (1-0) emission in seven elliptical galaxies with spatial resolutions of 7 and 3 arcsec, respectively. These data imply that the molecular gas is contained mostly in rotating disks lying within the central 5 kpc of the galaxies. This prompted the study by our group to spatially resolve the dust emission in these seven elliptical galaxies. Our goals were (a) to determine the physical properties of the dust coincident with the molecular gas; (b) to see if there are dust associations with other spatial distributions (e.g., stellar distribution); and (c) to determine the most likely heating source (or sources) for the dust. We wanted also to address the question of whether these observed gas disks are the result of external merger/accretion events, as suggested by the optical morphological signatures of the galaxies, or internal mass-losing stars that constitute their elliptical optical components.
The seven galaxies in our sample (NGC 83, NGC 759, NGC 807, UGC 1503, NGC 3656, NGC 4476, and NGC 5666) were all classified by Wiklind & Henkel (1995) as ellipticals, based on the determination that their luminosity profiles follow the de Vaucouleurs law. However, morphologically the sample includes galaxies from different extragalactic environments and represents a spread of possible merger/accretion tracers or ages, from galaxies that have been classified as on-going or early-age major mergers (e.g., NGC 3656, Balcells et al., 2001) to very-late accretion or quiescent systems (e.g., NGC 807, Murray et al., 2000). Recent CCD imaging of some of the galaxies, e.g., NGC 5666 by Donzelli & Davoust (2003), have disputed the classification as ellipticals in favor of SO galaxies, while new optical observations of others, e.g., NGC 83 by Young (2005), have confirmed the elliptical classification.
The sample’s updated environments, general properties, and molecular gas content are summarized in Table 1. The observational merger or accretion signatures of the sample are worthy of note as they fortuitously allow an evolutionary analysis in the context of merger/accretion stages and cold dust and gas properties. These merger/accretion signatures are described further with other observational characteristics of the galaxies in Section 3 below.
2 Mapping Observations using SHARC II at 350m
We observed NGC 83, NGC 807, UGC 1503, and NGC 759 with SHARC II on October 11–14, 2005, and NGC 3656, NGC 4476, and NGC 5666 on April 23 and 29, 2006. SHARC II has a bolometer array with an instantaneous field of view of . We achieved background subtraction and mapping coverage for the galaxies by having the telescope execute a Lissajous scanning pattern with amplitude in azimuth and in elevation. During the observations, we maintained a log of air mass and the zenith water vapor; the telescope dish-segments were kept in optical alignment using the CSO Dish Surface Optimization System (DSOS); and pointing calibrations were executed every hour, allowing us to achieve a FWHM beamsize of and pointing accuracy of about rms. The zenith atmospheric opacity at 225 GHz, during the observations and as measured by the CSO facility radiometer, varied from 0.04 to 0.06.
For flux calibration, we observed either Callisto, Uranus, CRL 618, CRL 2688, Vesta, Arp 220, CIT6, Neptune, or o Cet hourly. The assumed fluxes for the exosolar calibrators are 10.2 Jy/beam for Arp 220, 19.4 Jy/beam for CRL 618, 2.33 Jy/beam for o Cet, 41.6 Jy/beam for CRL 2688, and 2.42 Jy/beam for CIT6, and, for the solar-system calibrators, in October 232 Jy/beam for Uranus, 90.0 Jy/beam for Neptune, 5.77 Jy/beam for Vesta, and in April 95.8 Jy/beam for Callisto. The absolute calibration uncertainty is estimated to be 20%.
The SHARC II contour maps are shown in Figures 1 to 7 and are the result of about 3.0 hours of observing on NGC 83, 7.4 hours on NGC 807, 6.3 hours on UCG 1503, 2.3 hours on NGC 759, 1.9 hours on NGC 3656, 2.4 hours on NCG 4476, and 1.3 hours on NGC 5666. The data were analyzed using the SHARC II reduction software SHARCSOLVE, which iteratively solves for the source image, atmospheric background, and detector gains and offsets. During the iterations, a constraint was applied in the map domain: outside a diameter of or , the source image was assumed to be zero. The diameter was applied to the maps of NGC 807 and UGC 1503, and the diameter applied to those of the other sources. The positional accuracies of the galaxies are based on the pointing observations of the calibration sources. However, to optimize the effective resolution, the coadded images are composed of hour-long sub-images whose centroids have been aligned. This relative alignment was performed for all objects except NGC 807 and UGC 1503, which were too faint and extended to have well-defined centroids after one-hour integrations. The 350 m fluxes of these maps are given in Table 2. The integrated fluxes were obtained in a aperture for NGC 807 and UGC 1503 and a aperture for all the other target objects.
3 Submm Morphology versus Observations from other Wavebands
The goal of this submm wavelength study is to directly map the emission from cold dust that may be co-spatial with the optical dust features and/or the CO gas-disks presented by Wiklind et al. (1997) and Young (2002, 2005) for the sample galaxies, as well as any emission from dust not detected by the optical and CO studies. The presented submm mapping is sensitive to continuum emission from optically-thin dust and, thus, the observations will detect emission from dust that may be deep or in the far-side of the galaxies, and thus not easily visible in the optical images. The detected submm distribution and fluxes are analysed to assess their galactic associations and the possible mechanisms heating the dust; therefore, the submm mapping spatially and physically probes the dust’s origin, in complement with observations at other wavelengths.
Below, the distributions of the mapped submm emission are compared to those of galactic components observed at other wavelengths. Later in Section 5, the observed submm fluxes are used to calculate and analyse the heating of dust by star-formation and other possible submm-emitting, galactic sources.
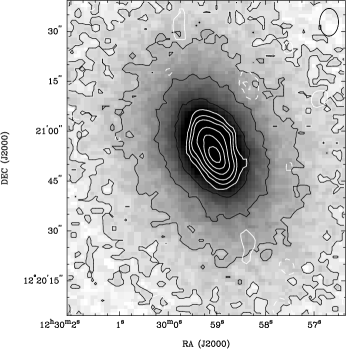
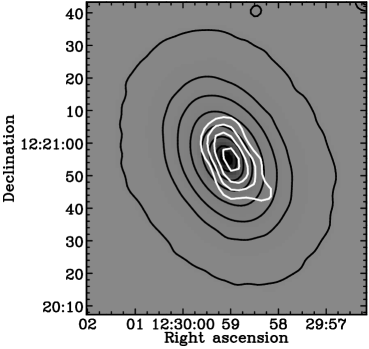
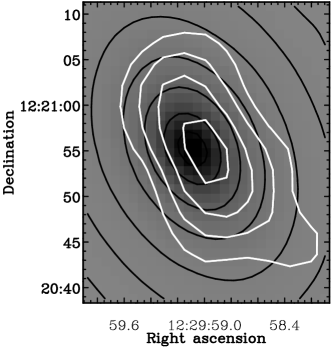
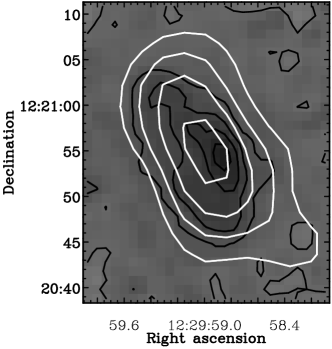
Figures 1 to 7 show contours of the detected 350 m dust continuum for the sample and the total integrated CO(1-0) intensity maps from Young (2002, 2005) and Wiklind et al. (1997), overlayed on the optical Sloan Digital Sky Survey (SDSS) maps, and where there are no SDSS images available on the Digitized Sky Survey 2 (DSS2) images. The SDSS images have more reliable photometry than the DSS2 images; and, the SDSS images are plotted convolved to a beam similar to that of the CSO dust emission images, while the DSS2 images are plotted at their full resolution. Figures 1, 2, and 7 also show SDSS i- minus g-band color or extinction maps and their linear contours in an attempt to show some of the dust’s geometry. For a smooth presentation, these color maps are shown convolved to a beam.
The SDSS and DSS2 intensity contours are percentages of the respective peaks in the maps and are intended to display areas that may be co-spatial at the different wavelengths. The 50%-contour-level diameters determined by eye from these plots after deconvolution are listed in Table 3. For NGC 3656, the optical 50%-contour-level diameter is well off the maps flotted in Figure 1, and therefore only the optical 70%-contour-level diameter is listed in Table 3. These tabulated image sizes were derived after deconvolving beamsizes of for the CO images (except for the size of NGC 759, where a beam was used) and for the submm and SDSS images. For the submm and SDSS images, the diameter measurements done by eye were compared with FWHM diameters from 2D gaussian fits assuming elliptical shapes and agreed to within about %. For the DSS2 images, the diameters listed are from the full resolution maps. The relative percentage contours of the optical maps will be affected by the distribution of dust in these galaxies, therefore the optical intensity contours on those maps are not a simple reflection of the stellar distributions as shown on those maps and listed in Table 3; but rather, they show the stars plus their attentuation by internal galactic dust of varying distributions, and for the DSS2 images may also show saturation from the original photographic images.
The 350 m results show that the detected dust continuum of all the presented ellipticals generally follows the extended CO emission that has been previously detected in these galaxies. This is therefore consistent with emission from cold dust that occurs in dense, gas-rich star-formation regions, as is commonly seen in mapping observations of the Milky Way and other star-forming galaxies (e.g., Seaquist & Clark, 2001) and confirms CO-FIR correlations of unresolved data from elliptical galaxies that have suggested that cold gas and dust co-exist in ellipticals (e.g., Lees et al., 1991). Individual galaxies are discussed in the following sub-sections.
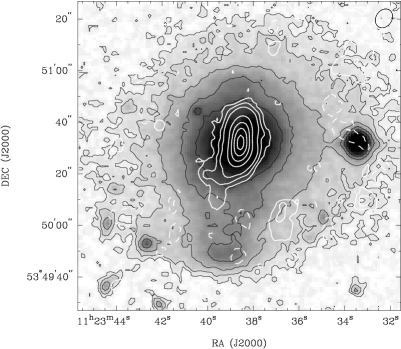
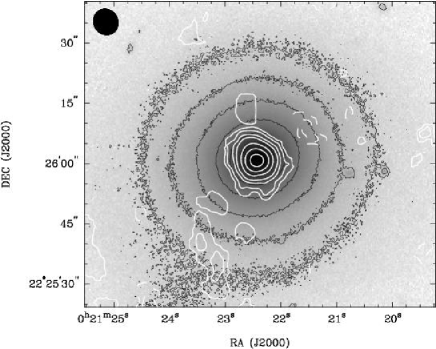
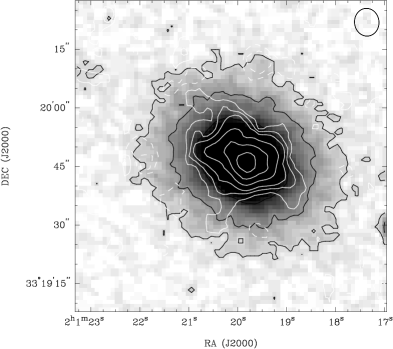
3.1 The Early-Age Major-Merger/Accretion Elliptical NGC 3656
Resolved imaging of NGC 3656 by Balcells et al. (2001) showed that H I occurs in shells and tidal tails that are thought to be signatures of a recent (or early-age), major merger of this galaxy. The H I is more extended than the galaxy’s main optical component. Sensitive CCD optical images of the dust features in NGC 3656 were studied by Balcells (1997) and Rothberg & Joseph (2006), who suggest that the dust is a remnant of a dust-rich merger that involved this galaxy’s primary optical elliptical component.
Figure 1 shows that large-scale, 350 m-dust continuum spurs in the southeast of NGC 3656 generally follow the CO-emission and optical spurs respectively presented by Young (2002) and Balcells (1997). The 350-m continuum spurs also follow the optical spurs shown by Balcells (1997) in the west of this early-merger galaxy. These spurs may be large-scale features of a warped-disk of dust that has been reported in the center of NGC 3656 (e.g. Balcells, 1997) and described further below.
Figure 1 also shows that the extinction contours of NGC 3656 are very asymmetric, depicting strong extinction in the galactic east and dense north-south central dust distribution. The dust in NGC 3656 is probably in a thin, warped disk that provides the strongest extinction where the disk is tangent to the line of slight. In the center, the thin disk is therefore tangent to the line of sight and thus provides the strong optical extinction and submm emission seen there, while it is more face-on or in the background in the western part of the galaxy. In the east of the galaxy, the disk is either more edge-on or in the foreground, and thus exhibits the moderate optical extinction seen there (see Figure 1).
A thin, warped disk similar to that described for NGC 3656 has also been observed in another early-merger galaxy Centaurus A (Leeuw et al., 2002; Quillen et al., 2006), showing similar extinction and submm emission features as seen in NGC 3656. In Centaurus A, it has been speculated that the disk has formed from dust-rich material accreted from a merger that involved a gas-rich spiral galaxy (e.g., Quillen et al., 2006). The similarity of the warped dust-disk together with the H I shells (Balcells et al., 2001) detected in NGC 3656 to those same features observed in Centaurus A suggests these two galaxies have a similar evolutionary history and that NGC 3656 may indeed be a younger, more distant analog of Centaurus A.
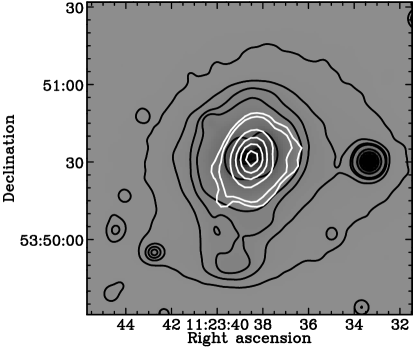
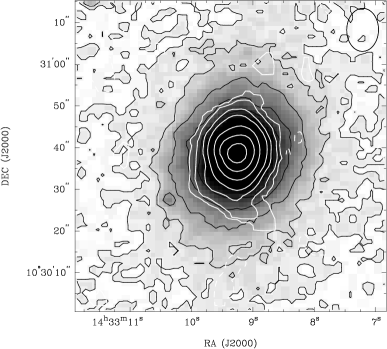
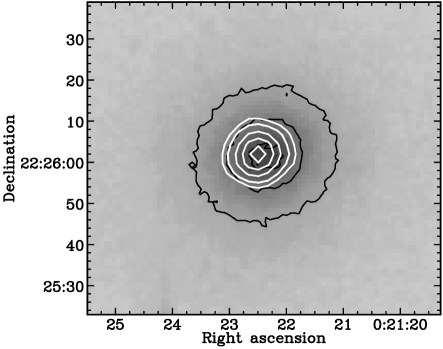
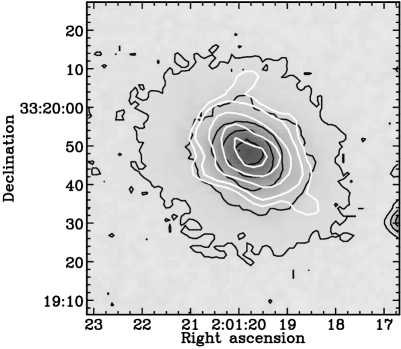
3.2 The Intermediate-Age Merger/Accretion Elliptical NGC 5666
The H I in NGC 5666 extends well beyond the optical galaxy; and, it is in circular orbits that indicate it is in dynamic equilibirum (Lake et al., 1987), since a not too recent (or intermediate-age) merger/accretion event that is thought to have occured in this galaxy (e.g., Donzelli & Davoust, 2003). Using the Canada France Hawaii Telescope (CFHT), Donzelli & Davoust (2003) obtained optical CCD spectroscopy and imaging that revealed a “spiral” dusty structure with tidal tails and H II regions this galaxy. The “spiral” and tidal tails are revealed after subtracting a model of the bulge plus disk of the host galaxy.
Figure 2 shows that CO emission and submm continuum contours of NGC 5666 follow each other in the high-brightness region greater than the 50% contour level. Outside the -radius the CO emission contours are more North-South while the submm ones (which are not detected at a high signal-to-noise) are East-West and slightly more extended than the CO. In the eastern part of the galaxy, the submm and optical SDSS i-band contour levels follow each other down to the 30% level. However, in the western part, these contour only follow each other to the 70% levels. The asymmetry in the contour correspondence supports the idea that the dust distribution or extinction in NGC 5666 is not even, but for example in a “spiral” structure as suggested by Donzelli & Davoust (2003).
Figure 2 also shows a red extinction region within the diameter that coincides with the CO emission and submm continuum peaks and the location of the “spiral” that was revealed in this galaxy by Donzelli & Davoust (2003). This extinction map also shows a patchy region outside -radius that may coincide with foreground dust patches or the location of the optical tidal tails connected to the ”spiral” dusty structure.
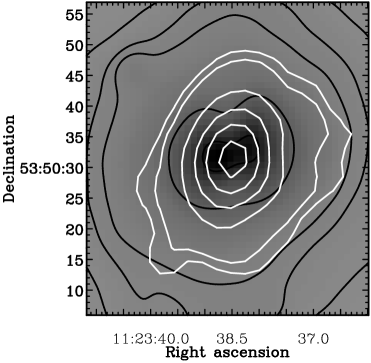
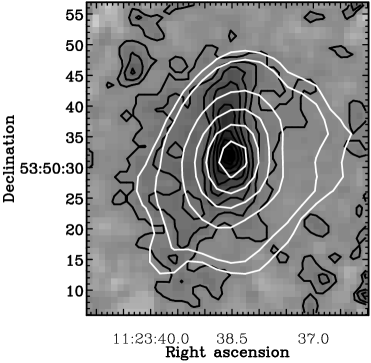
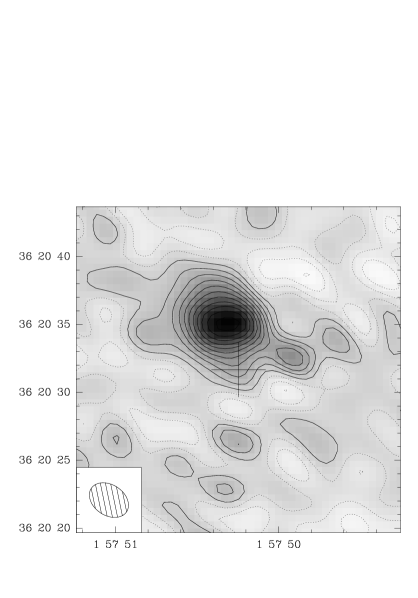
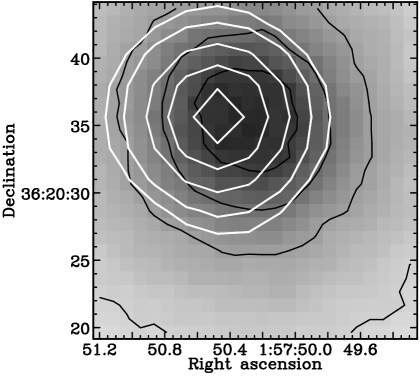
3.3 The “Late-Merger/Accretion” Ellipticals NGC 83 and NGC 759
NGC 083 and NGC 759 are elliptical galaxies with surface brightness profiles that are fit by the law (e.g. Young, 2005; Wiklind et al., 1997). Using deep CCD and images, Young (2005) confirmed in detail that NGC 83 is classically fit by the law from about radii to and that within about radii it has a regular-shaped cold gaseous dust disk. NGC 759 is also an elliptical galaxy in which Wiklind et al. (1997) earlier showed that there is a compact, star-forming, central cold gaseous disk
Consistent with dust emitting components that are likely co-incident with the compact gaseous disk detections in NGC 83 (Young, 2005) and NGC 759 (Wiklind et al., 1997), both these galaxies are not resolved in the submm images presented in Figures 3 and 4. The DSS2 blue and red optical images of these galaxies are saturated; and here, the extinction maps of Young (2005) are compared with SHARC II emission maps of the dust. The compact size derived from the extinction map of the dust disk in NGC 83 by Young (2005) is smaller in extent than the 350 m continuum beam, consistent with the deconvolved, compact submm size of this galaxy measured from the presented data, and that submm emission from the dust-disk of NGC 83 (or NGC 759) being simply unresolvable with SHARC II.
The central disks in NGC 083 and NGC 759 could represent a late stage in the merging of two disk galaxies or accretion of gas-rich material. The gas could have lost momentum in the merging process (or since the accretion) and fallen to the center of the galaxy. If this gas component is capable of forming stars, it could produce the high phase density characteristic of ellipticals.
3.4 The Quiescent or Very-Late-Accretion Ellipticals UGC 1503 and NGC 807
Of the ellipticals presented here, UGC 1503 and NGC 807 are the only object that are (1) field galaxies and (2) have no currently identified optical morphological signatures of a merger or accretion event. Therefore, they are referred to as quiescent or very-late-accretion, to mean that if there has been any possible accretion event during their evolutionary lives, that happened a very long time ago, and the galaxies have now settled beyond any such event. Being field galaxies also means that there is no near neighbor that may have interacted with them in the near past.
UGC 1503 and NGC 807 have intrinsic 50% contours of the CO-emission and 350 m-continuum fluxes that are comparable in extent to and only slightly smaller than those of the optical. These galaxies probably have dust that is distributed in slightly edge-on disks with their near-side in the northeast and northwest for UGC 1503 and NGC 807 respectively. Young (2002) report that in NGC 807, 70% of the CO emission is detected in the south of the galaxy (see Figures 6), suggesting the bulk of the disk’s content is in the southern parts.
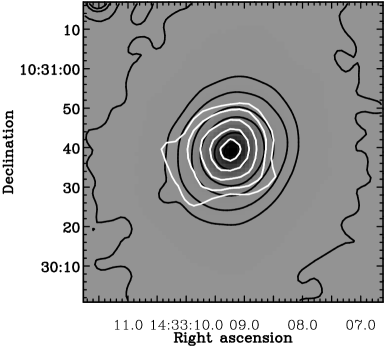
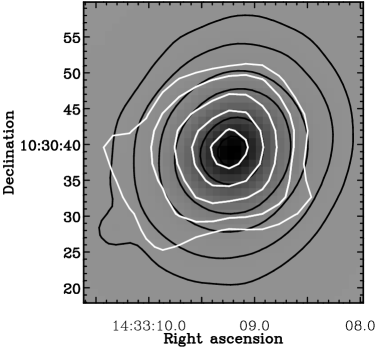
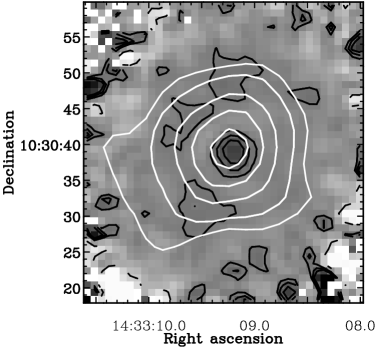
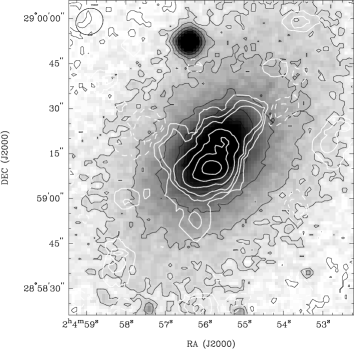
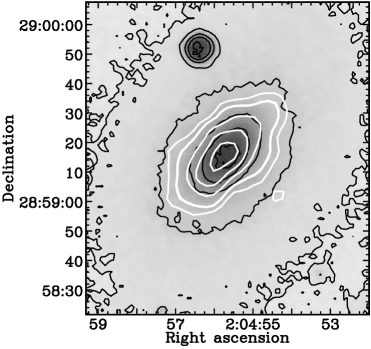
3.5 The Accretion Virgo-Cluster Dwarf Elliptical NGC 4476
Despite directed searches, H I has not been detected in the cluster galaxy NGC 4476 (or NGC 759) (e.g., Lucero et al., 2005); this is in spite of CO-gas detections in these galaxies (Lees et al., 1991; Wiklind & Henkel, 1995; Wiklind et al., 1997; Young, 2002). It is thought the H I may been destroyed by the hot cluster gas or, in the case or NGC 4476, by ram-pressure stripping (Lucero et al., 2005).
Using V (F555W) imaging, van Dokkum & Franx (1995) showed that NGC 4476 has a regular, “spiral-like” dust lane that is about in diameter. They determined a difference of 19 degrees between the major axis position angle of the dust lane and that of the stellar component and used the evidence in this and a sample or other early galaxies to argue that the dust lane in NGC 4476 did not originate from the stellar component but was instead externally accreted. Tomita et al. (2000) confirmed the existence of the regular dust lane using E(V-I) [F555W - F814W] extinction images and showed that NGC 4476 has H II regions. They also noted a blue unresolved nucleus that they suggested may come from a young star cluster(s) associated with the dust system. Young (2002) detected CO gas in a relaxed disk that is co-spatial with the dust lane and has a diameter of about .
Figure 7 shows 350 m-continuum contours of dust emission from NGC 4476 that generally follow the direction of the ellipticity and major axis position angle of those of the CO disk and SDSS-extinction maps except at parts of the 350 m-continuum at 30% flux levels. In the eastern part of the galaxy, the 70%, 50%, and 30% contour levels of the SDSS i-band and SHARC II 350 m (respectively of the stellar and dust components) intensities co-incide quite well. The SDSS extinction image in this region all extends to the 30% SHARC II 350 m contour level. However, in the western part of the galaxy, the correspondence of the contours levels is not so good, suggesting that the dust and stellar disks are not in the same plane. Indeed, the SDSS-color map shows less extinction in the western part of the galaxy, as may be the case if the dust disk is towards the background or inner parts of the galaxy in that region. The 350 m-continuum 50% contour levels along the major axis of the galaxy are more extended than the CO and stellar intensities of the same relative levels. These results suggest that the dust component is separate from the stellar one, as concluded by van Dokkum & Franx (1995) from their data of the central region in this galaxy. The 350 m-continuum 30% contour levels (which are not detected at a high signal-to-noise) are also more extended than the CO and extinction ones and have a spur in the southwest. This emission spur may be part of the dust disk in the eastern background of the galaxy.
The H II regions in NGC 4476 (and NGC 5666) most probably obtain their fuel from the dust seen both in the optical extinction and submm and in turn heat the dust to produce the FIR-submm emission seen in these galaxies. Futher discussion of star-formation, the heating mechanisms, as well as the dust sources are discussed in Section 5 below and will subsequently be analysed in more detail in a follow-up paper that uses mid-IR spectroscopy of these galaxies (Leeuw et al. in prep).
4 The Mid-IR to Submm Spectral Energy Distribution and Luminosities
The mid-infrared (mid-IR or MIR) flux in ellipticals comes primarily from “warm” galactic dust, nebulae, or the envelopes of evolved stars, while the FIR to submm flux comes mainly from cold dust with temperatures, K; and, in the case of radio-bright sources, it can also originate from the high-frequency-radio components. On the other hand, flux in the optical/near-IR comes primarily from the stellar components of K, with negligible contribution to the FIR to submm spectrum. For the radio-faint sources observed in this program, it is assumed that the mid-IR to submm SED emission comes from a cold to cool (5 K K) thermal component plus a mid-IR power-law component that includes PAHs, warm ( K) dust, and stellar galactic components.
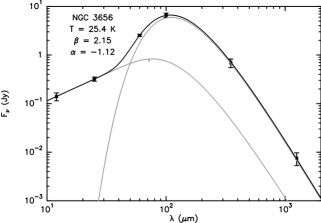
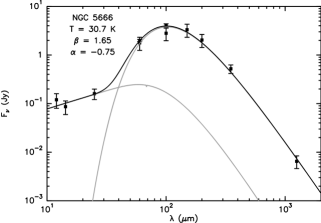
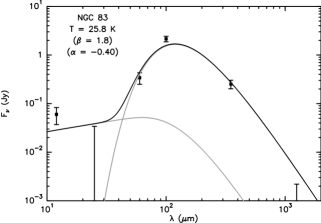
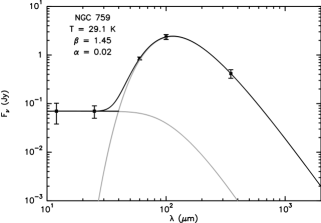
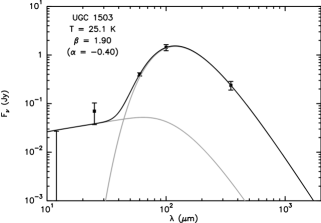
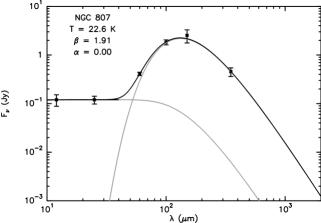
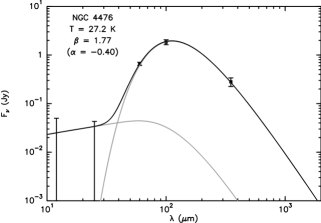
Motivated by the general appearance of the SEDs of the elliptical galaxies and the available data, the SED is modeled with a power law in the mid-IR (8 to 40 m) and a graybody in the far-IR (40 to 2000 m). The Mid-IR power-law fit is not a physical model, but rather a mathematical tool to aid in the calculation of total mid-IR luminosity for the galaxies. However, the graybody fit is an attempt at physically modeling the average temperature, emissivity, and optical depth of the cold dust emission for the galaxies.
The model fits are plotted in Figure 8, and their derived parameters are labeled on the plots as well as listed in Table 4. The power-law model is generated with a truncated temperature distribution, and thus the shape of the mid-IR components shown in the SED plots. For sources which have less than two measurements in the mid-IR, the median power law is assumed. The power law for NGC 4476, which has no mid-IR detection, shows a upper limit in Figure 8. Reasonable temperature and beta are derived for the graybody part of the spectrum for all sources except NGC 83. For that source, it is assumed that the dust emissivity index beta is equal to the median value of 1.8.
Cold dust temperatures and emissivity indices are respectively determined to be between 22 K 31 K and for the sample. These parameters are typical for single-graybody fits to unresolved FIR-to-submm fluxes of dust emitting from elliptical galaxies (e.g., Leeuw et al., 2004; Temi et al., 2004). However, they are about seven degrees cooler than dust temperatures of ellipticals derived from 60 and 100 m flux ratios alone and a fixed (e.g. Wiklind et al. 1995). On the other hand, the dust temperatures are also slightly warmer and the emissivity indices similar to those of dust in the Milky Way Galaxy and nearby spiral galaxies (e.g., Dunne et al., 2000).
The cold dust continuum emission presented here extends over 10 kpc for some galaxies in the sample, is detected at high signal to noise with SHARC II, and is generally co-spatial with previously imaged CO emision (see, e.g., Section 3). Above the 50% contour levels, the submm dust continuum and optical stellar intensities of similar spatial resolution have the same general distribution, suggesting that the dust, CO, and stellar components in the central regions are all co-spatial. The early-merger elliptical NGC 3656, with its disturbed optical morphology, is an exception to this coupling of submm and optical central flux distributions.
The current maps are not detected at high enough significance that proper dust distributions can be discerned below the 30% contour levels. If there exists any dust component for the sample that is cooler or has lower-level emission that perhaps extends over the entire galactic stellar or H I distributions (see, e.g., Section 5), its detection will have to await the next-generation submm detectors such as those that will be on ALMA, , JCMT, or SOFIA. Combining the current data set together with anticipated and other upcoming sensitive FIR-to-submm observations and analysing the SED of mapping data from various FIR-to-submm bands should put tighter constraints on the physical parameters of cold dust in the sample.
MIR-to-submm luminosities ( and ) that were obtained by integrating below the model fits shown in Figure 8 are listed in Table 5 and these can be compared to the optical luminosities () that are also listed in Table 5. The percentage excess MIR-to-submm luminosities over the total luminosities () are determined and also listed in Table 5. For most of the galaxies, the MIR-to-submm excess luminosities are about 20% to 30% of the total luminosities, with about 70% or more of the excess emitted at FIR to mm wavebands as thermal, cold dust emission (see Figure 8 and Table 5). The respective early-age and intermediate-age galaxies NGC 3656 and NGC 5666 have higher than average MIR-to-submm excesses of the total luminosities ( %) for the sample (see Table 5), suggestive of more or denser dust and star-formation or, at least, fairly high MIR-to-submm emission in comparison to total emission in these more recent merger-remnant/dust-accretion galaxies.
5 Estimates of Star Formation Rates and Other Luminosity Sources
The peak 350 m optical depths given in Table 6 were determined using the 350 m continuum fluxes and intrinsic 350 m sizes respectively presented in Tables 2 and 3 for each galaxy. According to Draine (2003), the corresponding peak optical extinctions are about 14,000 times larger than the sub-mm optical depth values, implying peak visual extinctions () greater than 2 mag for all the galaxies in the sample. Therefore, the dust measured at 350 m for these galaxies is dense enough to absorb almost all the UV or optical radiation emitted by any massive star embedded within it.
If the far-IR luminosity, L(FIR), for each galaxy in our sample is due to the reprocessing of radiation from embedded, newly formed stars, then an estimate can be made of the current Star Formation Rate, SFR, in each galaxy using the relation given in Kennicutt (1998)
| (1) |
where L(FIR) includes radiation from 8 through to 1000 m. Table 5 lists the estimate of L(FIR) for each galaxy based on the fits to the data shown in Figure 8. Except for NGC 4476, Equation 1 yields SFR estimates ranging from 1 to 3 for the galaxies in the sample (see Table 6). These rates are similar to the SFR in the Milky Way, a spiral galaxy, but are about 10 times those for ‘normal’ elliptical galaxies. NGC 4476 has a SFR estimate more in line with a normal elliptical galaxy. However, NGC 4476 is exceptional in this sample in that it is a dwarf elliptical near the center of the Virgo cluster.
For the most part, the FIR luminosity given in Table 5 for each galaxy is composed of power radiating at wavelengths longer than 40 m. Based on the SED’s shown in Figure 8, the majority of this FIR power, therefore, could be coincident with the 350 m emission, which seems to be embedded in rotating CO “disks”. Thus, the FIR data and our 350 m data imply for most of the galaxies in our sample, the presence of mini-starbursts inside central rotating disks of gas and dust.
There is another more indirect way to estimate SFR, by using the empirical relationship from Kennicutt (1998) between SFR surface density, , and the molecular gas surface density, :
| (2) |
Estimates of the SFR surface densities at the peaks of the gas distributions in these galaxies have been derived based on the total molecular gas masses (Table 1) and the intrinsic sizes of the CO distributions in these galaxies (Table 3). The product of the SFR surface densities with the intrinsic areas of the CO distributions yield the total SFRs for the galaxies and these are listed in Table 6.
A comparison between the SFR values estimated using the two methods given above would imply that NGC 759 and, especially, NGC 3656 have the potential (in gas) for considerably more star formation than is presently being observed in the FIR, but that the other galaxies in our sample are using their gas reservoirs at about the “normal” rate to form stars.
The discussion above assumes the FIR excess from these galaxies originates from star formation; however, as noted in the Section 1, Mathews & Brighenti (2003) argue that the FIR excess could be due to the thermal energy released by the hot ISM as it cools through thermal electron collisions with dust grains. In this scenario, the central cold dust seen in these elliptical galaxies originates from the settling of the cooled hot dusty gas from mass losing red giants distributed throughout each of the elliptical galaxies, rather than from the gas and dust from recent galaxy merger or accretion events. Mathews & Brighenti (2003) estimated the FIR luminosity radiated from the dust grains involved in the cooling of the hot gas of about for a given total stellar mass-loss rate, , to be approximately
| (3) |
Substituting the FIR luminosity listed for each galaxy in Table 5 gives mass-loss rates ranging from 15 to 340 for this set of galaxies. These rates are much higher than those for giant elliptical galaxies, which are normally . The larger mass-loss rates seem consistent with the larger than normal dust masses at the center of these galaxies as implied by our 350 m data; however, the optical/near-IR luminosity for each galaxy in the sample presented here is similar to normal giant elliptical galaxy optical/near-IR luminosities, so normal stellar mass-loss rates would be expected for these galaxies. Hence, although both the FIR luminosity and the 350 m dust mass estimates are consistent with large stellar mass-loss rates for the galaxies in this sample, the optical/near-IR luminosities for these galaxies are not consistent with such a stellar mass-loss increase.
In summary, the calculations given in this section favor the FIR luminosity of these galaxies resulting primarily from cold dust in the central currently star formation regions that were probably induced and supported by accretion or merger events involving a gas- or dust-rich galaxy or satelite, rather than coming from hot ISM cooling in collisions with dusty gas from stellar mass-loss. However, a small FIR luminosity contribution from the hot ISM cooling, the stellar, or any other dilute galactic radiation field is not excluded.
6 Dust Masses and Gas-to-Dust Mass Ratios
Following Hildebrand (1983), the mass of dust, , that emits mid-IR to submm continuum can be estimated from
| (4) |
where is the measured flux density at frequency , is the distance to the source, the Planck function and the grain mass absorption coefficient where and are respectively the grain radius and density. A recently updated value of (Draine, 2003), as for Galactic dust (cf. above), is assumed, yielding dust masses that range from to for dust with temperatures in the range 22 K K (see Figure 8 and Table 4).
NGC 4476 has the lowest dust mass in the sample. The relative paucity of dust in this galaxy is not surprising as NGC 4476 is a dwarf elliptical. However, Lucero et al. (2005) observed that this galaxy, which lies within the Virgo Cluster, has been stripped of its H I, maybe through ram-pressure; therefore, the presence of any compact distribution of CO and cold dust at all implies that the H I is more vulnerable to ram-pressure stripping than is the denser molecular gas and the dust associated with it within this cluster galaxy.
Table 4 shows that the sample has diverse H2-mass to dust-mass ratios that are mostly between (H2)/, and in the quiescent galaxy NGC 807 and early-merger remnant NGC 3656 respectively range from (about half the average) to (about twice the average). The ratios suggest that, in the central galactic regions where the H2 and dust masses are respectively measured from the resolved CO and our CSO continuum measurements, some of the sample galaxies are relatively under-massive in H2 and over-massive in dust content, while the others are over-massive in H2 and under-massive in dust content. The implications of these mass ratios and their possible association with star-formation or, at least, gas-phases in the central regions of these galaxies will be investigated further in our upcoming paper that uses IRS data to study the MIR spectral evolution and/or star-formation properties of these galaxies.
The total cold-gas-mass (i.e., (H2 + H I)-mass) to dust-mass ratios for the sample are, however, less diverse and in a narrower range of (H2 + H I)/, with NGC 807 and NGC 3656 at much closer ratios of 300 and 387, respectively (see Table 4). At face value, it may appear that the total cold-gas-mass to dust-mass ratio for the sample is about 3 times the value for the Milky Way Galaxy (i.e., (H2 + H I)/). However, in sample objects where H I has been resolved (e.g., Lake et al., 1987; Balcells et al., 2001), the atomic gas has been observed to be much more extended than the inner galactic regions where our observations have mapped dust emission and shown it to be associated with molecular gas. A cold and extended dust component may yet be detected that is associated with the atomic hydrogen, and perhaps massive enough to bring the total cold gas-to-dust mass ratio for the sample in line with the Milky Way value.
7 Summary of Results and Conclusions
SHARC II continuum observations at 350 m have been presented of seven elliptical galaxies with known CO-gas disks (Wiklind et al., 1997; Young, 2002, 2005). The SHARC II mapping provides the first clearly resolved FIR-submm continuum emission from cold dust (with temperatures K 23 K) of any elliptical galaxy Mpc. Calculations of the measured FIR excess show that the dust’s most likely and dominant heating source is not dilute stellar radiation or cooling flows but rather star-formation, that could have been triggered by an accretion or merger event and fueled by dust-rich material that has settled in a dense region co-spatial with the central CO-gas disks. The dust is detected even in two cluster ellipticals that are deficient in H I, showing that, unlike the H I, cold dust and CO in ellipticals can survive among hot X-ray gas, even in galaxy clusters.
Above the 50% contour levels, where the submm detections are of high significance, the submm dust continuum and optical stellar intensities of similar spatial resolution have the same general distribution, suggesting that the dust, CO, and stellar components in the central regions are co-spatial. The early-merger elliptical NGC 3656, with its dense optical dust lane that is thought to be in a highly inclined warped disk, is an exception to this coupling of submm and optical central flux distributions. Below the 50% contour levels, and especially below the 30% levels, the current maps are not detected at high enough significance that proper dust distributions can be discerned.
No dust cooler than 20 K, distributed outside the CO disks, or co-spatial with and heated by the entire, dilute stellar optical galaxy (or very extended H I) is currently evident. These observations clearly show that the FIR-submm emission in our sample ellipticals is primarily from cold dust that is associated with star-formation located in the central parts of these galaxies. The results support the hypothesis that if ellipticals are formed through mergers of gas-rich spirals, their starbursts (1) are necessary to produce the high phase-space density seen in the center of ellipticals and (2) would power the FIR-bright stage as the merger relaxes. Combining the current data set together with anticipated and other upcoming sensitive FIR-to-submm mapping observations may detect or rule-out the existence of larger-scale, diffusely distributed cold dust with an average temperature that is perhaps K (and maybe associated with H I).
Assuming the grain mass absorption coefficient , as for Galactic-like dust (Draine, 2003), the measured submm fluxes and dust temperatures yield dust masses for the sample that range from to . The sample has diverse H2-mass to dust-mass ratios that cover (H2)/, suggesting that in the central galactic regions, where the H2 and dust masses are respectively measured from the resolved CO and our CSO/SHARC II continuum measurements, some of the sample galaxies are relatively under-massive in H2 and over-massive in dust content, while others are the opposite. The possible implications of these mass ratios on star-formation or, at least, gas-phases in the central regions of these galaxies will be investigated further in our upcoming paper that uses IRS data to study the detailed MIR spectral and/or star-formation properties of these galaxies.
The total cold-gas-mass to dust-mass ratios for the sample are in a narrower range of (H2 + H I)/, with a total cold-gas-mass to dust-mass ratio for the sample that, at face value, may appear to be about 3 times the value for the Milky Way Galaxy (i.e., ). However, in sample objects where atomic gas has been resolved (e.g., Lake et al., 1987; Balcells et al., 2001), the H I has been observed to be much more extended than the inner galactic regions where our observations have mapped dust emission that is associated with molecular gas. A cold and extended dust component may yet be detected that is associated with the atomic hydrogen, and perhaps massive enough to bring the total cold gas-to-dust mass ratio for the sample in line with the Milky Way value. As noted above, this may be oberved with future more sensitive FIR/submm detectors such as those that will be on SOFIA, , JCMT, or ALMA.
References
- Athey et al. (2002) Athey, A., Bregman, J., Bregman, J., Temi, P., & Sauvage, M. 2002, ApJ, 571, 272
- Balcells (1997) Balcells, M. 1997, ApJL, 486, L87
- Balcells et al. (2001) Balcells, M., van Gorkom, J. H., Sancisi, R., & del Burgo, C. 2001, AJ, 122, 1758
- Barnes (2002) Barnes, J. E. 2002, MNRAS, 333, 481
- Donzelli & Davoust (2003) Donzelli, C. J. & Davoust, E. 2003, A&A, 409, 91
- Draine (2003) Draine, B. T. 2003, ARA&A, 41, 241
- Dunne et al. (2000) Dunne, L., Eales, S., Edmunds, M., Ivison, R., Alexander, P., & Clements, D. L. 2000, MNRAS, 315, 115
- Goudfrooij & de Jong (1995) Goudfrooij, P. & de Jong, T. 1995, A&A, 298, 784
- Hildebrand (1983) Hildebrand, R. H. 1983, QJRAS, 24, 267
- Kennicutt (1998) Kennicutt, R. C. 1998, ARA&A, 36, 189
- Knapp et al. (1989) Knapp, G., Guhathakurta, P., Kim, D., & Jura, M. 1989, ApJS, 70, 329
- Knapp & Patten (1991) Knapp, G. R. & Patten, B. M. 1991, AJ, 101, 1609
- Knapp et al. (1985) Knapp, G. R., Turner, E. L., & Cunniffe, P. E. 1985, AJ, 90, 454
- Lake et al. (1987) Lake, G., Schommer, R. A., & van Gorkom, J. H. 1987, ApJ, 314, 57
- Lees et al. (1991) Lees, J. F., Knapp, G. R., Rupen, M. P., & Phillips, T. G. 1991, ApJ, 379, 177
- Leeuw et al. (2002) Leeuw, L. L., Hawarden, T. G., Matthews, H. E., Robson, E. I., & Eckart, A. 2002, ApJ, 565, 131
- Leeuw et al. (2004) Leeuw, L. L., Sansom, A. E., Robson, E. I., Haas, M., & Kuno, N. 2004, ApJ, 612, 837
- Lucero et al. (2005) Lucero, D. M., Young, L. M., & van Gorkom, J. H. 2005, AJ, 129, 647
- Mathews & Brighenti (2003) Mathews, W. G. & Brighenti, F. 2003, ApJL, 590, L5
- Murray et al. (2000) Murray, C. M., Oosterloo, T. A., & Morganti, R. 2000, in Bulletin of the American Astronomical Society, Vol. 32, Bulletin of the American Astronomical Society, 1591
- Quillen et al. (2006) Quillen, A. C., Brookes, M. H., Keene, J., Stern, D., Lawrence, C. R., & Werner, M. W. 2006, ApJ, 645, 1092
- Rothberg & Joseph (2004) Rothberg, B. & Joseph, R. D. 2004, AJ, 128, 2098
- Rothberg & Joseph (2006) —. 2006, AJ, 132, 976
- Sadler & Gerhard (1985) Sadler, E. M. & Gerhard, O. E. 1985, MNRAS, 214, 177
- Schweizer (1998) Schweizer, F. 1998, in Saas-Fee Advanced Course 26: Galaxies: Interactions and Induced Star Formation, ed. R. C. Kennicutt, Jr., F. Schweizer, J. E. Barnes, D. Friedli, L. Martinet, & D. Pfenniger, 105
- Seaquist & Clark (2001) Seaquist, E. R. & Clark, J. 2001, ApJ, 552, 133
- Temi et al. (2004) Temi, P., Brighenti, F., Mathews, W., & Bregman, J. 2004, ApJS, 151, 237
- Tomita et al. (2000) Tomita, A., Aoki, K., Watanabe, M., Takata, T., & Ichikawa, S.-i. 2000, AJ, 120, 123
- Toomre & Toomre (1972) Toomre, A. & Toomre, J. 1972, ApJ, 178, 623
- Tran et al. (2001) Tran, H. D., Tsvetanov, Z., Ford, H. C., Davies, J., Jaffe, W., van den Bosch, F. C., & Rest, A. 2001, AJ, 121, 2928
- van Dokkum & Franx (1995) van Dokkum, P. G. & Franx, M. 1995, AJ, 110, 2027
- Wiklind et al. (1995) Wiklind, T., Combes, F., & Henkel, C. 1995, A&A, 297, 643
- Wiklind et al. (1997) Wiklind, T., Combes, F., Henkel, C., & Wyrowski, F. 1997, A&A, 323, 727
- Wiklind & Henkel (1995) Wiklind, T. & Henkel, C. 1995, A&A, 297, L71
- Young (2002) Young, L. M. 2002, AJ, 124, 788
- Young (2005) —. 2005, ApJ, 634, 258
| Source | Type | Environment, Notables, & | |||||
|---|---|---|---|---|---|---|---|
| Merger or Accretion Stage | [ | [ | [M | [ | |||
| ] | ] | pc] | ] | mag | |||
| NGC 3656 | Ep | Early-Age Major Merger/Accr.? | 47 | 11 | 45 | 16 | |
| NGC 5666 | cE2/SO | Intermediate Merger/Accr.? | 5.7 | 10 | 35 | 6 | 0.86 |
| NGC 83 | E0 | Group Member, Late Merger/Accr.? | 20 | 85 | 44 | 1.12 | |
| NGC 759 | E0/1 | Cluster A262, Late Merger/Accr.? | 24 | 24 | 66 | 34 | 1.05 |
| NGC 807 | E3 | Field, Quiescent / Very-Late Accr.? | 14 | 61 | 64 | 31 | 0.97 |
| UGC 1503 | E1 | Field, Quiescent / Very-Late Accr.? | 18 | 16 | 69 | 16 | |
| NGC 4476 | dE5p/SO | Virgo Cluster, Dwarf Merger/Accr.? | 1.1 | 1 | 18 | 3 | 0.85 |
| Source | Peak @350m | Total | Total | Total | Total | Total |
|---|---|---|---|---|---|---|
| (mJy/ beam) | 350m (Jy) | 100m (Jy) | 60m (Jy) | 25m (Jy) | 12m(Jy) | |
| NGC 3656 | ||||||
| NGC 5666 | ||||||
| NGC 83 | ||||||
| NGC 759 | ||||||
| NGC 807 | ||||||
| UGC 1503 | ||||||
| NGC 4476 |
| Source | @50% 350 Flux | @50% CO Flux | @50% SDSS i-Band Flux | |||
|---|---|---|---|---|---|---|
| or ∗ @50% DSS2 Red Flux | ||||||
| arcs arcs | kpc kpc | arcs arcs | kpc kpc | arcs arcs | kpc kpc | |
| NGC 3656 | 3.8 | |||||
| NGC 5666 | ||||||
| NGC 83 | saturated | saturated | ||||
| NGC 759 | saturated | saturated | ||||
| NGC 807 | ||||||
| UGC 1503 | ||||||
| NGC 4476 | ||||||
| Source | |||||
|---|---|---|---|---|---|
| [K] | [] | ||||
| NGC 3656 | 25.4 | 2.2 | 15 | 313 | 387 |
| NGC 5666 | 30.7 | 1.6 | 4.8 | 119 | 327 |
| NGC 83 | 25.8 | (1.8) | 19 | 105 | |
| NGC 759 | 29.1 | 1.5 | 15 | 160 | 320 |
| NGC 807 | 22.6 | 1.9 | 25 | 56 | 300 |
| UGC 1503 | 25.1 | 1.9 | 12 | 150 | 283 |
| NGC 4476 | 27.2 | 1.8 | 0.9 | 122 | 233 |
| Source | % | % | |||
|---|---|---|---|---|---|
| [ | [ | [ | as | as | |
| ] | ] | ] | |||
| NGC 3656 | 14.0 | 17.8 | 33.8 | 53 | 41 |
| NGC 5666 | 5.4 | 6.8 | 12.8 | 53 | 42 |
| NGC 83 | 11.7 | 13.8 | 57.8 | 24 | 20 |
| NGC 759 | 10.9 | 13.8 | 47.8 | 29 | 23 |
| NGC 807 | 8.1 | 12.6 | 43.6 | 29 | 18 |
| UGC 1503 | 6.9 | 8.3 | 24.3 | 34 | 28 |
| NGC 4476 | 0.6 | 0.7 | 3.7 | 19 | 16 |
| Source | 350 | AV | Total | Total |
|---|---|---|---|---|
| Peak | FIR SFR | CO SFR | ||
| /yr | /yr | |||
| NGC 3656 | 0.00119 | 17 | 3.04 | 26.89 |
| NGC 5666 | 0.00050 | 7 | 1.17 | 1.17 |
| NGC 83 | 0.00171 | 24 | 2.65 | 6.13 |
| NGC 759 | 0.00206 | 29 | 2.41 | 10.38 |
| NGC 807 | 0.00018 | 25 | 2.17 | 1.73 |
| UGC 1503 | 0.00015 | 2 | 1.44 | 2.83 |
| NGC 4476 | 0.00047 | 7 | 0.14 | 0.28 |