Chemical and thermal structure of protoplanetary disks as observed with ALMA
Abstract
We predict how protoplanetary disks around low-mass young stars would appear in molecular lines observed with the ALMA interferometer. Our goal is to identify those molecules and transitions that can be used to probe and distinguish between chemical and physical disk structure and to define necessary requirements for ALMA observations. Disk models with and without vertical temperature gradient as well as with uniform abundances and those from a chemical network are considered. As an example, we show the channel maps of HCO+(4-3) synthesized with a non-LTE line radiative transfer code and used as an input to the GILDAS ALMA simulator to produce noise-added realistic images. The channel maps reveal complex asymmetric patterns even for the model with uniform abundances and no vertical thermal gradient. We find that a spatial resolution of and 0.5–10 hours of integration time will be needed to disentangle large-scale temperature gradients and the chemical stratification in disks in lines of abundant molecules.
1 Introduction
The cradles of planet formation – protoplanetary disks – are ubiquitous around young stars, at least of low and intermediate masses (). It is imperative to study disk structure and evolution in detail if one aims to understand initial conditions for planet formation. These objects are best studied at (sub-)millimeter wavelengths in thermal dust continuum and various molecular lines tracing their physical and chemical structure. However, being small ( AU) and of relatively low mass (), such disks are hard to study observationally as high spatial resolution and sensitivity are required. To date only several nearby disks around T Tauri and Herbig Ae/Be stars have been spatially resolved in a handful of molecular lines (Bergin et al., 2007). These observational data coupled to advanced modeling allowed us to constrain basic disk parameters such as size, mass, temperature, density distribution, kinematics, and ionization structure (e.g., Semenov et al., 2005; Qi et al., 2006; Piétu et al., 2007; Dutrey et al., 2007). An interesting result concerns the vertical temperature gradient that seems to be present in some disks (e.g., DM Tau (catalog ), AB Aur (catalog )) while absent in others (e.g., LkCa 15 (catalog )), see Piétu et al. (2005, 2007).
The situation will change dramatically when the Atacama Large Millimeter Array (ALMA), equipped with 50 12-m antennas, will come into operation in 2012. ALMA will be capable of imaging protoplanetary disks at spatial resolutions up to in a frequency range between 100 and 950 GHz. This will allow direct detection and characterization of disk instabilities, resulting in clumpy structures (vorticities, “spiral arms”, etc.) as well as inner gaps and holes induced by forming giant planets (Wolf et al., 2002a; Wolf & Klahr, 2002b; Wolf & D’Angelo, 2005; Narayanan et al., 2006). The large-scale chemical structure of protoplanetary disks will become accessible in rotational lines of many abundant molecules (Asensio Ramos et al., 2007; Krumholz et al., 2007). As demonstrated by Pavlyuchenkov et al. (2007), excitation of molecular lines in disks with strong gradients of physical conditions and chemical structure can be a complicated process and may be hard to interpret.
The main aim of this work is to unravel the potential of ALMA to distinguish between various temperature and chemical effects in protoplanetary disks, with an emphasis on discerning spatial resolution and integration time needed for this goal. Such observations will allow us to fully explore the validity of state-of-the-art disk chemical models on a global scale for the first time, and advance our understanding of the disk physics enormously. In contrast to previous studies of Narayanan et al. (2006) and Krumholz et al. (2007), we take into account both the non-LTE excitation and realistic chemical structure.
2 Disk models
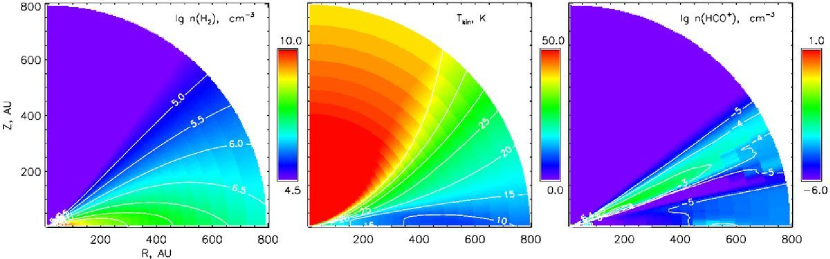
We adopt a steady-state flared disk model with a radius of 800 AU, an accretion rate yr-1, a viscosity parameter , and a mass of (D’Alessio et al., 1999). The disk has a microturbulent velocity of 0.1 km s-1 and a Keplerian rotation profile, . This disk model resembles the disk around the young T Tauri star DM Tau located at the distance of pc (Dutrey et al., 2007). Its thermal and density structure is shown in Fig. 1 (left and middle panels). To mimic the case when the vertical temperature gradient is weak or absent, we also consider the same disk model, but with a vertical temperature distribution fixed to the value at one pressure scale height.
Using both disk models, 5 Myr of disk chemical evolution is modeled with a gas-grain chemical model from Vasyunin et al. (2007). The gas-phase reaction data are adopted from the RATE 06 database (Woodall et al., 2007). Ionization and dissociation of the gas-phase species as well as desorption of surface species due to cosmic rays, stellar X-rays, stellar and interstellar UV radiation are taken into account. The disk is illuminated by UV radiation from the central star with an intensity at AU and by interstellar UV radiation with intensity (Draine, 1978; van Dishoeck, 1988). The X-ray ionization rate in a given disk region is computed according to Glassgold et al. (1997). The adopted cosmic-ray ionization rate is 1.310-17 s-1 (Spitzer & Tomasko, 1968). Molecules are assumed to stick to grains with 100 efficiency. We also consider dissociative recombination of ions on charged dust grains and grain re-charging, with a dust-to-gas mass ratio of . To model surface chemistry on the m olivine grains, a set of surface reactions from Hasegawa, Herbst, & Leung (1992) and Hasegawa & Herbst (1993) is used.
In what follows, we will concentrate on HCO+ – a representative abundant molecule that traces the ionization fraction and possesses strong rotational transitions, and which is readily observed in disks (Dutrey et al., 2007). The modeled distribution of the HCO+ absolute abundances (molecules cm-3) in the DM Tau disk at 5 Myr is shown in Fig. 1 (right panel). A layered chemical structure with the maximal HCO+ concentration reached at intermediate disk heights is clearly visible. Many observed species have a similar stratification, e.g., CO, CS, HCN, etc. (Aikawa & Herbst, 1999; Vasyunin et al., 2007).
Strong turbulent mixing and/or global advection flows can smooth these abundance gradients, leading to more uniformly distributed abundances (Willacy et al., 2006; Semenov et al., 2006). Therefore, we also consider a model with an uniform HCO+ abundance of relative to H2. Thus, our study is based on three disk models: (1) the model with chemical stratification and vertical temperature gradient, (2) the same model but with uniform abundances, and (3) the model with uniform abundances and no vertical temperature gradient.
3 Synthetic channel maps
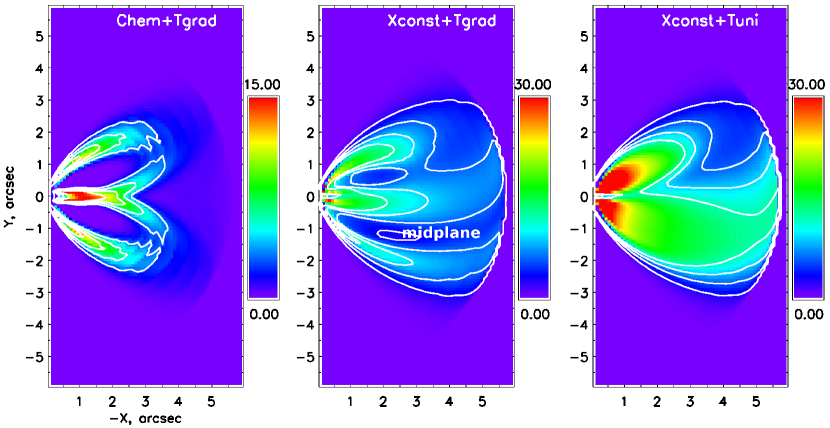
Using these three DM Tau-like disk models, and the 2D non-LTE line radiative transfer code of Pavlyuchenkov et al. (2007) with thermal dust continuum included, we synthesize “ideal” (beam-unconvolved) channel maps. The collisional rates are taken from the Leiden Atomic and Molecular Database111http://www.strw.leidenuniv.nl/~moldata/ (Schöier et al., 2005), while dust opacities for silicate grains are from Draine & Lee (1984). At the inclination the integrated HCO+(4-3) line width is about 3 km s-1, with a peak intensity reached at about 0.8 km s-1 (see Fig. 10 in Pavlyuchenkov et al., 2007). The corresponding km s-1 wide velocity channel at km s-1 of the continuum-subtracted HCO+(4-3) map is shown in Fig. 2.
This close to edge-on orientation is particularly favorable as the layered and uniform disk chemical structures can be clearly distinguished in the channel maps, if sufficiently small channel widths of km s-1 are used. All synthetic channel maps reveal a complex pattern and are asymmetric. The model with both non-zero temperature and abundance gradients has a remarkable “omega” shape, where the cold midplane with low HCO+ concentration appears as two intensity “holes” (Fig. 2, left panel). A steep temperature gradient in radial direction toward the inner disk region is clearly visible, while the vertical temperature gradient cannot be fully traced with the HCO+ lines due to strong chemical stratification of this species. The HCO+(4-3) emission is thermalized and optically thin in this case.
The two models with uniform abundances have relatively high HCO+ column densities so that self-absorption becomes important. In the model with fixed vertical temperature this effect leads to a layer with low intensity in the upper part of the map (Fig. 2, right panel). However, the overall intensity of the HCO+(4-3) emission is higher compared to the model with layered abundances. The radial temperature gradient is also prominent in this case.
The model without chemical stratification but with vertical temperature gradient also reveals the self-absorption layer in the upper part of the channel map. The excitation temperature of the HCO+(4-3) transition changes strongly with the disk height and has the lowest value in the midplane. This zone of low intensity appears as a fake “spiral arm” in the lower part of the map (marked as “midplane” in Fig. 2, middle panel). Note that such a pattern somewhat resembles the “omega” structure for the model with chemical stratification of HCO+. While we show only one representative channel, one should bear in mind that analysis of the interferometric data is more reliable when all channels and dust continuum emission are taken into account.
4 ALMA observations
Despite the fact that all the models considered can be distinguished in the synthetic channel maps, it is important to study whether ALMA is able to disentangle the effects of thermal and chemical structure in disks. To simulate the observations with ALMA, we use the synthetic HCO+(4-3) channel maps as an input to the GILDAS simulation software of Pety et al. (2001) (version from October 2007). A position close to DM Tau is assumed: h 33m 48s, (Ducourant et al., 2005). We focus on the km s-1 channel (with 120 kHz bandwidth or km s-1 velocity width). Array configurations with 64 antennas built in GILDAS are considered. Note that in reality ALMA will consist of 50 antennas with different configurations, so our analysis will tend to underestimate required observing time by a factor of 1.5 but the simulated spectra will not be significantly affected.
Typical weather conditions at the Chajnantor plateau are assumed (see Pety et al., 2001), with the following main types of errors leading to noise: 1) receiver temperature is 80 K, system temperature is 230 K (at GHz, see Guilloteau, 2002), 2) random pointing errors during the observation are , 3) relative amplitude errors are 3% with a 6% hour-1 drift, 4) residual phase noise after calibration is , 5) anomalous refraction. The object is assumed to pass the meridian in the middle of a single observational run. We use 30 minutes of integration time or increase it such that the deconvolved maps look similar to the input model with chemical gradients. In contrast to modern interferometric facilities there will be no problem to achieve a good coverage with ALMA in a fraction of an hour.
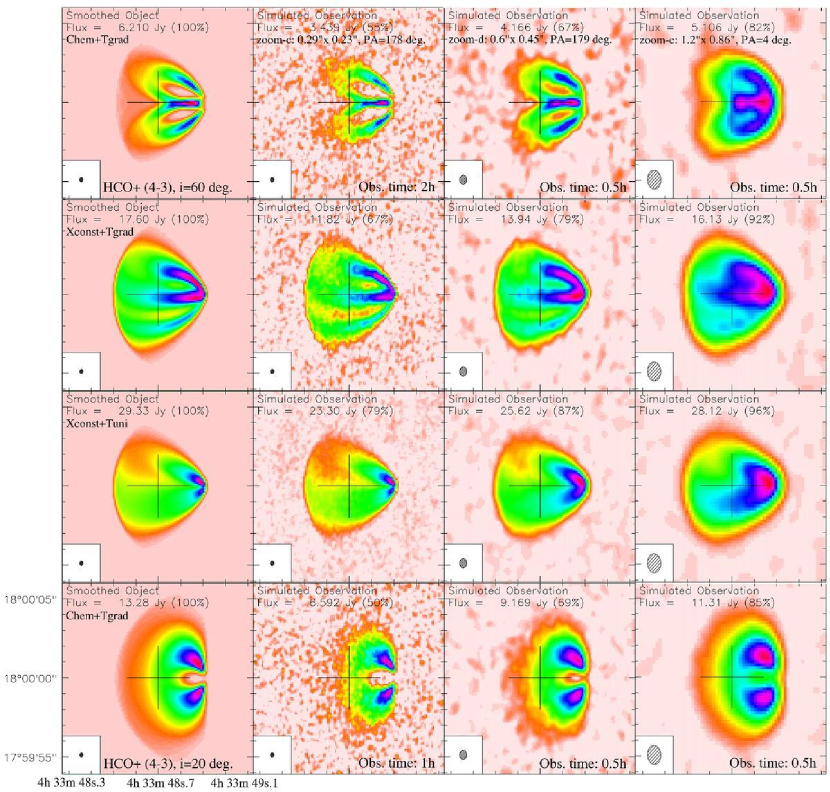
The simulated ALMA channel maps of HCO+(4-3) at various spatial resolutions for the three adopted models and the inclination angle of are presented in Fig. 3 (upper 3 rows). All significant features that are present in the “ideal” molecular emission spectra appear clearly at the resolution of (“zoom-c” array configuration) and some are still visible at half the resolution (“zoom-d” configuration). The use of even lower resolution (“zoom-e”) makes it difficult to disentangle the chemical and thermal features without extensive modeling. The DM Tau disk model with layered HCO+ abundances and 2D temperature gradient has the lowest line intensities and hence requires the longest observation of 2 hours, while for the models with uniform HCO+ abundances it can be as short as 30 minutes or less.
In addition, we perform a similar analysis for a face-on orientation with . At such low inclination channel maps for distinct disk models look similar and multi-line, multi-molecule analysis become a must. The corresponding km s-1 channel of the HCO+(4-3) channel map for the disk model layered abundances is presented in Fig. 3 (bottom row). This channel map has a ring-like shape with two emission peaks located around the low-intensity midplane. The intensity in this channel is by a factor of 2 stronger than for the disk model with and thus the observational time required to detect all these features is only 1 hour with the beam size and less than 30 minutes at lower resolutions. All major features in the channel map are resolved even with the compact “zoom-e” array configuration.
Given the importance of multi-line observations and ability of ALMA to simultaneously observe several transitions of several species in various frequency bands, we continue our study for other observationally important molecular tracers (CS, HCN, CO isotopes) as well as a smaller disk with a radius of AU. All results are summarized in Table 1. The channel maps for other transitions at millimeter wavelengths and for molecules located in the intermediate layer are similar to that of HCO+, though their intensities are vastly different. We find that smaller disks are better studied at high frequencies of 400–700 GHz with moderately extended array configurations leading to smaller beam sizes than at millimeter wavelengths, albeit longer integration times are required for that. The contamination of the high-lying emission lines by the optically thick dust continuum from the disk inner regions and non-LTE excitation can be an issue for the analysis of these high-frequency data.
The molecular lines also comprise kinematic information. High-quality ALMA spectra will allow to derive accurate dynamical masses of the central stars and thus calibrate pre-main-sequence evolutionary track models (Simon et al., 2000), discern gas motions along spiral arms in gravitationally unstable disks (Fromang et al., 2004a), and trace flows of matter around a forming planet (Paardekooper, 2007). We do not pretend to analyze the ALMA requirements necessary for such studies as it would deserve a separate publication.
5 Conclusions
We showed that the ALMA interferometer will allow us to distinguish the effects of temperature gradients and chemical stratification in disks through molecular line observations, in particular for highly-inclined objects. We found that moderately extended array configurations (with baselines of km) and 0.5–10 hours of integration time will be necessary to pursue such observations.
References
- Aikawa & Herbst (1999) Aikawa, Y., & Herbst, E. 1999, A&A, 351, 233
- Asensio Ramos et al. (2007) Asensio Ramos, A., Ceccarelli, C., & Elitzur, M. 2007, A&A, 471, 187
- Bergin et al. (2007) Bergin, E. A., Aikawa, Y., Blake, G. A., & van Dishoeck, E. F. 2007, Protostars and Planets V, 751
- D’Alessio et al. (1999) D’Alessio, P., Calvet, N., Hartmann, L., Lizano, S., Cantó, J. 1999, ApJ, 527, 893
- Draine (1978) Draine, B. T. 1978, ApJS, 36, 595
- Draine & Lee (1984) Draine, B. T., & Lee, H. M. 1984, ApJ, 285, 89
- Ducourant et al. (2005) Ducourant, C., Teixeira, R., Périé, J. P., Lecampion, J. F., Guibert, J., & Sartori, M. J. 2005, A&A, 438, 769
- Dutrey et al. (2007) Dutrey, A., et al. 2007, A&A, 464, 615
- Fromang et al. (2004a) Fromang, S., Balbus, S.A., Terquem, C., & De Villiers, J.-P. 2004, ApJ, 616, 364
- Glassgold et al. (1997) Glassgold, A. E., Najita, J., & Igea, J. 1997, ApJ, 480, 344
- Guilloteau (2002) Guilloteau, S. 2002, ALMA Memo. 393
- Hasegawa, Herbst, & Leung (1992) Hasegawa, T.I., Herbst, E., & Leung, C.M. 1992, ApJS, 82, 167
- Hasegawa & Herbst (1993) Hasegawa, T.I., & Herbst, E. 1993, MNRAS, 263, 589
- Krumholz et al. (2007) Krumholz, M. R., Klein, R. I., & McKee, C. F. 2007, ApJ, 665, 478
- Narayanan et al. (2006) Narayanan, D., Kulesa, C. A., Boss, A., & Walker, C. K. 2006, ApJ, 647, 1426
- Paardekooper (2007) Paardekooper, S.-J. 2007, A&A, 462, 355
- Pavlyuchenkov et al. (2007) Pavlyuchenkov, Y., Semenov, D., Henning, T., Guilloteau, S., Pietu, V., Launhardt, R., & Dutrey, A. 2007, ApJ, 669, 1262
- Pety et al. (2001) Pety, J., Gueth, F., & Guilloteau, S. 2001, ALMA Memo. 398
- Piétu et al. (2005) Piétu, V., Guilloteau, S., & Dutrey, A. 2005, A&A, 443, 945
- Piétu et al. (2007) Piétu, V., Dutrey, A., & Guilloteau, S. 2007, A&A, 467, 163
- Qi et al. (2006) Qi, C., Wilner, D. J., Calvet, N., Bourke, T. L., & et al. 2006, ApJ, 636, L157
- Schöier et al. (2005) Schöier, F. L., van der Tak, F. F. S., van Dishoeck, E. F., & Black, J. H. 2005, A&A, 432, 369
- Semenov et al. (2005) Semenov, D., Pavlyuchenkov, Y., Schreyer, K., Henning, T., Dullemond, C., & Bacmann, A. 2005, ApJ, 621, 853
- Semenov et al. (2006) Semenov, D., Wiebe, D., & Henning, T. 2006, ApJ, 647, L57
- Simon et al. (2000) Simon, M., Dutrey, A., & Guilloteau, S. 2000, ApJ, 545, 1034
- Spitzer & Tomasko (1968) Spitzer, L. J., & Tomasko, M. G. 1968, ApJ, 152, 971
- van Dishoeck (1988) van Dishoeck, E. F. 1988, Rate Coefficients in Astrochemistry. Proceedings of a Conference held in UMIST, Manchester, United Kingdom, September 21-24, 1987. Editors, T.J. Millar, D.A. Williams; Publisher, Kluwer Academic Publishers, Dordrecht, Boston, 1988. ISBN # 90-277-2752-X. LC # QB450 .R38 1988. P. 49, 1988, 49
- Vasyunin et al. (2007) Vasyunin, A. I., Semenov, D., Henning, T., Wakelam, V., Herbst, E., & Sobolev, A. M. 2008, ApJ, 672, in press (arXiv:0709.3323)
- Willacy et al. (2006) Willacy, K., Langer, W., Allen, M., & Bryden, G. 2006, ApJ, 644, 1202
- Woodall et al. (2007) Woodall, J., Agúndez, M., Markwick-Kemper, A. J., & Millar, T. J. 2007, A&A, 466, 1197
- Wolf et al. (2002a) Wolf, S., Gueth, F., Henning, T., & Kley, W. 2002a, ApJ, 566, L97
- Wolf & Klahr (2002b) Wolf, S., & Klahr, H. 2002b, ApJ, 578, L79
- Wolf & D’Angelo (2005) Wolf, S., & D’Angelo, G. 2005, ApJ, 619, 1114
| Species | Frequency | Bandwidth | AU | AU | ||
|---|---|---|---|---|---|---|
| GHz | kHz | |||||
| HCO+(1-0) | 89 | 30 | zoom-c (h) | zoom-c (h) | zoom-a/b (h) | zoom-a/b (h) |
| C18O(2-1) | 220 | 75 | zoom-d (h) | zoom-c (h) | zoom-c (h) | zoom-c (h) |
| 13CO(2-1) | 220 | 75 | zoom-d (h) | zoom-d (h) | zoom-c (h) | zoom-c (h) |
| CS(5-4) | 245 | 80 | zoom-e (h) | zoom-d (h) | zoom-b (h) | zoom-b (h) |
| HCN(3-2) | 266 | 90 | zoom-e (h) | zoom-d (h) | zoom-c (h) | zoom-b (h) |
| HCO+(4-3) | 357 | 120 | zoom-d (h) | zoom-e (h) | zoom-c (h) | zoom-c (h) |
| HCO+(7-6) | 624 | 210 | zoom-e (h) | zoom-e (h) | zoom-c (h) | zoom-d (h) |
| 13CO(6-5) | 661 | 220 | zoom-e (h) | zoom-e (h) | zoom-d (h) | zoom-c (h) |