Confronting Scaling Relations of Spiral Galaxies with Hierarchical Models of Disk Formation
Abstract
The scaling relations between rotation velocity, size and luminosity form a benchmark test for any theory of disk galaxy formation. We confront recent theoretical models of disk formation to a recent large compilation of such scaling relations. We stress the importance of achieving a fair comparison between models and observations.
1. Introduction
Understanding the origin and nature of galaxy scaling relations is a fundamental quest of any successful theory of galaxy formation. The success of a particular theory will be judged by its ability to predict the slope, scatter, and zero-point of any robust galaxy scaling relation at any particular wavelength. The scaling relations between rotation velocity, , size, , and luminosity, , are of special interest as they are linked via the virial theorem.
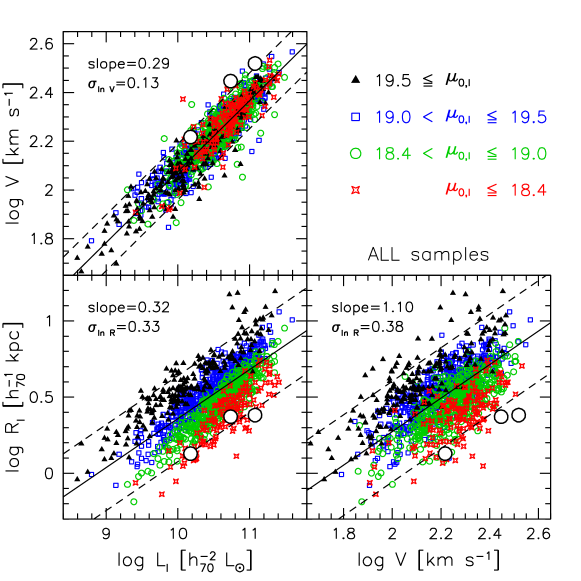
Courteau et al. (2007; hereafter C07) compiled a sample of 1303 disk galaxies for which accurate rotational velocities and near-infrared sizes and luminosities are available. We refer the reader to C07 for details about this compilation. The scaling relations for these galaxies are shown in Fig. 1. The solid black lines in each panel show orthogonal linear fits to the combined data set, while the dashed lines show the scatter in these relations. The points are color-coded according to central surface brightness. This reveals the fundamental independence of surface brightness of the relation. As discussed in C07, the relation is also independent of disk size and residuals from the size-luminosity relation. This is unexpected, as the simplest models of galaxies embedded in dark matter halos predict a strong surface brightness dependence, unless disk galaxies are dominated by dark matter within their optical regions (Courteau & Rix 1999; Dutton et al. 2007).
2. Comparison with hierarchical galaxy formation models
Cosmological numerical simulations of galaxies have so far all encountered the same fundamental problem: model galaxies rotate too fast and are too compact compared to observed ones (e.g. Eke, Navarro & Steinmetz 2001; hereafter ENS). Whether this is the result of numerical artifacts or a reflexion of incomplete physics, or both, as yet to be resolved. However, the recent simulations by Governato et al. (2007; hereafter G07) would have, according to their authors, overcome difficulties of yester efforts and achieved a new breakthrough. Quoting from their abstract:
“The simulated galaxies form rotationally supported disks with realistic exponential scale lengths and fall on both the I-band and baryonic Tully Fisher relations.”
However, as we discuss below, a fair comparison between the G07 models and observed measurements casts doubts about these claims.
2.1. On establishing a fair comparison between models and data
The relation has long been a benchmark test for hierarchical models of galaxy formation. In order to establish a fair comparison between observed and predicted scaling relations, all the relevant parameters must be measured in a similar way between models and observations and drawn from comparable parent samples. Rotational velocities from resolved rotation curves are typically measured at 2.2Rd, where Rd is the disk scale length (Courteau 1997). The total luminosity and are also typically measured from near-IR surface brightness profiles which probe the underlying stellar mass nearly free of extinction.
G07 measured the rotation velocities of their model galaxies at 2.2 and 3.5 . Bright disk galaxies have flat rotation curves beyond 2-3 and the specific choice of velocities matters little. This would not be true for fainter galaxies whose rotation curves may keep rising up to the last data point. The situation is backwards for G07 whose rotation curves for all 3 models show a steep inner rise and rapid decline in the outer regions. Care must thus be exercised when measuring a fiducial rotational velocity.
Furthermore, G07 use -band scale lengths which are, for their models, either twice as large or twice as small as the -band scale lengths. As a result, G07 measured either significantly within or beyond the actual maximum rotation velocities for their 3 model galaxies. Observations however show that -band scale lengths are typically 20% greater than those at band (de Jong 1996). The wide range of disk scale lengths in G07 is thus unexpected.
G07 state that “at the resolution of our standard runs the total mass profile and the quantity of stars have converged at radii corresponding to a couple of disc scale lengths.”. Thus the rotation curves should be resolved at 2.2 measured in the K-band. From their rotation curves we can estimate 165, 280, and 330 km s-1 for the 3 model galaxies. Fig. 1 shows that these new models create galaxies that fall more than off the VL relation. Fig. 1 also shows the RL and RV relations, where we have used the K-band sizes from G07. Our data use I-band scale lengths, and so to make a fair comparison we have increased the model scale lengths by 0.05 dex (de Jong 1996). Nevertheless, G07 galaxies are too small by a factor for a given luminosity and by a factor for a given velocity, which again corresponds to offsets from the mean relations.
Thus a fair comparison between the models and data indicates that the G07 model galaxies suffer the same fate as previous cosmological simulations (e.g. ENS), namely that they rotate too fast and are too small. It should be noted however, that ENS measured velocities at radii which enclosed essentially all of the cold baryons at . For the G07 simulations these radii correspond to 9, 18 and 24 kpc. Using rotation velocities measured at such large radii the G07 galaxies do indeed fall on the I-band, stellar mass and baryonic TF relations. Thus, in this sense, the G07 simulations are an improvement over ENS. However, the main challenge for galaxy formation models is to produce disk galaxies with the correct distributions of baryons and dark matter within the central few kpc. While G07 claimed that their simulations achieved this landmark, our analysis suggests the opposite.
2.2. Have the simulations converged?
We have so far dwelled on establishing fair data-model comparisons. Perhaps of even greater relevance is whether the simulations are well enough resolved to warrant such an exercise. G07 claimed that their simulations have converged beyond one stellar disk scale length, which should be adequate for the extraction of reliable disk sizes and rotation velocities. G07 ran one of their models (to z=0.5) increasing the number of particles eight-fold, up to 4.2 million particles. Convergence of the rotation curves between the two model galaxies differing only in the number of particles is only reached at kpc, corresponding to . This raises concerns that the disk sizes and rotation velocities at have indeed not been adequately resolved.
It is no surprise that these simulations, like most others at this writing, should have resolution problems. Kaufmann et al. (2007) showed that even with a million gas and dark matter particles, numerical effects result in spurious angular momentum losses, and this is for the idealized case of a galaxy growing in an isolated halo. For a galaxy and halo growing hierarchically, even higher resolution is needed to resolve the progenitor galaxies and halos at high redshift.
2.3. The VL relation in semi-analytic models
Current semi-analytical models (SAMs) of galaxy formation face a similar challenge as N-body realisations. Foremost, SAMs also fail to match the zero point of the relation and the luminosity function of disk galaxies simultaneously (see Dutton et al. and Somerville in these proceedings for more discussion).
Early SAMs did not model galaxy rotation curves and simply equated with the virial velocity of the halo, . Modern SAMs are often only marginally more sophisticated. For example the GALICS SAM (Hatton et al. 2003) use an ad hoc function to relate to , while for the Millennium SAM, Croton et al. (2006) assume that is equal to the maximum circular velocity of the halo, prior to galaxy formation, which is only 10 to 20% larger than for typical halo concentrations (e.g. Bullock et al. 2001). The GALform SAMs of Benson et al. (2003) are most complete by including the effects of dissipating baryons and halo contraction. However, these authors measure at the disk half mass radius, corresponding to 1.68 for an exponential disk. Observational studies do not use rotation velocity measurements at such small radii since they are more susceptible to effects of inclination and non-circular motions.
Matching the zero point of the relation has been a long-standing problem for hierarchical galaxy formation models, which may call for a departure from the standard theory of disk galaxy formation (Dutton et al. 2007), or even require a modification of CDM on small scales.
Acknowledgments.
AAD acknowledges financial support from the National Science Foundation grant AST-0507483. S.C. acknowledges financial support from the National Science and Engineering Council of Canada.
References
- Benson et al. (2003) Benson, A. J. et al. 2003, ApJ, 599, 38
- Bullock et al. (2001) Bullock, J. S. et al. 2001, MNRAS, 321, 559
- Courteau (1997) Courteau, S. 1997, AJ, 114, 2402
- Courteau & Rix (1999) Courteau, S., & Rix, H. 1999, ApJ, 513, 561
- Courteau et al. (2007) Courteau, S. et al. 2007, ApJ, 671, 203
- Croton et al. (2006) Croton, D. J., et al. 2006, MNRAS, 365, 11
- de Jong (1996) de Jong, R. S. 1996, A&A, 313, 377
- Dutton et al. (2007) Dutton, A. A., van den Bosch, F. C., Dekel, A., & Courteau, S. 2007, ApJ, 654, 27
- Eke et al. (2001) Eke, V. R., Navarro, J. F., & Steinmetz, M. 2001, ApJ, 554, 114 [ENS]
- Governato et al. (2007) Governato, F. et al. 2007, MNRAS, 374, 1479 [G07]
- Hatton et al. (2003) Hatton, S. et al. 2003, MNRAS, 343, 75
- Kaufmann et al. (2007) Kaufmann, T., Mayer, L., Wadsley, J., Stadel, J., & Moore, B. 2007, MNRAS, 375, 53