The shallow phase of X–ray afterglows
Abstract
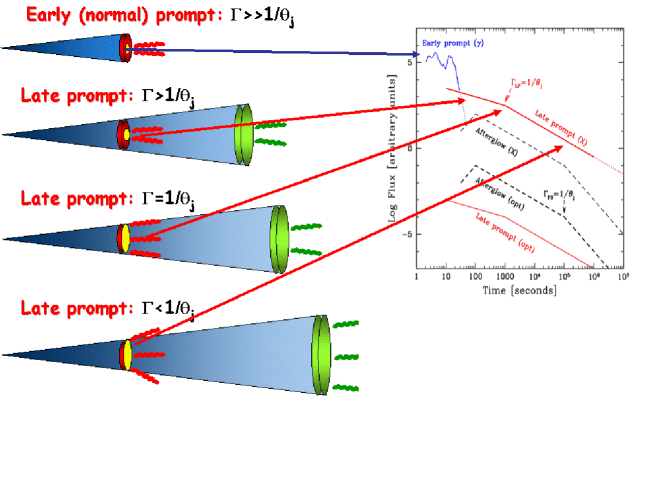
We propose that the flat decay phase in the first 102–104 seconds of the X–ray light curve of Gamma Ray Bursts can be interpreted as prolonged activity of the central engine, producing shells of decreasing bulk Lorentz factors . The internal dissipation of these late shells produces a continuous and smooth emission, usually dominant in X–rays and sometimes in the optical. When of the late shells is larger than , where is the jet opening angle, we see only a portion of the emitting surface. Eventually, becomes smaller than , and the entire emitting surface is visible. When there is a break in the light curve, and the plateau ends. During the plateau phase, we see the sum of the “late–prompt” emission (due to late internal dissipation), and the “real afterglow” emission (due to external shocks). A variety of different optical and X–ray light curves is possible, explaining why the X–ray and the optical light curves often do not track each other, and why they often do not have simultaneous breaks.
Keywords:
Gamma Ray Bursts, Afterglow, Prompt emission:
98.70.Rz, 95.85.Pw, 95.85.Nv,95.30.Gv1 Introduction
The so called “Steep–Flat–Steep” behavior gt05 ; nousek05 of the early (up to a day) X–ray afterglow was unpredicted before we could observe it with Swift. It has been interpreted in several ways (for reviews, see e.g. zhang07 ) none of which seems conclusive. The spectral slope does not change across the temporal break from the shallow to the normal decay phase, ruling out a changing spectral break as a viable explanation. An hydrodynamical or geometrical nature of the break is instead preferred. Furthermore, the X–ray and optical lightcurves often do not track one another (e.g. pana06 ; pana07 ) suggesting a possible different origin.
To solve these difficulties Uhm & Beloborodov uhm07 and Genet, Daigne & Mochkovitch genet07 suggested that the X–ray plateau emission is not due to the forward, but to the reverse shock running into ejecta of relatively small (and decreasing) Lorentz factors. This however requires an appropriate –distribution of the ejecta, and also the suppression of the X–ray flux produced by the forward shock.
We (gg07 ) instead suggested that the plateau phase of the X–ray emission (and sometimes even of the optical) is due to a prolonged activity of the central engine (see also lp07 ), responsible for a “late–prompt” phase: after the early “standard” prompt the central engine continues to produce for a long time (i.e. days) shells of progressively lower power and bulk Lorentz factor. The dissipation process during this and the early phases occur at similar radii (namely close to the transparency radius). The reason for the shallow decay phase, and for the break ending it, is that the –factors of the late shells are motonically decreasing, allowing to see an increasing portion of the emitting surface, until all of it is visible. Then the break occurs when .
2 The shallow X–ray afterglow phase
2.1 The time ending the shallow phase
Willingale et al. willi07 have proposed to described the X–ray afterglow light curve with a rising exponential connecting to a power law function. The end of the shallow phase is the junction between the exponential and the power law, and it is called . They showed that interpreting as a jet break time one obtains, for the Swift bursts in their sample, a good correlation between the peak energy of the prompt spectrum, , and the collimation corrected energetics , with a small scatter and a slope identical to the so called Ghirlanda relation ggl04 (which identifies as a jet break time the break in the optical light curve, occurring usually much later), challenging the physical nature of the Ghirlanda relation. Nava et al. nava07 have then investigated this issue with a larger sample, finding that the correlation found by willi07 does not have the same slope of the Ghirlanda one, and it is not as tight. More importantly, they demonstrated that does not play any role in the construction of the correlation found by willi07 , which is instead (entirely) a by–product of the the – correlation (the so called “Amati” relation, ama02 ). In fact there is no (anti)–correlation between and (“a la Frail”, frail01 ) for GRBs of the same (see nava07 for more details and figures).
2.2 Prolonged central engine activity
The time is not a jet break time, still it may be produced by a mechanism very similar to the process responsible for the jet break visible during the deceleration of the fireball. Consider the accretion onto the newly formed black hole, and suppose that it occurs in two phases. The first is short, intense, erratic, corresponding to the early prompt phase of GRBs. The second is longer, smoother, with a rate decreasing in time, corresponding to the late prompt emission. The first accretion mode might correspond to the accretion of the equatorial core material which failed to form the black hole in the first place. It can form a very dense accreting torus, which can sustain a strong magnetic field, which in turn efficiently extracts the rotational energy of the black hole. After this phase, some fall–back material may also be accreted, with a density smaller than in the early phases. The magnetic field that this matter can sustain is weaker than before, with a corresponding smaller power extracted from the black hole spin. This may well correspond to production of shells of smaller –factors. These shells can dissipate part of their energy with the same mechanism of the early ones. Occasionally, in this late prompt phase, the central engine may produce a faster than average shell, originating the late flares often observed in the Swift/XRT light curves.
In the scenario we have proposed, there is a simple relation between the function describing how decreases in time and the observed decay slopes before and after . Assume that the plateau phase is described by , followed by a steeper decay . Then, by geometry alone, one can derive that (gg07 ):
| (1) |
We can also estimate how the barion loading of the late shells changes in time. Assume , and consider for semplicity , when all the jet is visible. Then, for constant we have:
| (2) |
If we insert the average values of and ( and , respectively, see pana06 ) we approximately have and . This means that the total energy (i.e. integrated over time, , beginning from the start of the plateau phase) involved in the late phase is smaller than the energy spent during the early prompt.
2.3 Observational tests
If we allow for two origins for the emission during and after the X–ray plateau phase (one due to the late prompt and the other due to the conventional forward shock), we can account for a variety of cases: both the optical and the X–rays are late prompt emission or forward shock emission; or X–rays and optical are “decoupled”, one due to late prompt and the other to the forward shock. One obvious way to check these possibilities is through the simultaneous spectral energy distribution (SED), which can confirm or not if the X–ray and the IR–optical fluxes belong to the same component. If the emission in the two bands have a different origin they should not “interfere” with one another, requiring that the X–ray spectrum breaks at low energies, and the optical at high (UV) energies. The unknown extinction due to the host galaxy material may be a complication, but infrared data can help. The SED so obtained may clearly show if the IR–optical and X–ray emission belong (or not) to two different components.
Since in our scenario the late central activity is not energetically demanding, another test concerns the total kinetic energy of the fireball after its radiative phase, using the radio data, as done e.g. for GRB 970508 frail00 . Should the derived energetics be smaller than what required by e.g. the refreshed shock scenario, one could exclude this possibility, and instead favor our scenario.
In cases in which the late prompt emission ends, the underlying forward shock emission can be revealed. In the light curve, this should appear as a steep–flat transition at late times (not to be confused with the usual steep–flat–steep X–ray decay). This can also be confirmed by the corresponding SEDs.
References
- (1) L. Amati, F. Frontera, M. Tavani, et al., 2002, A&A, 390, 81
- (2) D.A. Frail, E. Waxman & S.R. Kulkarni, 2000, ApJ, 537, 191
- (3) D.A. Frail, S.R. Kulkarni, Sari, R. et al., 2001, ApJ, 562, L55
- (4) F. Genet, F. Daigne, & R. Mochkovitch, 2007, MNRAS, 381, 732
- (5) G. Ghirlanda, G. Ghisellini & D, Lazzati, 2004, ApJ, 616, 331
- (6) G. Ghisellini, G. Ghirlanda, L. Nava & C. Firmani, 2007, ApJ, 658, L75
- (7) D. Lazzati & R. Perna, 2007, MNRAS, 375, L46
- (8) L. Nava, G. Ghisellini, G. Ghirlanda et al., 2007, MNRAS, 377, 1464
- (9) J.A. Nousek, C. Kouveliotou, D. Grupe, et al., 2005, ApJ, 642, 389
- (10) A. Panaitescu, P. Meszaros, D. Burrows, N. Nousek et al. 2006, MNRAS, 369, 2059
- (11) A. Panaitescu, 2007, Il Nuovo Cimento, in press (astro–ph/0607396)
- (12) G. Tagliaferri, M. Goad, G. Chincarini, et al., 2005, Nature, 436, 985
- (13) L.Z. Uhm & A.M. Beloborodov, 2007, ApJ, 665, L93
- (14) R. Willingale, P.T. O’Brien, J.P. Osborne, et al., 2007, ApJ, 662, 1093
- (15) B. Zhang, 2007, Advances in Space Research, 40, Issue 8, p. 1186 (astro–ph/0611774)