Department of Astronomy - Yale Center for Astronomy and Astrophysics, Yale University, New Haven, CT, USA \PACSes\PACSit98.62.VeCharacteristics and properties of external galaxies and extragalactic objects – statistical and correlative studies of properties
Assessing the Predictive Power of Galaxy Formation Models with the Rest-Frame Optical Luminosity Functions at
Abstract
We compare recently measured rest-frame -band luminosity functions (LFs) of galaxies at redshifts to predictions of semianalytic models by De Lucia & Blaizot and Bower et al. and hydrodynamic simulations by Davé et al. The models succeed for some luminosity and redshift ranges and fail for others. A notable success is that the Bower et al. model provides a good match to the observed LF at . However, all models predict an increase with time of the rest-frame -band luminosity density, whereas the observations show a decrease. The models also have difficulty matching the observed rest-frame colors of galaxies. In all models the luminosity density of red galaxies increases sharply from to , whereas it is approximately constant in the observations. Conversely, in the models the luminosity density of blue galaxies is approximately constant, whereas it decreases in the observations. These discrepancies cannot be entirely remedied by changing the treatment of dust and suggest that current models do not yet provide an adequate description of galaxy formation and evolution since .
1 Introduction
In the current paradigm of structure formation, dark matter (DM) halos build up in a hierarchical fashion through the dissipationless mechanism of gravitational instability. The assembly of the stellar content of galaxies is instead governed by much more complicated physical processes, often dissipative and non-linear, which are generally poorly understood. To counter this lack of understanding, prescriptions are employed in the galaxy formation models. One of the fundamental tools for constraining the physical processes encoded in these models is the luminosity function (LF), since its shape retains the imprint of galaxy formation and evolution processes.
The faint end of the LF can be matched with a combination of supernova feedback and the suppression of gas cooling in low-mass halos due to a background of photoionizing radiation (e.g. [1]). Matching the bright end of the LF has proven more challenging. Very recent implementation of active galactic nucleus (AGN) feedback in semianalytic models (SAMs) has yielded exceptionally faithful reproductions of the observed local rest-frame - and -band global LFs [2, 3], including good matches to the local rest-frame -band LFs of red and blue galaxies (although with some discrepancies for faint red galaxies; [3]).
The excellent agreement between observations and models at is impressive but is partly due to the fact that the model parameters were adjusted to obtain the best match to the local universe. A key question is therefore how well these models predict the LF at earlier times. The SAMs of [2], [3], and [4] have been compared to observations at [2, 5]. Although the agreement is generally good, [5] infer that the abundance of galaxies near the knee of the LF at high redshift is larger in the SAMs than in the observations (except possibly for the brightest objects), in an apparent reversal of previous studies (e.g. [6]).
We have compared the observed rest-frame optical LFs of galaxies at [7] to those predicted by theoretical models in this redshift range, in order to test the predictive power of the latest generation of galaxy formation models. We have also compared the observed LF to predictions from smoothed particle hydrodynamics (SPH) simulations, which have so far only been compared to data at [8]. The details of this comparison can be found in [9]; here we summarize the main results from our study. All magnitudes are in the AB system, while colors are on the Vega system.
2 The observed luminosity functions
The observed rest-frame optical LFs at were measured from a composite sample of galaxies built from three deep multi-wavelength surveys, all having high-quality optical to NIR photometry: the ultradeep Faint InfraRed Extragalactic Survey (FIRES; [10]), the Great Observatories Origins Deep Survey (GOODS; [11]; Chandra Deep Field–South), and the MUltiwavelength Survey by Yale-Chile (MUSYC; [12]). The unique combination of surveyed area and depth of the MUSYC survey allowed us to (1) minimize the effects of sample variance, and (2) better probe the bright end with unprecedented statistics. The FIRES allowed us to constrain the faint end of the LF, while the CDFS catalog bridges the two slightly overlapping regimes and improves the number statistics. The final -selected sample, comprising a total of 990 galaxies111Of these, 4% have spectroscopic redshifts. with at over an area of 380 arcmin2, is described in details in [7]. The rest-frame optical (, , and bands) LFs of galaxies at and a comprehensive analysis of the systematics effects due to photometric redshift uncertainties are also presented in [7]. By splitting the sample by color, we showed that the LFs of red and blue galaxies are significantly different, with the latter being characterized by a much steeper faint-end slope. We also estimated the contribution of red and blue galaxies to the global densities. While blue galaxies dominate the rest-frame optical luminosity density, the global stellar mass density at appears to be dominated by red galaxies.
Here, we limit our comparison between observed and predicted LFs to the rest-frame band, at the two redshift intervals and .
3 The model-predicted luminosity functions
The SAM of Bower et al. [2] is implemented on the Millennium DM simulation described in [13]. The details of the assumed prescriptions and the specific parameter choices are described in [2, 14, 15]. We have also used the outputs from the SAM of Croton et al. [3] as updated by De Lucia & Blaizot [4]. This model differs from the SAM of Bower in the scheme for building the merger trees and in the prescriptions adopted to model the baryonic physics, most notably those associated with the growth of and the feedback from SMBHs in galaxy nuclei and the cooling model (see [4, 16, 17, 18] for details). Finally, we have compared the observed LFs with the predictions from the cosmological SPH simulations of [19], already used in [20] to constrain the physical properties of galaxies. The key ingredient of these simulations is the inclusion of superwind feedback. Specifically, we used the “momentum-driven wind” model used in [20] (see [19] for detailed descriptions). A description of how the SAM-predicted rest-frame -band LFs were computed can be found in [9].
4 Results
The comparison between the observed rest-frame -band LFs of all galaxies at and with those predicted by the theoretical models is shown in Figure 1. It is immediately obvious that the models do not yet provide a precise description of galaxy evolution. Differences between the various models, and discrepancies between model predictions and data, are still as large as a factor of for certain luminosity and redshift ranges.
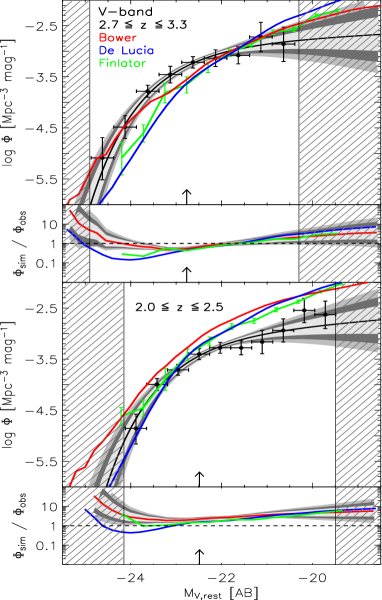
At , the global LF predicted by the SAM of Bower agrees well with the observed LF. However, while at the shape of the observed LF is broadly reproduced by the SAM, the predicted characteristic density is 2.5 times larger than the observed value. The SAM of De Lucia & Blaizot has difficulty with both the normalization and the slope of the LF, which is too steep. The SPH simulations of [20] predict LFs that are qualitatively similar to those predicted by the two SAMs.
We quantified these results by determining the luminosity density (obtained by integrating the LF) for the observations and models. The observed () has been estimated by integrating the best-fit Schechter function down to , which is the faintest luminosity probed by the -selected sample. To estimate from the SAM (), we have fitted the predicted LFs with a Schechter function, leaving , , and as free parameters, applying the same limits as to the data.
The comparison between and of Bower is shown in Figure 2 (bottom panels) by the black lines and data points. The Bower SAM matches the observed luminosity density at . However, the model does not match the evolution of . In the model the luminosity increases with cosmic time, by a factor of from to . By contrast, the observed luminosity density decreases with time, by a factor of over the same redshift range. Results for the De Lucia SAM are similar, but for this model the difference between observed and predicted density is a strong function of the adopted faint-end integration limit.
5 Colors
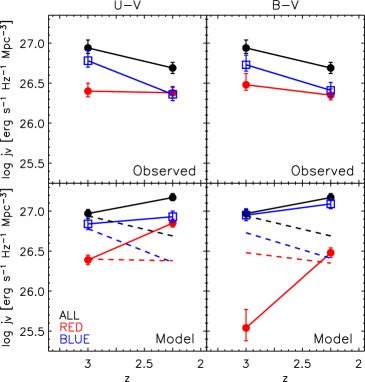
As described in [9], we investigated the cause of the discrepancies by splitting the sample into blue and red galaxies, using their rest-frame colors. Interestingly, the results depend strongly on the choice of color: splitting the sample by color (as done in [7]) produces very different results than splitting by color.
To define red galaxies, we first use the criterion 0.25, as done in [7]. As shown in the bottom left panel of Figure 2, the Bower model reproduces the densities of red and blue galaxies at extremely well, but it overpredicts the densities of red and blue galaxies at .
Next, we use the criterion 0.5222For observed galaxies in the sample of [7], roughly corresponds to .. As can be seen in the top panels of Figure 2, this criterion leads to very similar observed densities of red and blue galaxies as the criterion. However, the predicted densities are in severe disagreement with the observations, particularly at (see Fig. 2, bottom right panel). The red galaxy density at underpredicts the observed density by a factor of . Qualitatively similar results are obtained when from the SAM of De Lucia & Blaizot is used in the comparison333The De Lucia model provides colors, but no colors..
Irrespective of the color criterion that is used, we find that the predicted evolution of the red and blue luminosity densities is in qualitative disagreement with the observed evolution. In the observations, the moderate evolution of the luminosity density is mainly driven by a decrease with cosmic time of the density of blue galaxies, with the red galaxies evolving much less. By contrast, in the SAMs, the moderate evolution seen in the global LF is in the opposite sense and dominated by a strong evolution in the red galaxy population.
6 Discussion
The main results of our comparison between the observed and the model-predicted rest-frame -band LFs of galaxies at are (1) the SAM of Bower reproduces well the observed LF at ; (2) the models predict an increase with time of the rest-frame -band luminosity density, whereas the observations show a decrease; (3) the models predict strong evolution in the red galaxy population, whereas in the observations most of the evolution is in the blue population; (4) the models greatly underpredict the abundance of galaxies with at .
The different results obtained for and colors are interesting, as they may hint at possible ways to improve the models. We further investigate the disagreement between observed and predicted colors in the SAM of Bower by comparing the observed and predicted colors of galaxies in the versus diagram. While the SAM seems to broadly reproduce the observed distribution, it predicts galaxies that are systematically bluer in than the observed galaxies. As shown in [9], the differences between observed and predicted colors could be due to larger amount of dust and/or to more complex star-formation histories in the observed galaxies. The ad hoc treatment of dust absorption is a significant and well-known source of uncertainty in the models. Modifications to the specific dust model could partly resolve the differences between observations and SAM predictions. By simply multiplying the in the SAM by a fixed factor, we were able to better reproduce the observed LFs at (although making the faint-end slope of the red galaxy LFs quantitatively too steep) and to have a better agreement between observed and predicted colors. However, at this simple remedy is not able to solve the disagreement between the predicted and the observed number of galaxies. We conclude that, while ad hoc modifications of the dust treatment might help to alleviate some of the found disagreements, it does not seem to be sufficient to resolve the problem with global colors at .
Acknowledgements.
D.M. is supported by NASA LTSA NNG04GE12G. The authors acknowledge support from NSF CARRER AST 04-49678.References
- [1] \BYBenson A.J., Lacey C.G., Baugh C.M., Cole S., \atqueFrenk C.S. \INMNRAS3332002156
- [2] \BYBower R.G., Benson A.J., Malbon R., Helly J.C., Frenk C.S., Baugh C.M., Cole S., \atqueLacey C.G. \INMNRAS3702006654
- [3] \BYCroton D.J., et al. \INMNRAS365200611
- [4] \BYDe Lucia G., \atqueBlaizot J. \INMNRAS37520072
- [5] \BYKitzbichler M.G., \atqueWhite S.D.M. \INMNRAS37620072
- [6] \BYCimatti A., et al. \INA&A3912002L1
- [7] \BYMarchesini D., et al. \INApJ656200742
- [8] \BYDavé R., Finlator K., \atqueOppenheimer D. \INMNRAS3702006273
- [9] \BYMarchesini D., \atquevan Dokkum P.G. \INApJ6632007L89
- [10] \BYFranx M., et al. \INApJ5872003L79
- [11] \BYGiavalisco M., et al. \INApJ6002004L93
- [12] \BYQuadri R., et al. \INAJ13420071103
- [13] \BYSpringel V., et al. \INNature4352005629
- [14] \BYCole S., Lacey C.G., Baugh C.M., \atqueFrenk C.S. \INMNRAS3192000168
- [15] \BYBenson A. J., Bower R. G., Frenk C. S., Lacey C. G., Baugh C. M., \atqueCole S. \INApJ599200338
- [16] \BYKauffmann G., \atqueHaehnelt M. \INMNRAS3112000576
- [17] \BYSpringel V., White S.D.M., Tormen G., \atqueKauffmann G. \INMNRAS3282001726
- [18] \BYDe Lucia G., Kauffmann G., \atqueWhite S.D.M. \INMNRAS34920041101
- [19] \BYOppenheimer B.D., \atqueDavé R. \INMNRAS37320061265
- [20] \BYFinlator K., Davé R., \atqueOppenheimer B.D. \INMNRAS37620071861
- [21] \BYAvni Y., \atqueBahcall J.N. \INApJ2351980694
- [22] \BYSandage A., Tammann G.A., \atqueYahil A. \INApJ2321979352