Exploratory Study of the X-Ray Properties of Quasars With Intrinsic Narrow Absorption Lines
Abstract
We have used archival Chandra and XMM-Newton observations of quasars hosting intrinsic narrow UV absorption lines (intrinsic NALs) to carry out an exploratory survey of their X-ray properties. Our sample consists of three intrinsic-NAL quasars and one “mini-BAL” quasar, plus four quasars without intrinsic absorption lines for comparison. These were drawn in a systematic manner from an optical/UV-selected sample. The X-ray properties of intrinsic-NAL quasars are indistinguishable from those of “normal” quasars. We do not find any excess absorption in quasars with intrinsic NALs, with upper limits of . We compare the X-ray and UV properties of our sample quasars by plotting the equivalent width and blueshift velocity of the intrinsic NALs and the X-ray spectral index against the “optical-to-X-ray” slope, . When BAL quasars and other AGNs with intrinsic NALs are included, the plots suggest that intrinsic-NAL quasars form an extension of the BAL sequences and tend to bridge the gap between BAL and “normal” quasars. Observations of larger samples of intrinsic-NAL quasars are needed to verify these conclusions. We also test two competing scenarios for the location of the NAL gas in an accretion-disk wind. Our results strongly support a location of the NAL gas at high latitudes above the disk, closer to the disk axis than the dense BAL wind. We detect excess X-ray absorption only in Q0014+8118, which does not host intrinsic NALs. The absorbing medium very likely corresponds to an intervening system at , which also produces strong absorption lines in the rest-frame UV spectrum of this quasar. In the appendix we discuss the connection between UV and X-ray attenuation and its effect on .
Subject headings:
galaxies:active – galaxies:nuclei – X-rays:galaxies – quasars: absorption lines1. Introduction
The intrinsic absorption lines found in the rest-frame UV spectra of quasars and active galactic nuclei (AGNs) are classified based on their line widths into broad absorption lines (BALs; FWHM km s-1, found in of all quasars), narrow absorption lines (NALs; FWHM km s-1, found in of quasars at –4; these can be clearly separated from intervening lines via high-resolution spectroscopy), and mini-BALs (intermediate FWHM between BALs and NALs). They are typically blueshifted relative to the quasar and are thought to trace outflows from the quasar central engine. These outflows could be hydromagnetic accretion-disk winds (e.g., Blandford & Payne 1982; Emmering, Blandford & Shlosman 1992; Königl & Kartje 1994; Everett 2005), or accretion-disk winds driven by radiation pressure (e.g., Murray et al. 1995; Arav, Li, & Begelman 1994, Proga, Stone, & Kallman 2000). Alternatively they could be outflows driven by thermal pressure and launched either from the accretion disk itself (e.g., Begelman, McKee, & Shields 1983) or from the obscuring torus invoked by AGN unification schemes and driven by thermal pressure (e.g., Balsara & Krolik 1993; Krolik & Kriss 1995, 2001; Chelouche & Netzer 2005). However, thermal accretion disk winds are too hot to produce absorption lines in the UV, while thermal winds from the obscuring torus are too slow to account for the observe velocities of NALs and BALs. Accretion disk winds, whatever their origin, are an integral part of the accretion flow, and may be the source of the broad emission lines that are characteristic of the optical and UV spectra of quasars and AGNs (e.g., Shields 1977; Chiang & Murray 1996; Murray & Chiang 1997). Moreover, the outflows may be important for cosmology since they deliver energy and momentum to the interstellar and intergalactic media (hereafter, ISM and IGM, respectively) and can affect galaxy evolution (e.g., Granato et al. 2004; Scannapieco & Oh 2004; Springel, Di Matteo & Hernquist 2005; Chartas et al. 2007a).
Most of our knowledge about intrinsic absorbers is derived from optical/UV observations. A combination of observational results and models suggest that intrinsic absorption lines of different widths represent either different lines of sight through the outflowing wind to the quasar continuum source (Ganguly et al. 2001; Elvis 2000), or different stages in the evolution of the absorbing gas parcels (e.g., Hamann & Sabra 2004; Misawa et al. 2005).
X-ray observations of BAL quasars have revealed large columns of nearly-neutral absorbing gas ( cm-2; see, for example, Green & Mathur 1996; Gallagher et al. 2002a). However, little is known about the X-ray properties of quasars with intrinsic NALs and mini-BALs. X-ray spectroscopy of the last two types of quasars can be extremely useful in many respects:
-
•
In general terms, we can compare the X-ray properties of quasars that host intrinsic NALs with those that do not. This comparison allows us to assess whether there is a significant difference between the central engines of the two types of object. If no difference is found, and since intrinsic NALs are ubiquitous in quasar spectra (see Misawa et al 2007b and references therein), we will be led to a picture where intrinsic NALs, hence outflows, are a universal property of quasars.
-
•
X-ray spectra can probe highly-ionized media that are not directly probed by optical/UV absorption lines. Moreover, they can yield more direct measurements of the total hydrogen column density of absorbers in a relatively low-ionization state (this cannot be easily done through UV absorption lines, unless the ionization state of the gas is very well constrained). Thus, we can use the X-ray spectra to investigate whether any hot gas (which may represent the bulk of the mass) co-exists (mixed or layered) with the UV absorbers.
-
•
The column densities determined from the X-ray spectra constitute a direct test of scenarios for the location of the NAL gas in the larger outflow. In particular, Elvis (2000) suggests that the NAL gas is located at very low latitudes above the accretion disk, implying very large column densities (comparable to those found in BAL quasars, i.e., cm-2). On the other hand, Ganguly et al. (2001) place the NAL gas at high latitudes above the accretion disk, implicitly suggesting lower column densities.
-
•
Several examples of intrinsic NALs at high ejection velocities () are now known (see Misawa et al. 2007b and references therein). It is extremely interesting, therefore, to search quasars with intrinsic NALs for high-velocity X-ray absorption lines (see, for example, Chartas et al. 2002, 2003). Such observations can yield results relevant to cosmology since they can lead to estimates of the mass outflow rate and the kinetic power of the outflow (see, for example, Chartas et al. 2007b).
With the above considerations in mind, we have used archival Chandra and XMM-Newton data to carry out an exploratory survey of the X-ray properties of a small, but carefully-selected sample of quasars at –3.8. This sample consists of three quasars hosting intrinsic NALs, one quasar hosting a mini-BAL (HS1603+3820), and four quasars without intrinsic absorption lines for comparison (these were selected in a systematic way, as described in the next section). We compare the properties of the UV NALs (e.g., equivalent width, outflow velocity) with the parameters describing the X-ray spectrum (e.g., photon index, intrinsic column density, and optical-to-X-ray slope, ). Thus, we place NAL quasars in the context of BAL quasars (see Gallagher et al. 2002b; Brandt, Laor, & Wills 2000) and investigate whether all types of objects follow the same trends in their properties. We also use the column densities determined from the X-ray spectra to carry out one of the tests outlined, above, namely, we attempt to distinguish between the two different suggestions for the location of the NAL gas in the larger outflow.
In §2, we describe how the sample was selected and summarize the properties of the constituent quasars. In §3 and §4, we present the analysis of the data (observations, data screening, and model fits to the X-ray spectra). We compare the rest-frame UV and X-ray properties in §5. In §6 we summarize our findings, discuss our results, and consider prospects for future work. We adopt a cosmological model with = 75 km s-1 Mpc-1, =0.3, and = 0.7. Throughout this paper we give error bars corresponding to the 90% confidence level, unless noted otherwise. A significant part of our discussion makes use of the optical-to-X-ray slope of the spectral energy distribution, , which is affected by extinction. Thus we examine the effects of extinction on in detail in the appendix.
2. Sample Selection
Our sample was drawn from a survey for intrinsic NALs in the Keck high-resolution spectra of 37 quasars at –4 (Misawa et al. 2007b). These quasars were originally selected and observed in order to study intergalactic deuterium lines (e.g., O’Meara et al. 2001, and references therein), therefore, they make up a largely unbiased sample with respect to intrinsic NALs. The intrinsic NALs were separated from NALs arising in cosmologically intervening objects based on their partial coverage signature (e.g., Hamann et al. 1997b; Barlow & Sargent 1997; Ganguly et al. 1999, 2003; Misawa et al. 2003, 2005). In summary, the partial coverage test exploits the fact that the ratio of optical depths in the individual lines of UV resonance doublets is prescribed by atomic physics. Departures from the expected ratio in well-resolved, unsaturated doublets is interpreted as the result of dilution of the line troughs by continuum photons that do not pass through the absorber (e.g., Hamann et al. 1997b; Barlow & Sargent 1997; Ganguly et al. 1999), i.e., the absorber is very compact, thus intrinsic to the quasars (most cosmologically intervening structures are considerably more extended than the quasar continuum source). In the case of the prominent UV resonance doublets (C IV, Si IV, and N V), the ratio of optical depths between doublet members is 2:1, which allows us to compute analytically the fraction of the continuum photons that pass through the absorber (the coverage fraction). In practice the coverage fraction is computed both by applying the above algorithm to every pixel of the line profile and by decomposing the profile into kinematic components (represented by Voigt functions whose FWHM turn out to be of order 10 km s-1) and applying the above algorithm to each component. If both methods consistently reveal partial coverage in parts of the line profile, the line is identified as intrinsic. We find that the profiles of the C IV absorption lines often have multiple kinematic components, not sharing the same coverage fraction. Further details of the methodology can be found in Misawa et al (2007b), and the references cited therein.
The above search yielded intrinsic C IV NALs in 32% of the quasars and intrinsic C IV, Si IV, or N V NALs in 50% of the quasars. To this sample we added one more quasar hosting a C IV mini-BAL showing the signature partial coverage as well as variability, HS1603+3820 (Misawa et al. 2007a, and references therein). After searching the Chandra and XMM-Newton archives we found that 11 quasars from the above survey had been observed and 8 of the observed quasars had archival X-ray spectra with enough counts to yield interesting spectral constraints (the 3 objects that were excluded from our final sample are: Q02410146, Q06366801, and Q10554611). The 8 quasars making up the final sample are listed in Table 1, which also summarizes their basic properties and the properties of their intrinsic NALs. Of these, three objects have intrinsic NALs, one has a mini-BAL, and four have no intrinsic absorption lines. Thus we have a small, but well defined sample of NAL quasars and a matching comparison sample of quasars without intrinsic NALs. All of the quasars with intrinsic NALs and 2/4 quasars without intrinsic NALs are radio quiet. The Chandra and XMM-Newton X-ray spectra of 6 of these quasars were analyzed and the results published (see references in §4.2). Nevertheless, we have re-analyzed the data for the entire sample for the sake of uniformity of analysis and in order to make a careful assessment of absorption intrinsic to the quasar central engines. To this end we have tested a variety of spectral models, as we detail in §4.1.
| Quasar Properties | Intrinsic C IV NAL Properties | |||||||
|---|---|---|---|---|---|---|---|---|
| Radio | bbThe luminosity distance, computed based on the cosmological parameters given at the end of §1 of the text. | ccFlux density per unit frequency at 2500 Å in the quasar rest frame, derived from the V- or R-band flux (assuming ; see Misawa et al. 2007b) and corrected for Galactic extinction but not intrinsic extinction. | ddVelocity offset of a NAL relative to the redshift of the quasar. A negative value denotes a blueshift. | Rest EW | eeCoverage fractions for the kinematic (Voigt) components used to decompose the line profile. Each component has a FWHM of order 10 km s-1(from Misawa et al. 2007a,b; see §2 of the text). These values effective represent the variation of across the C IV line profile. | |||
| Quasar | Loud?aaIndicates whether the quasar is radio-loud (L) or radio-quiet (Q); from Misawa et al. (2007b). | (Gpc) | ( cm-2) | (mJy) | (km s-1) | (Å) | ||
| (1) | (2) | (3) | (4) | (5) | (6) | (7) | (8) | (9) |
| Q00148118 | 3.387 | L | 27.4 | 14 | 0.70 | … | … | … |
| Q01304021 | 3.030 | Q | 24.0 | 1.9 | 0.21 | 0.53 | , , , 1 | |
| 0.69ffThe red member of this doublet is blended with another line, but the equivalent width can be evaluated. | 1, 1, 1, , , , 1 | |||||||
| Q11074847 | 3.000 | Q | 23.7 | 1.3 | 0.30 | 0.20 | 1, , 1 | |
| Q12081011 | 3.803 | Q | 31.5 | 1.7 | 0.04 | … | … | … |
| Q14222309 | 3.611 | L | 29.6 | 2.7 | 0.05 | … | … | … |
| Q14422931 | 2.670 | Q | 20.6 | 1.7 | 0.47 | … | … | … |
| HS16033820ggThis quasar hosts a C IV mini-BAL at a blueshifted velocity of . The rest-frame equivalent width of this mini-BAL varies significantly over short time scales (see Misawa et al. 2007a). Thus we list a range of values to indicate its temporal variability (the error bars are comparable over all epochs, hence we give only a representative value here). | 2.542 | Q | 19.4 | 1.3 | 0.77 | 0.33 | 1, 1, 1, , 1, , 1 | |
| 2.53–5.07ggThis quasar hosts a C IV mini-BAL at a blueshifted velocity of . The rest-frame equivalent width of this mini-BAL varies significantly over short time scales (see Misawa et al. 2007a). Thus we list a range of values to indicate its temporal variability (the error bars are comparable over all epochs, hence we give only a representative value here). | 0.24–0.45 ()ggThis quasar hosts a C IV mini-BAL at a blueshifted velocity of . The rest-frame equivalent width of this mini-BAL varies significantly over short time scales (see Misawa et al. 2007a). Thus we list a range of values to indicate its temporal variability (the error bars are comparable over all epochs, hence we give only a representative value here). | |||||||
| 0.74 | , 1, , 1, 1 | |||||||
| Q17006416 | 2.722 | Q | 21.1 | 2.7 | 0.53 | 0.58hhThese lines are locked to each other and as such they are judged to be intrinsic. The coverage fraction is unity and only the total equivalent width can be evaluated. | 1.00 | |
| …hhThese lines are locked to each other and as such they are judged to be intrinsic. The coverage fraction is unity and only the total equivalent width can be evaluated. | 1.00 | |||||||
| 0.14 | , 1 | |||||||
In Table 1 we give the quasar name, redshift, Galactic column density (), and flux density at 2500 Å in the quasar rest frame, after correcting for absorption in the ISM of the Milky Way, but without any correction for intrinsic absorption. We also include the properties of intrinsic NALs, namely the offset velocity relative to the quasar redshift111Absorption-line systems close to the systemic redshift of the quasar are regarded as “associated” with the quasar, just on the basis of their proximity in velocity space. However, different authors adopt a different velocity limit for their definition of associated systems. The most common convention is km s-1 (e.g., Foltz et al 1986), while Brandt et al. (2000) adopt km s-1., the rest-frame equivalent width of the intrinsic C IV NALs, and the coverage fraction of the absorber. The coverage fraction was determined as described in the first paragraph of this section. In Table 1 we list the coverage fractions of the Voigt components used to decompose each C IV line profile. These values effectively represent the variation of the coverage fraction across the C IV profiles in bins of width of order 10 km s-1and provide the basis for the classification of the NALs as intrinsic (the coverage fraction is significantly lower than unity in large portions of the line profile, especially close to the line center). The classification of these NALs as intrinsic is also corroborated by similar partial coverage information on other lines in the same system, such as N V. In the case of Q1700+6416, the higher-velocity absorption system listed in Table 1 is judged to be intrinsic based on the fact that it is line locked.
3. X-Ray Observations and Data Screening
The 8 quasars in our sample were observed with the Chandra Advanced CCD Imaging Spectrometer (ACIS; Garmire et al. 2003) and/or with the XMM-Newton European Photon Imaging Camera (EPIC) pn and MOS detectors (Strüder et al. 2001; Turner et al. 2001). Some objects were observed with both instruments and some objects were observed more than once with the same instrument, yielding a total of 6 Chandra and 6 XMM-Newton data sets. In Table 2 we give a log of the observations, including the observatory and instrument, the observation identification number, and the date.
| Exp. | ||||||
|---|---|---|---|---|---|---|
| Quasar | Observatory | Instr. | Obs.ID | Date | (ks) | Counts |
| (1) | (2) | (3) | (4) | (5) | (6) | (7) |
| Q0014+8118 | XMM-Newton | pn | 0112620201 | 2001 Aug 23 | 14.3 | 13348 |
| MOS1 | 16.9 | 4866 | ||||
| MOS2 | 16.9 | 4827 | ||||
| Q0130-4021 | XMM-Newton | pn | 0112630201 | 2001 Jun 04 | 23.0 | 1842 |
| MOS1 | 25.2 | 499 | ||||
| MOS2 | 25.3 | 491 | ||||
| Q1107+4847 | XMM-Newton | pn | 0104861001 | 2002 Jun 01 | 28.1 | 813 |
| MOS1 | 32.2 | 213 | ||||
| MOS2 | 32.3 | 253 | ||||
| Q1208+1011 | Chandra | ACIS-S | 3570 | 2003 Mar 02 | 9.97 | 175 |
| Q1422+2309 | Chandra | ACIS-S | 367 | 2000 Jun 01 | 28.4 | 426 |
| Chandra | ACIS-S | 1631 | 2001 May 21 | 10.7 | 244 | |
| XMM-Newton | pn | 0143652301 | 2003 Feb 04 | …aaThe pn image of Q1422+2309 fell on a chip gap, therefore we were not able to use those data. | …aaThe pn image of Q1422+2309 fell on a chip gap, therefore we were not able to use those data. | |
| MOS1 | 4.89 | 191 | ||||
| MOS2 | 4.89 | 198 | ||||
| Chandra | ACIS-S | 4939 | 2004 Dec 01 | 47.7 | 762 | |
| Q1442+2931 | XMM-Newton | pn | 0103060201 | 2002 Aug 01 | 21.3 | 2607 |
| MOS1 | 24.8 | 768 | ||||
| MOS2 | 24.8 | 753 | ||||
| HS1603+3820 | Chandra | ACIS-S | 4026 | 2002 Nov 29 | 8.30 | 137 |
| Q1700+6416 | Chandra | ACIS-S | 547 | 2000 Oct 31 | 49.5 | 325 |
| XMM-Newton | pn | 0107860301 | 2002 May 31 | 14.1 | 1060 | |
| MOS1 | 18.3 | 281 | ||||
| MOS2 | 18.4 | 299 |
We retrieved the data from the respective data archives and reduced them in a standard and uniform manner using up-to-date calibration data222Updates on the calibration of Chandra and XMM-Newton are available on the WWW sites of the CXC (http://asc.harvard.edu/ciao/releasenotes/history.html) and XMM-Newton SOC (http://xmm.vilspa.esa.es/external/ xmm_sw_cal/calib/rel_notes/index.shtml). The Chandra data were reduced using the CIAO 3.3 software package, provided by the Chandra X-ray Center (CXC) and following the CXC threads. We screened the data according to status, photon event grade, aspect solution, and background level. We also removed the 025 randomization applied to the photon positions by the CXC in order to improve the spatial resolution. The XMM-Newton data were reduced with the SAS 6.5 software package provided by the XMM-Newton Science Operation Center (SOC). We screened the pn and MOS data to retain events with values of the PATTERN keyword in the range 0–4 and 0–12, respectively. To avoid intervals of high background we excluded data taken when the full-field count rates exceeded 20 s-1 in the pn and and 4 s-1 in the MOS.
We extracted spectra of the target quasars after subtracting the local background. In Table 2, we list the exposure times and number of the counts in the spectra of individual instruments. With the exception of the Chandra spectra of Q14222309 (taken at three different epochs) there was no evidence of pile up in the data. Our sample includes two gravitationally lensed quasars, Q12081011 and Q14222309, which required special treatment. We give the details of how we treated these two objects in §4.2, below. The luminosities we report for these two quasars have been scaled down according to the magnification factors reported in §4.2.
4. Model Fits to the Observed Spectra and Results
4.1. Suite of Models and Fit Results
We fitted a variety of models to the observed X-ray spectra using the XSPEC 12.3.0 software package (Arnaud 1996). All energy channels below 0.4 keV were ignored. The spectra were binned to have a minimum of 10 counts per bin (in most cases the minimum number of counts per bin was required to be higher; see §4.2 for specific details). In the case of XMM-Newton data, we performed joint fits to the MOS and pn spectra.
We used the suite of models, described below, to fit the spectra and selected the model that gave the best fit. It is important to find the most appropriate models for the observed spectra so that we can determine the intrinsic column density reliably, since this is a crucial quantity in our subsequent discussion. Absorption in the ISM of the Milky Way is included in all models, using the Galactic column densities from the HEASARC nH tool333http://heasarc.gsfc.nasa.gov/cgi-bin/Tools/w3nh/w3nh.pl (, listed in Table 1) and the photoelectric absorption cross-sections of Morrison & McCammon (1983). These column densities were held fixed during the fitting process. Wherever necessary, we adopted a Solar abundance pattern for heavy elements from Anders & Grevesse (1989).
The models we used are outlined below (along with their XSPEC model syntax; Galactic absorption is denoted by wabs).
| Model 1: | Model 2: | ||||||||||
|---|---|---|---|---|---|---|---|---|---|---|---|
| Simple Power Law | Power Law & Intrinsic Absorption | Complex Models | |||||||||
| F-TestddF-test probability that more complex models provide a better fit than models 1 and 2, respectively. | F-TestddF-test probability that more complex models provide a better fit than models 1 and 2, respectively. | ||||||||||
| QuasaraaQuasar names and observations are in the same order as in Table 2. | bbReduced and number of degrees of freedom. | bbReduced and number of degrees of freedom. | ModelccModels are described in detail in §4 of the text. | bbReduced and number of degrees of freedom. | |||||||
| (1) | (2) | (3) | (4) | (5) | (6) | (7) | (8) | (9) | (10) | (11) | (12) |
| Q00148118 | 1.181/383 | 1.104/380 | 3 | 1.108/381 | 0.92 | ||||||
| 4 | 1.103/379 | 0.27 | |||||||||
| Q01304021 | 1.033/56 | 1.066/55 | 5 | … | 0.866/55 | 0.0011 | …eeModels 2 and 5 have the same number of free parameters, thus the F-test does not give a meaningful result. For reference, we note that the values of for models 2 and 5 yield chance probabilities of 0.66 and 0.25, respectively. | ||||
| Q11074847 | 1.315/44 | 1.321/43 | 6 | 1.157/42 | 0.026 | 0.011 | |||||
| Q12081011 | 1.106/12 | 1.299/11 | … | … | … | …… | … | ||||
| Q14222309 | 0.543/13 | 0.594/12 | … | … | … | … | … | … | |||
| 1.175/11 | 1.475/10 | … | … | … | … | … | … | ||||
| 0.838/45 | 0.852/44 | … | … | … | … | … | … | ||||
| 1.272/11 | 1.430/10 | … | … | … | … | … | … | ||||
| Q14422931 | 0.738/67 | 0.750/66 | … | … | … | … | … | … | |||
| HS16033820 | 0.891/9 | 0.972/8 | … | … | … | … | … | … | |||
| Q17006416 | 1.297/12 | 1.407/11 | … | … | … | … | … | … | |||
| 0.951/87 | 0.967/86 | … | … | … | … | … | … | ||||
v
-
1.
[
wabs(zpow)] Simple power-law continuum (at the redshift of the source) without intrinsic absorption at the source. The free parameters of this model are the photon index, , and the normalization (i.e., the photon flux per unit energy at 1 keV). -
2.
[
wabs*zwabs(zpow)] Simple power-law continuum (at the redshift of the source) with intrinsic absorption. This model has an additional free parameter compared to the previous model, the column density of the intrinsic absorber, . Simple models of this type can underestimate the column density of the absorber, if the absorber is ionized or if it covers the source only partly. Therefore, we also test the more complex absorption models listed below. -
3.
[
wabs(zpow)+const*wabs*zwabs(zpow)] Power-law continuum (at the redshift of the source) with partial coverage intrinsic absorption. In this model, the absorber is assumed to cover the projected area of the X-ray source only partially. The free parameters are those of the previous model plus the coverage fraction (the fraction of photons that pass through the absorber). -
4.
[
wabs*absori(zpow)] Power-law continuum (at the redshift of the source) with ionized intrinsic absorption (following Done et al. 1992; see also Zdziarski et al. 1995). The free parameters are the normalization and photon index of the power-law continuum, and the column density and ionization parameter of the absorber, 444, where is the luminosity of the source between 5 eV and 300 keV, is its distance from the absorber, and is the hydrogen number density of the absorber. The temperature of the absorber was held fixed at 30,000 K, while the iron abundance was held fixed at the Solar value. -
5.
[
wabs(pexrav)] Power-law continuum (with an exponential cutoff at 100 keV) “reflected” from a nearly-neutral slab (with solar abundances; see George & Fabian 1991; Magdziarz & Zdziarski 1995). -
6.
[
wabs*zwabs(pexrav)] Power-law continuum “reflected” from a nearly-neutral slab with intrinsic absorption included.
In addition to the above models we also experimented with adding a Gaussian Fe K line to the simple power law model as well with broken power-law models with and without absorption.
| Quasar | () | bbReduced and number of degrees of freedom. | |
|---|---|---|---|
| (1) | (2) | (3) | (4) |
| Q00148118 | 1.103/379 | ||
| Q01304021 | 1.000/58 | ||
| Q11074847 | 1.202/46 | ||
| Q14422931 | 0.716/69 | ||
| Q17006416 | 0.938/89 |


![[Uncaptioned image]](/html/0801.1692/assets/x9.png)
![[Uncaptioned image]](/html/0801.1692/assets/x10.png)
![[Uncaptioned image]](/html/0801.1692/assets/x11.png)
![[Uncaptioned image]](/html/0801.1692/assets/x12.png)
![[Uncaptioned image]](/html/0801.1692/assets/x13.png)
![[Uncaptioned image]](/html/0801.1692/assets/x14.png)
![[Uncaptioned image]](/html/0801.1692/assets/x15.png)
![[Uncaptioned image]](/html/0801.1692/assets/x16.png)
![[Uncaptioned image]](/html/0801.1692/assets/x17.png)
![[Uncaptioned image]](/html/0801.1692/assets/x18.png)
![[Uncaptioned image]](/html/0801.1692/assets/x19.png)
![[Uncaptioned image]](/html/0801.1692/assets/x20.png)
![[Uncaptioned image]](/html/0801.1692/assets/x21.png)
![[Uncaptioned image]](/html/0801.1692/assets/x22.png)
![[Uncaptioned image]](/html/0801.1692/assets/x23.png)
![[Uncaptioned image]](/html/0801.1692/assets/x24.png)
We find that the simplest models from the above list provide an adequate fit to most of the spectra, in part because of the modest signal-to-noise ratio () of the spectra. In Figure 1, we show the spectra with the best-fitting power law model with intrinsic absorption (model 2) superposed. In the same figure, we also show the confidence contours in the – plane for the same model. In Table 3 we list the best-fitting values of the photon index for model 1 (simple power law) as well as the photon index and intrinsic column density for model 2 (simple power law with intrinsic absorption). In cases where a complex model provides a better fit to the spectrum than the simple, unabsorbed power law, we also list the best-fitting parameters of the complex model. In Table 4 we list the values (or limits) of the column density obtained from the ionized absorber model (model 4). In this table, we only include those objects whose spectra (typically from XMM-Newton) included more than 1000 counts and yielded “interesting” results.
In 9 out of 12 spectra the simple power law without intrinsic absorption (model 1) provides the best fit. In another two spectra (Q01304021 and Q11074847), the improvement in the goodness of the fit resulting from a more complex model is only marginal (see Table 3 and the discussion in §4.2, below). The remaining object is Q0014+8118, the only case where we are able to detect significant intrinsic absorption with a column of . This quasar happens to be the brightest quasar in our sample by far, with more than 13,000 counts in its XMM-Newton pn spectrum; we discuss this case further in §4.2 and §6.3. The best-fitting values of the photon index are in the range 1.5–2.3, which are well within the range of photon indices found in radio-quiet quasars at –3 (Vignali et al. 2001).
Thus, our primary observational result consists of the upper limits on (and one measurement of) the column density of a nearly-neutral absorber in the rest frame of the quasar. These were determined in a uniform and systematic fashion using the absorbed power-law model (model 2) and are listed in column 5 of Table 3. The limits correspond to the 90% confidence intervals shown in the contour plots of Figure 1 and are of order cm-2. The use of more complex models did not result in more restrictive limits (most likely because of the larger number of free parameters in these models). Thus the limits in column 5 of Table 3 also incorporate the uncertainty resulting from the use of more complex models for the continuum. We note that these limits are considerably lower than the intrinsic column densities detected in BAL quasars, cm-2 (e.g., Gallagher et al. 2006, and references therein). In the case of an ionized absorber, the data allow for higher column densities. The corresponding limits were derived in the same fashion as for the nearly-neutral absorber and they turn out to be approximately one order of magnitude higher than than in the case of the neutral absorber. They are listed in column 3 of Table 4.
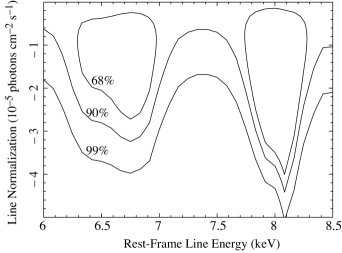
We also searched for absorption lines in the vicinity of the Fe K transition by adding an unresolved ( keV) Gaussian line with negative normalization to the power-law continuum. This was motivated by the detection of such absorption lines in high-redshift quasars by several authors, as we discuss further in §6.4. Our search yielded interesting limits only in the case of Q0014+8118, which has by far the highest- spectra of all the quasars in our sample. These limits are shown graphically in Figure 2 where we plot the normalization of the Gaussian component (i.e., the integral of the Gaussian) as a function of rest-frame energy in the spectrum. Given the redshift of this quasars and its continuum photon index, we can relate the absolute value of the normalization of the Gaussian line, , to the rest-frame equivalent width, , analytically as
| (1) |
where is the rest-frame energy of the absorption line. Thus, according to Figure 2, at a rest-frame energy of 6.7 keV the 99% upper limit to the absolute value of the equivalent width is 28 eV, while at a rest-frame energy of 7.4 keV this limit is 13 eV.
| (2–10 keV)aaThe 2–10 keV flux in the observed frame, corrected for absorption in the ISM of the Milky Way (and for intrinsic absorption in the case of Q00148118). | (2–10 keV)bbThe rest-frame 2–10 keV luminosity, corrected for absorption and scaled down to account for the lensing magnification in the case of the two lensed quasars, Q12081011 and Q14222309. | ccThe rest-frame flux density per unit frequency at an energy of 2 keV (corrected for Milky Way absorption but not intrinsic absorption; see §5). The uncertainties are %. | |||
|---|---|---|---|---|---|
| Quasar | () | (erg s-1) | (nJy) | ddThe optical-to-X-ray spectral index computed from equation(2) without corrections for intrinsic absorption. The uncertainties are discussed in §5 of the text. | eeThe difference between the observed value of and the value expected based on the UV luminosity of the quasar (see details in §5 of the text). For quasars with multiple X-ray observations, we only report the value of for the observation with the highest . |
| (1) | (2) | (3) | (4) | (5) | (6) |
| Q00148118 | 126 | ||||
| Q01304021 | 11.3 | ||||
| Q11074847 | 3.65 | ||||
| Q12081011 | 2.36 | ||||
| Q14222309 | 0.93 | … | |||
| 1.61 | … | ||||
| 1.86 | … | ||||
| 1.29 | |||||
| Q14422931 | 16.5 | ||||
| HS16033820 | 6.1 | ||||
| Q17006416 | 5.06 | … | |||
| 12.5 |
4.2. Notes on Individual Quasars
- Q0014+8118. —
-
Page et al. (2004) presented the XMM-Newton spectrum of this quasar in their analysis of the X-ray Baldwin effect. We reduced the same XMM-Newton data taken on 2001 August 23 for 14.3 ks (pn) and 16.9 ks (MOS) (Obs-ID: 0112620201, PI: Turner). The spectrum was binned with a minimum of 50 counts per bin. The rest-frame 2–10 keV luminosity that we obtain is in good agreement with that of Page et al. (2004); they do not report any of the parameters of the best-fitting model. This is the only object in which we detect an intrinsic absorber unambiguously, with a column of cm-2. The fully and partially covered, neutral absorber models, and the ionized absorber model (models 2, 3, and 4) yield a significantly better fit than the simple power-law model (model 1), as shown by the F-test (see chance probabilities in Table 3). The ionized absorber model of Done et al. (1992), as implemented in XSPEC, is not self-consistent, therefore its results must be regarded with caution. In particular, the temperature and ionization parameter are treated as independent parameters instead of being calculated self-consistently from a full photoionization model. Therefore, we verified the results using a rigorous photoionization model, computed by the code XSTAR555http://heasarc.gsfc.nasa.gov/docs/software/xstar/xstar.html (Kallman et al. 2004). The latter model yielded a column density for the ionized absorber of and an ionization parameter of (where is in units of erg cm s-1). In comparison, the fit with model 4 (
absori) yields and an ionization parameter of , corresponding to 666The ionization parameters in the XSTAR and absori models are defined in a slightly different way. The former involves the continuum luminosity from 1 Ry to 1000 Ry, while the latter involves the continuum luminosity from 5 eV to 300 keV. They can be related if one assumes a specific shape for the spectral energy distribution. Here we make the assumption that the spectral energy distribution is that of Mathews & Ferland (1987) but we change the X-ray photon index to 1.49 so that it agrees with what we measure for Q0014+8118. Under this assumption we find that ., consistent with the XSTAR results.Models 2, 3, and 4, as well as the XSTAR-based model, appear to provide equally good fits to the spectrum, indicating that excess absorption is present in the spectrum of Q0014+8118 but the properties of the ionization state and coverage fraction of the absorber are not well constrained. Thus, we adopt model 2 as the working model for this object in the discussion below because it is the simplest one. However, we return to this case in §5 and §6 to discuss the implications of the measured column density and to constrain the location and properties of the absorber with the help of additional evidence.
- Q0130-4021. —
-
Page et al. (2003) searched for AGNs in the XMM-Newton field of this quasar, and detected 9 objects including Q01304021 itself. We reduced the same XMM-Newton data taken on 2001 June 04 for 23.0 ks (pn) and 25.2 ks (MOS) (Obs-ID: 0112630201, PI: Turner). The pn and MOS spectra were binned with a minimum of 50 and 30 counts per bin, respectively. Model 5 (power law plus Compton reflection) provides a marginally better fit than model 1 (simple power-law model) to the XMM-Newton spectrum of this object, (see Table 3). However, the fit with model 5 appears to be as good as the fit with model 2 (absorber power-law).
- Q1107+4847. —
-
XMM-Newton observed this target twice on 2002 April 25 and June 1. The analysis of the second data set was presented by Brocksopp et al. (2004). They fitted the spectra with a power law model with photon index of = 1.96 and obtained an upper limit on the intrinsic absorption of cm-2 with 99% confidence. We examined both XMM-Newton data sets (Obs-ID: 0059750401 and 0104861001, PI: Mann and Mason), but reduced only the second one because the first observation was performed during a period of high background (background-to-signal ratio is 20). The pn and MOS spectra were binned with a minimum of 50 and 15 counts per bin, respectively. The results of our fits are consistent with the results of Brocksopp et al. (2004). Model 6 (power law plus Compton reflection and intrinsic absorption) provides an equally good fit to the XMM-Newton spectrum of this object as model 1 (simple power-law model) and model 2 (absorber power-law).
- Q1208+1011. —
-
This gravitationally lensed quasar was originally found by Hazard, McMahon, & Sargent (1986). It comprises two split images separated by 047 with a brightness ratio of about 4, based on the observations with ground-based telescopes (Magain et al. 1992) and the Hubble Space Telescope (HST) (Bahcall et al. 1992b). Giallongo et al. (1999) derived a total magnification factor of , which was later revised to by Barvainis & Ivison (2002). We extracted the spectrum of this quasar by summing the counts from all images and then scaled down the luminosity according to the latter magnification factor listed above.
Dai et al. (2004) analyzed the Chandra data of this quasar and fitted the spectrum with a power law and a Gaussian emission line without intrinsic absorption. They found a best-fitting photon index of and derived value of . We repeated the reduction of the same Chandra data (Obs-ID: 3570 PI: Garmire). The spectrum was binned with a minimum of 10 counts per bin. The spectral parameters that we derive are consistent to those obtained by Dai et al. (2004).
- Q1422+2309. —
-
This is a gravitationally-lensed, radio-loud quasar, consisting of 4 images. Kormann, Schneider, & Bartelmann (1994) explored lensing models based on elliptical mass distribution and derived a total magnification factor of . Three Chandra (Obs-ID: 367, 1631, and 4939 PI: Garmire) and XMM-Newton observations (Obs-ID: 0143652301 PI: Georgantopoulos) were carried out over a span of four years. Among the four lensed images resolved by Chandra, the brightest two images are probably affected by pileup at least in their central few pixels (Grant et al. 2004). Since the faintest image is not bright enough to be detected in the Chandra data, we extracted a spectrum only from image C, the third brightest image. The magnification factor for this particular image, according to Kormann et al. is , thus we scaled down the luminosity accordingly. The spectra from the three Chandra observations were binned with a minimum of 25, 15, and 50 counts per bin, respectively. In our analysis of the XMM-Newton observation, we used only the MOS data because in the pn the image fell on a chip gap. We summed all the counts from the MOS images since the four lensed images were not resolved. We binned the extracted spectrum with a minimum of 10 counts per bin and we scaled down the luminosity by a factor of .
- Q1442+2931. —
-
An analysis of the XMM-Newton spectrum of this quasar was presented by Ferrero & Brinkmann (2003). They fitted with a power-law and obtained a photon index of 1.87. They found no evidence of an Fe H line. We re-analyzed the same XMM-Newton data (Obs-ID: 0103060201, PI: Aschenbach). The spectra were binned with a minimum of 50 counts per bin. Our derived values of the photon index and of are consistent with those of Ferrero & Brinkmann (2003).
- HS1603+3820. —
-
The short Chandra observation of this quasar yielded only 137 counts. The spectrum was binned with a minimum of 10 counts per bin. An independent analysis of the same X-ray data by Dobrzycki et al. (2007) yields results consistent with ours.
- Q1700+6416. —
-
There are two clusters of galaxies discovered near the quasar, RX J1701.36416 at = 0.45 and Abell 2246 at = 0.22. Both the Chandra and the XMM-Newton observed this quasar field for a purpose of studying these clusters (Lumb et al. 2004; Georgantopoulos & Georgakakis 2005) and serendipitously detected a number of low-redshift galaxies in the field (Hornschemeier et al. 2005). We reduced the Chandra data (Obs-ID: 547, PI: Vanspeybroeck) and the XMM-Newton data (Obs-ID: 0107860301, PI: Jansen) and we present the spectrum of Q1700+6416 for the first time. Although the XMM-Newton exposure was terminated prematurely and most of it was dominated by high background from the particle belt (Lumb et al. 2004), we were still able to extract spectra of acceptable quality. The Chandra spectrum was binned with a minimum of 20 counts per bin. The XMM-Newton pn and MOS spectra were binned to a minimum of 50 and 15 counts per bin, respectively, at keV and to a minimum of 150 and 45, respectively at keV.
5. Relations Between UV and X-ray Properties
The relation between the UV and X-ray luminosity of quasars, is often quantified by means of the optical-to-X-ray spectral index, . This is the index of a power law connecting the points in the rest-frame spectral energy distribution at 2500 Å and 2 keV. Here we adopt the convention that and we obtain from
| (2) |
where , , , and are the flux densities per unit frequency and frequencies at 2 keV and 2500 Å, respectively. The above definition was originally introduced by Tananbaum et al. (1979) but several authors since then have used the flux density at 3000 Å instead of 2500 Å (e.g., Brandt et al. 2000; Gallagher et al. 2001). In this paper, we adopt the frequencies used in the original definition. The values of obtained from the two different conventions are related by , where is the power-law index between 2500 and 3000 Å (; see Brandt et al. 2000). Vanden Berk et al. (2001) find that .
The flux densities at a rest-frame energy of 2 keV, , without corrections for intrinsic absorption, were determined from the fits of the the absorbed power-law model (model 2) to the spectra and are listed in Table 5. These were combined with from Table 1 to compute the value of , which we also list in Table 5. The uncertainty in is , where and are, respectively, the uncertainties in the X-ray and UV fluxes, resulting from measurement errors or variability of the source (since the UV and X-ray observations were not simultaneous). In the absence of absorption, the measurement error in is dominated by the uncertainty in the photon index and under this condition it is given by , where is the uncertainty in . For a typical value of , , which contributes an uncertainty of approximately 1–2% to . Unfortunately, we cannot assess the contribution of variability to the uncertainty in because of the lack of systematic monitoring data, however, we do note that changes of order unity in either the X-ray or the UV flux change by an amount of order 0.1.
Intrinsic absorption, especially in the UV, is the largest source of uncertainty in the value of . This uncertainty arises because we are not able to assess the dust content of the absorber. On one hand, the presence of low- and intermediate-ionization absorption lines in the rest-frame UV spectra of 3/4 quasars with intrinsic NALs suggests that the the ionization state may be low enough for dust to be present. More specifically, the system in Q17006416 shows the Si II 1260 and C II 1335 lines (I.P. of 16.3 eV and 24.4 eV, respectively; both lines are observed in the interstellar medium), while the system in Q11074847 shows the C II 1335 line (Misawa et al. 2007b). The spectrum of HS16033820 presented by Dobrzycki et al. (2007) shows a weak Mg II 2800 doublet (I.P. of 15.0 eV) in the mini-BAL system at (the spectra presented in Misawa et al. 2007a,b do not cover the spectral region of the Mg II doublet in any of these quasars). On the other hand, the values of of the quasars with intrinsic NALs in our sample are the same as those of normal quasars (see the comparisons later in this section). Since UV extinction by dust can affect significantly (as we detail below), this result suggests that UV extinction in quasars with intrinsic NALs is not higher than in normal quasars.
We discuss the effects of absorption in detail in the Appendix where we also emphasize the uncertainties and outline a scheme for applying corrections. If the dust-to-gas ratio in the intrinsic absorber is similar to that found in the ISM of the Milky Way, intrinsic UV absorption could have a dramatic effect on the value of . Specifically, absorption through an intrinsic column of cm-2, would change by 1.5 [see equation(A4)]. However, the gas-to-dust ratio in intrinsic absorbers is extremely uncertain, thus corrections to based solely on the absorbing column measured from X-ray spectra are rather unreliable. A good case in point is provided by Q0014+8118, the only quasar in our sample with a measurable intrinsic column density. The rest-frame 2 keV flux density, corrected for intrinsic absorption, is nJy. An analogous correction to the rest-frame 2500 Å flux density, assuming the column inferred from the X-ray spectrum and applying equation (A3), gives Jy, leading to , which is unreasonable. We return to this case and discuss it further in §6.3.
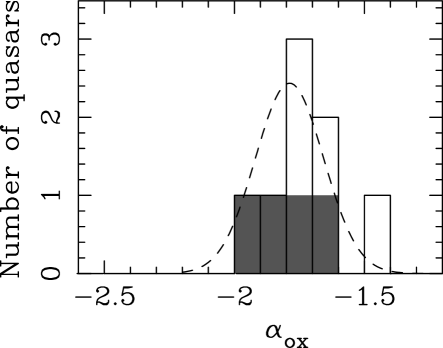
In Figure 3 we show the distribution of values of among the quasars in our sample, separating the quasars with intrinsic NALs from those without. For two quasars observed more than once, Q14222309 and Q17006416, we plot only a single, representative value of ; we choose the value obtained from the deepest X-ray exposure, which happens to be the last observation of each object. In the same figure, we overplot the distribution of among optically bright quasars, as reported by Steffen et al. (2006). This comparison suggests that there is no discernible difference between the quasars in our collection hosting intrinsic NALs and other quasars of comparable luminosity and redshift.
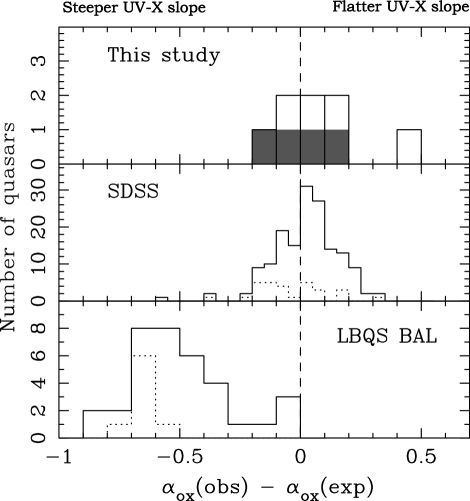
An alternative way of making this comparison is shown in Figure 4, where we plot the distribution of the difference between the observed values of and that expected based on the quasar’s monochromatic UV luminosity, (the values of are included in column 6 of Table 5). More specifically, Strateva et al. (2005) and Steffen et al. (2006) find a correlation between the monochromatic luminosity density at 2500 Å, , and for a large sample of radio-quiet quasars, spanning a wide redshift range. We adopt the form that includes a weak dependence on redshift, given in equation (5) of Steffen et al. (2006) as (the UV-to-X-ray slope becomes steeper as the UV luminosity increases). A negative value of indicates that the UV-to-X-ray slope is steeper than expected, which would result either from a suppressed X-ray flux or an enhanced UV flux. With this in mind, we plot in Figure 4 the distribution of among our quasars (without any intrinsic absorption corrections to ) and we compare it with the corresponding distribution in the Steffen et al. (2006) sample (top and middle panels, respectively). The two distributions appear very similar, reinforcing our conclusion that there is no discernible difference between the X-ray and UV properties of quasars with and without intrinsic NALs. The only quasar in our sample that appears to be an outlier in the top panel of Figure 4 is Q0014+8118. This is, in fact, a radio-loud quasar, whose absolute value of is expected to be systematically smaller than those of radio-quiet quasars (see, for example, Wilkes et al. 1994).
We extend our comparison of UV and X-ray properties by plotting the variation of properties of C IV NALs (rest equivalent width, 777Here we use the total equivalent width, summed over all the intrinsic NALs in the same quasar., and maximum blueshift velocity, ) with . In this context, we take to be an indicator of X-ray absorption, under the assumption that the UV flux is unabsorbed – this amounts to neglecting the second term in equation (A2). In Figure 5 we plot and against . In the former plot we overplot the data points describing nearby PG quasars from Brandt et al. (2000)888The C IV NALs in the sample of Brandt et al. (2000) are associated to the quasars but they are not necessarily intrinsic. We converted the values of in Brandt et al. (2000), evaluated using the 3000 Å UV flux, to the convention used here, as described at the beginning of §5. to show that the quasars in our sample with intrinsic NALs follow the general anti-correlation between and . However, since our sample is rather small, this result requires verification using a considerably larger sample of quasars with intrinsic NALs. In the latter plot, there is no obvious trend between and ; we return to this issue in §6, where we compare intrinsic NALs to BALs and place them in the broader context of intrinsic absorption lines in quasars.
6. Summary of Results and Discussion
The results presented above show that there are no differences in X-ray properties between quasars with and without intrinsic NALs in our sample. The spectra of all the quasars in our sample can be described by a very simple model, namely a power law modified by absorption by nearly-neutral matter at the redshift of the source. In all but one quasar, we are only able to obtain upper limits to the column density of the intrinsic X-ray absorber; these limits are of order a few cm-2. The possibility that the intrinsic X-ray absorbers are ionized can be neither confirmed nor ruled out based on the data we have analyzed here. The only quasar in which we have found a measurable column density is Q0014+8118 ( cm-2), which does not host any intrinsic NALs. We discuss this quasar further below. Our comparison with larger samples of quasars of comparable luminosity and redshift shows that quasars with intrinsic NALs do not differ from the general population in either their X-ray spectra or their spectral energy distributions as quantified by . The rest-frame equivalent widths of intrinsic NALs follow the same trend with as nearby quasars and Seyfert galaxies, suggesting a relation between the medium responsible for the intrinsic NALs and the medium responsible for the X-ray continuum absorption. However, X-ray observations of a larger sample of quasars with intrinsic NALs is sorely needed to strengthen our conclusions. A conclusion that follows immediately from the above results is that outflows that manifest themselves in the form of intrinsic NALs could be present in all quasars. We showed in our earlier work that intrinsic NALs are very common (occurring in 50% of all quasars at –4; Misawa et al. 2007b) and the results presented here indicate that the typical spectral characteristics of quasars in general do not preclude their hosting intrinsic NALs.

In the remainder of this section, we compare the properties of quasars with intrinsic NALs from our sample with those of BAL quasars studied by other authors, we use our results to constrain scenarios for the geometry and location of the intrinsic NAL gas, and we discuss the properties of the absorber in Q0014+8118. We conclude by noting open questions and possible directions for future work.
6.1. Comparison with BAL quasars
We compare the properties of the NAL quasars in our sample with those of BAL quasars in the sample of Gallagher et al. (2006) and very red quasars from Hall et al. (2006); their redshifts are between 1.4 and 2.8 and their luminosities are comparable to those of our quasars. In Figure 4, we show the distribution of measured values of among BAL quasars on the same scale as the distribution of among quasars in our sample. There is an obvious difference between the two distributions; a Kolmogorov-Smirnov test yields a chance probability of 0.003 that the intrinsic NAL quasars in our sample and the BAL and very red quasars from the bottom panel of Figure 4 were drawn by chance from the same parent population. This suggests that the X-ray source in intrinsic NAL quasars is not as heavily obscured as in BAL quasars (see the discussion of the distribution in BAL quasars by Gallagher et al. 2006).
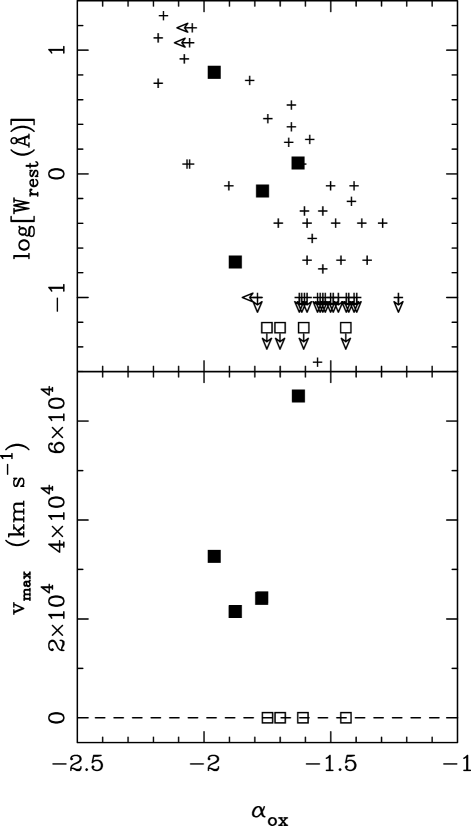
In Figure 6, we plot properties of UV BALs as well as the X-ray photon index for the Gallagher et al. (2006) sample against . In the same plots we include the quasars from our own sample for comparison. The top two panels of Figure 6 suggest that quasars with intrinsic NALs fit in a progression between BALs and “normal” quasars. As the rest-frame equivalent width of the C IV absorption line decreases, increases, in a manner that is qualitatively consistent with a decrease in the column density of the absorber. This picture is supported by the photon index vs plot, where quasars with intrinsic NALs occupy the low-column-density end of the BAL distribution. It is reassuring that the mini-BAL quasar in our sample, HS1603+3820, falls closer to the BAL locus in both of the top two panels of Figure 6 (as well as in the top panel of Fig.5) than the intrinsic NAL quasars.
In contrast, in the plot of maximum blueshifted velocity vs shown in the bottom panel of Figure 6, quasars with intrinsic NALs do not fit into the BAL sequence, even though this sequence appears to connect smoothly to the “normal” quasars. This behavior can be reconciled with the behavior seen in the top two panels of the same figure in the context of an equatorial wind scenario. In the top two panels of Figure 6 the BAL quasar tracks are defined primarily by the column density of the absorbing medium since , , and are all measures of the column density (the values of of BAL quasars were inferred from the hardness ratio, thus they are directly affected by absorption and so are the 2 keV flux densities that are based on the same data). On the other hand, the orientation of the outflow relative to the line of sight and the acceleration mechanism play an important role in defining the BAL quasar track in the bottom panel of this figure, since they influence the value of (see for example, the discussion in Gallagher et al 2006). Therefore, the deviation of intrinsic NAL quasars from the BAL track suggests that the NAL gas is not part of the dense BAL flow thought to be located near the base of the wind, although it may still be associated with it. In other words, our line of sight through the NAL gas does not generally pass through the dense BAL gas. This conclusion also serves as a test of scenarios for the location of the NAL gas within the greater outflow, as we explain further in §6.2, below.
6.2. Geometry and Location of Absorbing Medium
Using our observational results, we can test and constrain scenarios for the location of the intrinsic NAL gas in an (equatorial) accretion-disk wind whose dense, low-latitude parts are likely to give rise to BALs. The two competing scenarios are depicted in Figures 1–3 of Elvis (2000) and in Figure 13 of Ganguly et al. (2001). Elvis (2000) proposed that quasars with intrinsic NALs are viewed at a large inclination angle relative to the disk/wind axis (larger than in the case of BALs). As a result the column density through the NAL line of sight is cm-2 and the apparent blueshift of the intrinsic NALs should be considerably smaller than that of BALs, ( km s-1). On the other hand, in the Ganguly et al. (2001) picture the NAL gas is located above the BAL gas, closer to the axis of the disk/wind. The column density is lower because the NAL gas is distributed in small parcels and the blueshifts can be as high as those found in BALs (or even higher).
Our results favor the Ganguly et al. (2001) scenario for a number of reasons. First, we do not detect large absorbing column densities; we find that cm-2 in all of our quasars. Second, the observed blueshifts of intrinsic NALs are comparable to or higher than those of BALs, suggesting that the absorbing gas is not associated with the base of the wind. Rather, this gas should have traveled an appreciable distance from its launch point and attained a speed close to its terminal speed (see, for example, Murray et al. 1995 and Hamann 1998). Third, the comparison of intrinsic NALs and BALs presented above (§6.1 and bottom panel of Fig. 6) shows that the intrinsic NALs do not connect smoothly to the BAL sequence in the – diagram, suggesting that the NAL gas is not a part of the dense BAL flow. In contrast, the Ganguly et al. scenario passes these tests and also places the NAL gas far enough away from the central continuum source so that (a) it is not highly ionized, and (b) it can be accelerated to a high speed.
6.3. The Case of Q0014+8118
Q0014+8118 is the only quasar in which we have found excess absorption but it is also a quasar not known to have intrinsic UV NALs. We explore here whether these two observational results can be reconciled. We have re-examined the rest-frame UV spectrum of this quasar presented in Misawa et al. (2007b) and found no strong absorption lines near the redshift of this quasar, which could be attributed to a neutral absorber with the column density comparable to that measured in the X-ray spectrum. We did, however, find an intervening absorption line system at with strong Fe II2600, Mg II2796,2803 and Mg I2853 absorption lines with the following rest-frame equivalent widths: Å, Å, and Å. This raises the possibility that the excess X-ray absorption is associated with the lower-redshift intervening system. We consider each of these two scenarios in turn.
To assess whether the X-ray absorber could be intrinsic to the quasar, we have carried out a number of photoionization simulations using the code Cloudy (Ferland et al. 1998) adopting the Mathews & Ferland (1987) model for the quasar spectral energy distribution (but modified to match the X-ray photon index of Q0014+8118), a Solar metallicity and abundance pattern, the total Hydrogen column density determined from the X-ray spectrum, and two different values of the density ( and cm-3; the results turn out not be sensitive to the density). We computed four models with ionization parameters corresponding to , 1.84, 2.24, and 2.54, which span the range of values inferred for the X-ray absorber (see §4.2). In all cases, the equivalent widths of the C IV, N V, and O VI absorption lines are large enough that these lines should have been detected in the high-resolution spectrum presented in Misawa et al. (2007b). Missing these lines would require a rather unlikely set of circumstances, namely: the ionization parameter should be at the high end of the allowed range so that the lines are weak and the outflow velocity should be such that the C IV line is out of the range of the observed UV spectrum, the N V line should fall in the gap between echelle orders, and the O VI line should be hidden in the Ly forest. Therefore, we disfavor the intrinsic interpretation of the absorber.
To assess the intervening absorber hypothesis we make use of the statistical observational results of Rao, Turnshek, & Nestor (2006). According to these authors, an intervening absorber with the observed Fe II, Mg II, and Mg I equivalent widths has a 65% probability of being a damped Ly system (DLA), with an average hydrogen column density of cm-2 and a column density of cm-2 being reasonably likely. Moreover, the observed relative strengths of the Fe II and Mg II lines suggest that the hydrogen column density can plausibly be as high as cm-2, while the observed Mg I strength suggests a 50% probability of cm-2. Thus we favor the intervening absorber hypothesis because the known intervening system at has a high probability of producing just the X-ray absorption we observe. In this context we may also understand the low attenuation of the rest-frame UV light of this quasar. By comparing the colors of large samples quasars with and without DLAs, Ellison, Hall, & Lira (2005) find that the dust content of DLAs is very small and place a limit of on the color excess that they produce.
6.4. Open Questions and Future Prospects
There are a number of outstanding questions that our exploratory survey was not able to address.
-
•
We have not detected an ionized absorber in any of the quasars with intrinsic NALs, even though such features are common in the X-ray spectra of Seyfert galaxies. Contributing factors to this were the low of the X-ray spectra and the high redshift of the quasars themselves (the signature of a warm absorber is most pronounced at energies that are redshifted out of the observable band). Detecting or placing limits on a warm absorbing medium is important because it provides a test of models for the structure of the outflow (especially the ionization structure at high latitudes above the disk; see, for example, Proga et al. 2000). Moreover, a warm medium has been invoked to interpret the variability of mini-BALs (see the discussion of HS1603+3820 by Misawa et al. 2007a).
-
•
We have not detected high-velocity X-ray absorption lines in any of our spectra. This is not a surprise since such lines are rare. More specifically, unresolved lines have been found in about half a dozen Seyfert galaxies and quasars at , including MCG-5-23-16 (Braito et al. 2006), IC 4329a (Markowitz et al. 2006), IRAS 13197-1627 (Dadina & Cappi 2004), Mrk 509 (Dadina et al. 2005), and PG 1211+143 (Pounds et al. 2007). The observed outflow velocities are of order , while the rest-frame equivalent widths typically range between 10 and 100 eV. Broader, and somewhat stronger absorption lines have also been detected in a handful of high-redshift quasars (–4), namely PG 1115+080 (Chartas et al. 2003, 2007a), H 1413+117 (Chartas et al 2007b), and APM 08279+5255 (Chartas et al. 2002; Hasinger et al. 2002). In these cases the outflow speeds are of order a few tenths of the speed of light and the rest-frame equivalent widths range between a few hundred eV and a few keV. In addition to the cosmological implications of high-velocity X-ray absorption lines noted in §1, their detection will also help us constrain the ionization state of the NAL gas. The limits we have set for Q0014+8118 are rather stringent ( eV), comparable to the weakest lines ever detected. In other quasars in our sample the limits are considerably higher, thus uninteresting, owing to the worse in their X-ray spectra. Nevertheless, it is interesting that the absence of high-velocity X-ray absorption lines in Q0014+8118 coincides with the absence of intrinsic UV NALs.
-
•
Our results, especially Figure 6, raise the issue of whether the UV and X-ray properties of NAL quasars connect smoothly to those of BAL quasars. Related to this issue is the question of where do mini-BALs fall in the grand scheme of things. Even though we have found some tantalizing trends, our sample of objects is too small for a firm conclusion on these issues. In this respect, further observations of mini-BALs would be particularly useful because they may fill in the gap between NALs and BALs in Figure 6.
The above questions can be addressed by employing two complementary strategies in future observations. Long exposures of selected objects can yield high- X-ray spectra that can be used for a sensitive search for warm absorbers or high-velocity X-ray NALs. At the same time, (relatively shallow) observations of larger samples of quasars hosting NALs and especially mini-BALs will allow us to explore connections between the corresponding quasar populations.
Appendix A Relation Between UV and X-Ray Extinction and Effect on the Value of .
The observed UV flux is attenuated in the rest frame of the quasar according to , where is the extinction at 2500 Å in magnitudes. After passing through the ISM of the Milky Way, the quasar UV light is attenuated further by a factor of (where Å and is the redshift of the quasar). However, for quasars at , the latter factor is negligible compared to the former because falls in the near-IR band and . The extinction law of Seaton (1979) gives
| (A1) |
where is the visual extinction and is the color excess or “reddening” ( is the extinction in the B-band). All extinction laws currently available (including the SMC law, which is thought to describe the extinction in the UV spectra of quasars at ; see Hopkins et al. 2004) are very similar at Å. This is illustrated in Figure 1 of Prévot et al. (1984) and in Figure 1 of Calzetti, Kinney, & Storchi-Bergmann (1994).
Similarly, the X-ray flux is attenuated according to: , where is the equivalent hydrogen column density and is the photoelectric absorption cross-section at 2 keV. According to Morrison & McCammon (1983), , determined by the abundance of Mg and Si (both -elements). We note that Morrison & McCammon (1983) adopt the elemental abundances of Anders & Ebihara (1982), while different authors (namely, Anders & Grevesse 1989; Feldman 1992; Grevesse & Sauval 1998) derive abundances for these two elements that are within % of that value. A potential cause for concern are the high metal abundances observed in the immediate vicinity of quasar central engines (see Hamann & Ferland 1999 for a review). More specifically, Hamann et al. (2002) find that -elements, such as C and O, are overabundant in the broad-emission line regions of quasars by a factor of relative to the Sun. This will likely affect the X-ray attenuation at 2 keV, but the more important question is whether it will also affect the UV attenuation in the same manner. The answer to this question is unclear as it depends on whether the higher metal abundance in that gaseous phase is also accompanied by a similarly higher abundance of dust grains, which are responsible for the UV extinction.
Inserting the expressions for the observed fluxes into the definition of in equation (2), we obtain
| (A2) |
where . The first term on the right-hand side of equation (A2) represents the effect of X-ray attenuation, while the second term represents the effect of UV extinction. The relative importance of these two terms can be assessed by noting that in the Milky Way the dust-to-gas ratio is such that
| (A3) |
(Predehl & Schmitt 1995). Therefore the second term on the right-hand side of equation (A2) (UV extinction) is aproximately 30 times more important than the first term (X-ray attenuation), if the gas-to-dust ratio is comparable to that in the Milky Way. If we insert equation (A3) into equation (A2), we get
| (A4) |
Equation (A4) relies on the assumption that the value of (determined by the dust-to-gas mix) in the vicinity of the quasar is the same as that in the Milky Way. This need not be true in general. It is possible, for example, that the intrinsic absorber is close enough to the quasar continuum source that the intense radiation field destroys the dust grains (e.g., Netzer & Laor 1993). Another possibility is that the dust grain distribution in the absorber is different from that in the Milky Way, as is the case with very-high redshift quasars (at ; see Maiolino et al. 2006 and references therein). Therefore, equation (A2) is preferable to equation (A4), as long as can be determined independently from . An illustrative example of the dangers of applying equation (A4) without due caution is provided by the quasar Q0014+8118, discussed in §5. Even though a significant column is detected in absorption in the X-ray spectrum of this quasar, its rest-frame UV light does not appear to be significantly attenuated.
References
- Anders & Grevese (1989) Anders E. & Grevesse N., 1989, Geochimica et Cosmochimica Acta, 53, 197
- Anders & Ebihara (1982) Anders E. & Ebihara, 1982, Geochimica et Cosmochimica Acta, 46, 2363
- Arav et al. (1994) Arav, N., Li, Z-Y, & Begelman, M.C., 1994, ApJ, 432, 62
- Arnaud et al. (1996) Arnaud, K.A., 1996, in ASP Conf. Ser. 101, Astronomical Data Analysis Software and Systems V, ed. G. Jacoby & J. Barmes (San Francisco: ASP), 17
- Bahcall et al. (1992) Bahcall, J.N., Maoz, D., Schneider, D.P., Yanny, B., & Doxsey, R., 1992, ApJ, 392, 1L
- Balsara & Krolik (1993) Balsara, D.S. & Krolik, J.H., 1993, ApJ, 402, 109
- Barlow & Sargent (1997) Barlow, T.A., & Sargent, W.L.W., 1997, AJ, 113, 136
- Barvainis & Ivison (2002) Barvainis, R. & Ivison, R., 2002, ApJ, 571, 712
- Begelman et al. (1983) Begelman, M.C., McKee, C.F., & Shields, G.A., 1983, ApJ, 271, 70
- Blandford & Payne (1982) Blandford, R.D. & Parne, D.G., 1982, MNRAS, 199, 883
- Braito et al. (2006) Braito, V., et al., 2006, Astronomische Nachrichten, 327, 1067.
- Brandt et al. (2000) Brandt, W.N., Laor, A., & Wills, Beverley J., 2000, ApJ, 528, 637
- Brocksopp et al. (2004) Brocksopp, C., Puchnarewicz, E.M., Mason, K.O., Córdova, F.A., & Priedhorsky, W.C., 2004, MNRAS, 349, 687
- Calzetti et al. (2002) Calzetti, D., Kinney, A. L., & Storchi-Bergmann, T., 1994, ApJ, 429, 582
- Chartas et al. (2007a) Chartas, G., Brandt, W.N., Gallagher, S.C., & Proga, D., 2007a, AJ, 133, 1849
- Chartas et al. (2007b) Chartas, G., Eracleous, M., Dai, X., Agol, E., & Gallagher, S., 2007b, ApJ, 661, 678.
- Chartas et al. (2003) Chartas, G., Brandt, W.N., & Gallagher, S.C., 2003, ApJ, 595, 85
- Chartas et al. (2002) Chartas, G., Brandt, W. N., Gallagher, S.C., & Garmire, G. P., 2002, ApJ, 579, 169
- Chelouche & Netzer (2005) Chelouche, D. & Netzer, H., 2005, ApJ, 625, 95
- Chiang & Murray (1996) Chiang, J. & Murray, N., 1996, ApJ, 466, 704
- Dadina et al. (2005) Dadina, M., Cappi, M., Malaguti, G., Ponti, G., & de Rosa, A., 2005, A&A, 442, 461.
- Dadina & Cappi (2004) Dadina, M., & Cappi, M., 2004, A&A, 413, 921.
- Dai et al. (2004) Dai, X., Chartas, G., Eracleous, M., & Garmire, Gordon P., 2004, ApJ, 605, 45
- Dobrzycki et al. (2007) Dobrzycki, A., Nikolajuk, M., Bechtold, J., Ebeling, H., Czerny, B. & Różańska, A., A&A, submitted
- Done et al. (1992) Done, C., Mulchaey, J.S., Mushotzky, R.F., & Arnaud, K.A., 1992, ApJ, 395, 275
- Ellison et al. (2005) Ellison, S.L., Hall, P.B., & Lira, P. 2005, AJ, 130, 1345
- Elvis (2000) Elvis, M., 2000, ApJ, 545, 63
- Emmering, Blandford, & Shlosman (1992) Emmering, R.T., Blandford, R.D., & Shlosman, I., 1992, ApJ, 385, 460
- Everett (2005) Everett, J.E., 2005, ApJ, 631, 689
- Feldman (1992) Feldman U., 1992, Physica Scripta 46, 202
- Ferland et al. (1998) Ferland, G.J., Korista, K.T., Verner, D.A., Ferguson, J.W., Kingdon, J.B., & Verner, E.M., 1998, PASP, 110, 761
- Ferro & Brinkmann (2003) Ferrero, E. & Brinkmann, W., 2003, A&A, 402, 465
- Foltz et al. (1986) Foltz, C.B., Weymann, R.J., Peterson, B.M., Sun, L., Malkan, M.A., & Chaffee, F.H., Jr., 1986, ApJ, 307, 504
- Gallagher et al. (2006) Gallagher, S.C., Brandt, W.N., Chartas, G., Priddey, R., Garmire, G.P., & Sambruna, R.M., 2006, ApJ, 644, 709
- Gallagher et al. (2002) Gallagher, S.C., Brandt, W.N., Chartas, G., Garmire, G.P., & Sambruna, R.M., 2002b, ApJ, 569, 655
- Gallagher et al. (2002) Gallagher, S.C., Brandt, W.N., Chartas, G., & Garmire, G.P., 2002a, ApJ, 567, 37
- Gallagher et al. (2001) Gallagher, S.C., Brandt, W.N., Laor, A., Elvis, M., Mathur, S., Wills, Beverley J., & Iyomoto, N., 2001, ApJ, 546, 795
- Ganguly et al. (2003) Ganguly, R., Masiero, J., Charlton, J.C., & Sembach, K.R., 2003, ApJ, 598, 922
- Ganguly et al. (2001) Ganguly, R., Bond, N.A., Charlton, J.C., Eracleous, M., Brandt, W.N., & Churchill, C.W., 2001, ApJ, 549, 133
- Ganguly et al. (1999) Ganguly, R., Eracleous, M., Charlton, J.C., & Churchill, C.W., 1999, AJ, 117, 2594
- Garmire et al. (2003) Garmire, G.P., Bautz, M.W., Ford, P.G., Nousek, J.A., & Ricker, G.R., Jr., 2003, SPIE 4851, 28
- Georgantopoulos & Georgakakis (2005) Georgantopoulos, I. & Georgakakis, A., 2005, MNRAS, 358, 131
- George & Fabian (1991) George, I.M., & Fabian, A.C., 1991, MNRAS, 249, 352
- Giallongo et al. (1999) Giallongo, E., Fontana, A., Cristiani, S., & D’Odorico, S., 1999, ApJ, 510, 605
- Granato et al. (2004) Granato, G.L., De Zotti, G. Silva, L., Bressan, A., & Danese, L., 2004, ApJ, 600, 580
- Grant et al. (2004) Grant, C.E., Bautz, M.W., Chartas, G., & Garmire, G.P., 2004, ApJ, 610, 686
- Green & Mathur (1996) Green, P.J. & Mathur, S., 1996, ApJ, 462, 637
- Grevese & Sauval (1998) Grevesse, N. & Sauval, A.J., 1998, Space Science Reviews, 85, 161
- Hall et al. (2006) Hall, P.B., Gallagher, S.C., Richards, G.T., Alexander, D.M., Anderson, S.F., Bauer, F., Brandt, W.N., & Schneider, D.P., 2006, AJ, 132, 1977
- Hamann & Sabra (2004) Hamann, F., & Sabra, B., 2004, ASPC, 311, 203
- Hamann et al. (2002) Hamann, F., Korista, K.T., Ferland, G.J., Warner, C., & Baldwin, J., 2002, ApJ, 564, 592
- Hamann & Ferland (1999) Hamann, F., & Ferland, G.J., 1999, ARA&A, 37, 487
- Hamann (1998) Hamann, F., 1998, ApJ, 500, 798
- Hamann et al. (1997b) Hamann, F., Barlow, T.A., Junkkarinen, V., & Burbidge, E.M., 1997b, ApJ, 478, 80
- Hasinger et al. (2002) Hasinger, G., Schartel, N., & Komossa, S., 2002, ApJ, 573, L77.
- Hazard et al. (1986) Hazard, C., McMahon, R.G., Sargent, W.L.W., 1986, Nature, 322, 38
- Hopkins et al. (2004) Hopkins, P.F. et al., 2004, AJ, 128, 1112
- Hornschemeier et al. (2005) Hornschemeier, A.E., Heckman, T.M., Ptak, A.F., Tremonti, C.A., & Colbert, E.J.M., 2005, ApJ, 129, 86
- Kallman et al. (2004) Kallman T.R., Palmeri P., Bautista M.A., Mendoza C., Krolik J.H., 2004, ApJS, 155, 675
- Konigl & Kartje (1994) Königl, A. & Kartje, J.F., 1994, ApJ, 434, 446
- Kormann et al. (1994) Kormann, R., Schneider, P., Bartelmann, M., 1994, A&A, 286, 357
- Krolik & Kriss (2001) Krolik, J.H. & Kriss, G.A., 2001, ApJ, 561, 684
- Krolik & Kriss (1995) Krolik, J.H. & Kriss, G.A., 1995, ApJ, 447, 512
- Lumb et al. (2004) Lumb, D.H., Bartlett, J.G., Romer, A.K., Blanchard, A., Burke, D.J., Collins, C.A., Nichol, R.C., Giard, M., Marty, P.B., Nevalainen, J., Sadat, R., & Vauclair, S.C., 2004, A&A, 420, 853
- Magain et al. (1992) Magain, P., Surdej, J., Vanderriest, C., Pirenne, B., & Hutsemekers, D., 1992, A&A, 253, 13L
- Magdziarz & Zdziarski (1995) Magdziarz, P., & Zdziarski, A.A., 1995, MNRAS, 273, 837
- Maiolino et al. (2006) Maiolino, R. et al., 2006, Mem.S.A.It. 77, 643
- Markowitz et al. (2006) Markowitz, A., Reeves, J.N., & Braito, V., 2006, ApJ, 646, 783.
- Mathews & Ferland (1987) Mathews, W.G. & Ferland, G.J., 1987, ApJ, 323, 456
- Misawa et al. (2007b) Misawa, T., Charlton, J.C., Eracleous, M., Ganguly, R., Tytler, D., Kirkman, D., Suzuki, N., & Lubin, D., 2007b, ApJS, 171, 1
- Misawa et al. (2007a) Misawa, T., Eracleous, M., Charlton, J.C., & N. Kashikawa, 2007a, ApJ, 660, 152
- Misawa et al. (2005) Misawa, T., Eracleous, M., Charlton, J.C., & Tajitsu, A., 2005, ApJ, 629, 115
- Misawa et al. (2003) Misawa, T., Yamada, T., Takada-Hidai, M., Wang, Y., Kashikawa, N., Iye, M., & Tanaka, I., 2003, AJ, 125, 1336
- Morrison & McCammon (1983) Morrison, R. & McCammon, D., 1983, ApJ, 270, 119
- Murray & Chiang (1997) Murray, N. & Chiang, J., 1997, ApJ, 474, 91
- Murray et al. (1995) Murray, N., Chiang, J., Grossman, S.A., & Voit, G.M., 1995, ApJ, 451, 498
- Netzer & Laor (1993) Netzer, H. & Laor, A., 1993, ApJ, 404, L51
- O’Meara et al. (2001) O’Meara, J.M., Tytler, D., Kirkman, D., Suzuki, N., Prochaska, J.X., Lubin, D. & Wolfe, A.M., 2001, ApJ, 552, 718
- Page et al. (2004) Page, K.L., O’Brien, P.T., Reeves, J.N., & Turner, M.J.L., 2004, MNRAS, 347, 316
- Page et al. (2003) Page, K.L., Turner, M.J.L., Reeves, J.N., O’Brien, P.T., & Sembay, S., 2003, MNRAS, 338, 1004
- Pounds & Page (2007) Pounds, K.A. & Page, K.L., 2007, MNRAS, 372, 1275
- Predehl & Schmitt (1995) Predehl, P. & Schmitt, J. H. M. M., 1995, A&A, 293, 889
- Prévot et al. (1984) Prévot, M.L., Lequeux, J., Maurice, E., Prévot, L . & Rocca-Volmerange, B., 1984, A&A, 132, 389
- Proga, Stone, & Kallman (2000) Proga, D., Stone, J.M., & Kallman, T.R., 2000, ApJ, 543, 686
- Rao et al. (2006) Rao, S.M., Turnshek, D.A., & Nestor, D.B., 2006, ApJ, 636, 610
- Scannapieco & Oh (2004) Scannapieco, E. & Oh, S.P., 2004, ApJ, 608, 62
- Seaton (1979) Seaton, M.J., 1979, MNRAS, 187, 73
- Shields (1977) Shields, G.A., 1977, ApL, 18, 119
- Springel, Di Matteo, & Hernquist (2005) Springel, V., Di Matteo, T., & Hernquist, L., 2005, ApJ, 620, L79
- Steffen et al. (2006) Steffen, A.T., Strateva, I., Brandt, W.N., Alexander, D.M., Koekemoer, A.M., Lehmer, B.D., Schneider, D.P., & Vignali, C., 2006, AJ, 131, 2826
- Strateva et al. (2005) Strateva, I.V., Brandt, W.N., Schneider, D.P., Vanden Berk, D.G., & Vignali, C., 2005, AJ, 130, 387
- Struder et al. (2001) Strüder, L. et al., 2001, A&A, 365, L18
- Tananbaum et al. (1979) Tananbaum, H., Avni, Y., Branduardi, G., Elvis, M., Fabbiano, G., Feigelson, E., Giacconi, R., Henry, J.P., Pye, J.P., Soltan, A., & Zamorani, G., 1979, ApJ, 234, L9
- Turner et al. (2001) Turner, M.J.L., et al., 2001, A&A, 365, L27
- Vanden Berk et al. (2001) Vanden Berk, D.E., et al., 2001, AJ, 122, 549
- Vignali et al. (2001) Vignali, C., Comastri, A., Cappi, M., Palumbo, G.G.C., & Matsuoka, M., 2001, in AIP Conf. Proc. 599, X-ray Astronomy: Stellar Endpoints, AGN, and the X-ray Background, ed. N. White, G. Malaguti, & G. Palumbo (New York: AIP), 999
- Wilkes et al. (1994) Wilkes, B.J., Tananbaum, H., Worral, D.M., Avni, Y., Oey, M.S., & Flanagan, J., 1994, ApJS, 92, 53
- Zdziarski et al. (1995) Zdziarski, A.A., Johnson, W.N., Done, C., Smith, D., & McNaron-Brown, K., 1995, ApJ, 438, L63