Long-Term X-Ray monitoring of NGC 6251:
Evidence for a jet-dominated radio galaxy
Abstract
We present the first X-ray monitoring observations of the X-ray bright FR I radio galaxy NGC 6251 observed with RXTE for 1 year. The primary goal of this study is to shed light on the origin of the X-rays, by investigating the spectral variability with model-independent methods coupled with time-resolved and flux-selected spectroscopy. The main results can be summarized as follows: 1) Throughout the monitoring campaign, NGC 6251 was in relatively high-flux state with an average 2–10 keV absorbed flux of the order of 4.5 and a corresponding intrinsic luminosity of 6. 2) The flux persistently changed with fluctuations of the order of 2 on time scales of 20-30 days. 3) When the hardness ratio is plotted against the average count rate, there is evidence for a spectral hardening as the source brightens; this finding is confirmed by a flux-selected spectral analysis. 4) The fractional variability appears to be more pronounced in the hard energy band (5–12 keV) than in the soft one (2.5–5 keV). 5) 2-month averaged and flux-limited energy spectra are adequately fitted by a power law. A Fe K line is never statistically required, although the presence of a strong iron line cannot be ruled out, due to the high upper limits on the line equivalent width. The inconsistency of the spectral variability behavior of NGC 6251 with the typical trend observed in Seyfert galaxies and the similarity with blazars lead support to a jet-dominated scenario during the RXTE monitoring campaign. However, a possible contribution from a disk-corona system cannot be ruled out.
1 Introduction
Non-blazar radio-loud active galactic nuclei (AGNs) –objects with jets forming large viewing angles to the line of sight– are traditionally divided into two classes: Fanaroff-Riley II (FR II), with 178 MHz powers W/Hz and edge-darkened radio morphologies, and FR I galaxies with lower powers and more compact morphologies (Fanaroff & Riley 1974). For the same host galaxy optical magnitude, FRIs produce about one order of magnitude less optical line emission than FRIIs (Baum et al. 1995) and have fainter or negligible UV continuum fluxes (Zirbel & Baum 1995, Ho 1999).
While earlier models for the origin of the FRI/II dichotomy focused mainly on accounting for their large-scale radio morphologies, more recently new ideas have emerged concerning the nature of the central engine in the two types of radio galaxies in an attempt to explain the nuclear properties. One school of thought is that the nuclear X-ray properties of FR I and FR II are related to a different accretion rate onto the central supermassive black hole, with FRII being dominated by relatively large values of , while FRI would be accreting at sub-Eddington rates, (e.g., Reynolds et al. 1996; Ghisellini & Celotti 2001).
A fundamental step to gain insight into the nature of the central engine in radio-loud AGNs is to understand whether the X-ray radiation is produced by disk/corona systems as in Seyfert galaxies or by jets as in blazars. While the time-averaged spectroscopy (due to spectral degeneracy) and the pure temporal analysis (due to the fact that both radio-quiet and radio-loud show strong variability) cannot firmly discriminate between the two competing scenarios, their combination, i.e., time-resolved spectral analysis and energy-selected temporal analysis, offers in principle a better way to distinguish between accretion-dominated and jet-dominated systems. This conclusion is supported by the strikingly different spectral variability behavior shown by Seyfert-like objects (e.g., Papadakis et al. 2002; Markowitz & Edelson 2001) and by blazars (e.g., Zhang et al. 1999; Fossati et al. 2000; Gliozzi et al. 2006).
Here, we concentrate on the X-ray nuclear properties of the nearby radio galaxy NGC 6251 (=0.024), which is a giant elliptical galaxy hosting a supermassive black hole with mass (Ferrarese & Ford 1999). Based on its radio power at 178 MHz, NGC 6251 is classified as an FR I (e.g., Owen & Laing 1989), whereas in the optical, it is classified as a type-2 AGNs (e.g., Shuder & Osterbrock 1981).
Despite the intensive study of this source at all wavelengths, the nature of the accretion process in NGC 6251 is still a matter of debate. Based on the radio-to-X-ray spectral energy distribution, Ho (1999) suggested that an Advection-Dominated Accretion Flow (ADAF) is present in the nucleus of NGC 6251. On the other hand, Ferrarese & Ford (1999) and Melia et al. (2002) favored a standard accretion disk. Finally, Mukherjee et al. (2002) and Chiaberge et al. (2003) advocate a jet origin for the broad-band emission, based on the possible association of NGC 6251 with the EGRET source 3EG J1621+8203 and on its spectral energy distribution, respectively.
In the X-ray band, NGC 6251 has been previously observed with various satellites. For example, ROSAT showed the presence of an unresolved nuclear source embedded in a diffuse thermal emission with temperature keV, associated to the galaxy’s halo (Birkinshaw & Worrall 1993). In addition, the existence of a correlation between soft X-rays and radio fluxes prompted Hardcastle & Worrall (2000) to hypothesize a jet origin for the soft X-rays. On the other hand, the prominent Fe K line (EW 400–500 eV) detected by ASCA in 1994 (Turner et al. 1997; Sambruna et al. 1999) suggested a standard Seyfert-like scenario with accretion-dominated X-rays. BeppoSAX observed NGC 6251 in July 2001 during a high-flux state (the 2–10 keV flux, erg cm-2 s-1, was 3 times larger than the value measured by ASCA 7 years earlier). Based on the absence of a prominent Fe K line (EW 100 eV) or other reprocessing features, Guainazzi et al. (2003) proposed a scenario with two main spectral components: a blazar-like spectrum dominating the high-flux state and a Seyfert-like spectrum emerging during the low-flux state. More recently, in March 2002, NGC 6251 was observed with XMM-Newton when the 2–10 keV flux was 15% lower than the BeppoSAX value. Despite the relatively high flux, the XMM-Newton spectral results seem to support the picture emerged from the ASCA observation with the presence of a prominent (EW220 eV) and possibly broad ( keV) Fe K line (Gliozzi et al. 2004). However, the existence of a broad Fe K line in the XMM-Newton spectrum is still a matter of debate (see Evans et al. 2005 and González-Martín et al. 2006 for a discording and a supporting view, respectively).
The controversial results derived from previous X-ray studies highlight the impossibility of firmly determining the origin of the X-rays in NGC 6251 based solely on time-averaged spectral results. Here, we present the results from a systematic study of the long-term X-ray flux and spectral variability of NGC 6251 using one year long proprietary Rossi X-ray Timing Explorer (RXTE) observations in the 2-12 keV range. We use model-independent methods and time-resolved spectroscopy to study the X-ray temporal and spectral properties of this source. The main purpose of this analysis is to shed light on the origin of the X-rays and in particular on the role played by a jet in the X-rays. Once (if) the jet contribution is properly assessed, the physical parameters characterizing the accretion process onto the supermassive black hole can be better constrained, and hence it is possible to discriminate between competing theoretical models for the accretion process.
The outline of the paper is as follows. In we describe the observations and data reduction. The main characteristics of the X-ray light curve are described in . In we study the X-ray spectral variability of NGC 6251 with two model-independent methods. In we describe the results of a time-resolved and flux-selected spectral analyses. In we discuss the results and their implications. In we summarize the main results and conclusions.
2 Observations and Data Reduction
We use proprietary RXTE data of NGC 6251 that was regularly observed for 1000 s once every 4 days between 2005 March 4 and 2006 February 27. The observations were carried out with the Proportional Counter Array (PCA; Jahoda et al. 1996), and the High-Energy X-Ray Timing Experiment (HEXTE; Rotschild et al. 1998) on RXTE. Here we will consider only PCA data, because the signal-to-noise of the HEXTE data is too low for a meaningful analysis.
The PCA data were screened according to the following acceptance criteria: the satellite was out of the South Atlantic Anomaly (SAA) for at least 30 minutes, the Earth elevation angle was , the offset from the nominal optical position was , and the parameter ELECTRON-2 was . The last criterion removes data with high particle background rates in the Proportional Counter Units (PCUs). The PCA background spectra and light curves were determined using the model developed at the RXTE Guest Observer Facility (GOF) and implemented by the program pcabackest v.3.0. This model is appropriate for “faint” sources, i.e., those producing count rates less than 40 .
All the above tasks were carried out using the FTOOLS v.6.2 software
package and with the help of the REX script provided by the RXTE GOF. Data were initially extracted with 16 s time resolution and subsequently
re-binned at different bin widths depending on the application. The current
temporal analysis is restricted to PCA, STANDARD-2 mode, 2–12.5 keV, Layer 1
data, because that is where the PCA is best calibrated and most sensitive. PCUs
0 and 2 were turned on throughout the monitoring campaign. However, since the
propane layer on PCU0 was damaged in May 2000, causing a systematic increase
of the background, we conservatively use only PCU2 for our analysis (see
below). All quoted count rates are therefore for one PCU.
The spectral analysis of PCA data was performed using the XSPEC v.12.3.1 software package (Arnaud 1996). We used PCA response matrices and effective area curves created specifically for the individual observations by the program pcarsp, taking into account the evolution of the detector properties. All the spectra were re-binned so that each bin contained enough counts for the statistic to be valid. Fits were performed in the energy range 2.5–12.5 keV, where the signal-to-noise ratio is the highest.
3 The X-ray Light Curves
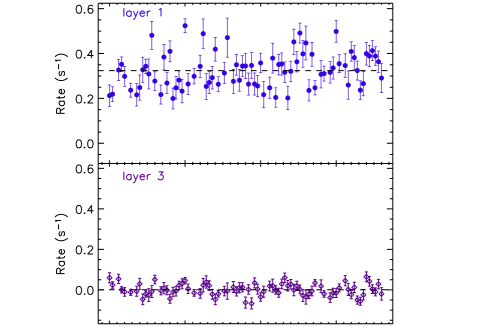
Although NGC 6251 is generally considered an X-ray bright source – its average flux is of the order of erg cm-2 s-1 with a corresponding luminosity L erg s-1 that is nearly a factor 4 larger than the typical values observed in low-power radio galaxies (Donato et al. 2004) – it is rather weak for the RXTE capabilities. Therefore, before starting a detailed analysis of temporal properties, it is necessary to demonstrate that the variability observed cannot be ascribed to uncertainties in the RXTE background or to other artifacts. To this end, we have performed the following test: We have compared the background-subtracted light curves obtained using PCU2 layer 1 and PCU2 layer 3. Since the genuine signal in layer 3 is quite small, its light curve can be used as a proxy to check how well the background model works. If the latter light curve is significantly variable with a pattern similar to the one produced using layer 1, then the variability is simply due to un-modeled variations of the background. Conversely, if the PCU2 layer 3 light curve does not show any pronounced variability or if the flux changes are uncorrelated with those observed in the layer 1 light curve, we can safely conclude that the variability detected in NGC 6251 is real.
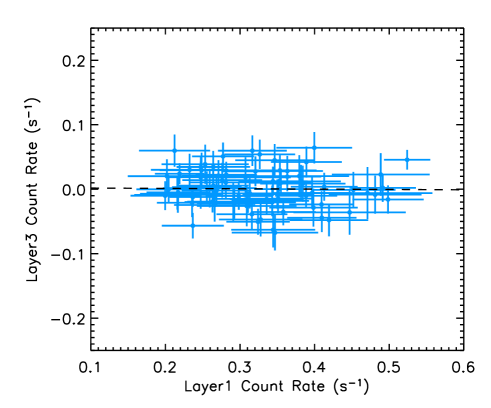
The two light curves in the 2–10 keV range (where the background PCA model is better parameterized; see Jahoda et al. 2006 for more details) are shown in Figure 1. A visual inspection of this figure suggests that the variability in the layer 1 light curve is much more pronounced than the one observed in layer 3. Indeed, the mean count rate of layer 3 is consistent with zero, indicating that on long timescales the background model works adequately. However, statistically speaking both light curves are considered variable: 229.5 (layer 1) and 128.3 (layer 3) for 78 degrees of freedom (hereafter dof). On the other hand, a formal analysis based on the excess variance (i.e. the variance corrected for statistical errors), indicates that variability associated with the layer 1 light curve is more than one order of magnitude larger than that associated with layer 3 ( and , respectively). Further support to the fact that the variability associated with layer 1 is genuine comes from a correlation analysis: When layer 3 is plotted versus the layer 1 count rate (see Figure 2), no correlation is observed, as confirmed by a least square linear fit analysis, . We therefore conclude that most of the count rate changes observed in layer 1 are associated with genuine intrinsic variations of the X-ray source in NGC 6251.
3.1 PCU0 versus PCU2
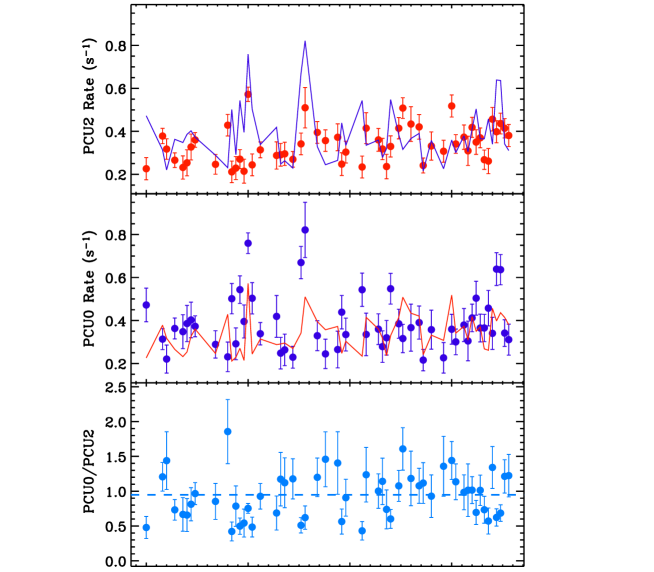
In order to maximize the signal-to-noise (S/N) ratio of the light curves, one can combine the 2 PCUs at work during the monitoring campaign (i.e., PCU0 and PCU2), provided that they are consistent with each other. In particular, it is necessary to test whether PCU0, partially damaged since May 2000, is compatible with PCU2. Figure 3 shows the background-subtracted, 2–12 keV light curves of PCU2 (top panel), PCU0 (middle panel), each with superimposed the light curve of the other PCU (represented by continuous lines in top and middle panels), and their ratio (bottom panel) with a time bin of 4 days. A visual inspection of this figure suggests that the PCU0 and PCU2 light curves are not fully consistent with each other. Indeed, a formal check based on a test indicates that the ratio PCU0/PCU2 is not consistent with the hypothesis of constancy ( for 54 dof). Since the propane layer on PCU0 was damaged a few years ago, we decided to work with the PCU2 data only. For completeness, we have also performed the same data analysis on the PCU0 data, and the results are in general agreement with those from the PCU2.
Whereas for the temporal analysis the PCU0 data need to be necessarily excluded because they appear to be inconsistent with the PCU2 data, PCU0 spectral data should not be a priori ruled out for an analysis averaged over two-month periods. Unfortunately, also the 2-month averaged PCU0 spectra appear to be at odds with the PCU2 spectral results, with unphysically large changes for the photon index (with a seesaw trend between and ) and very large uncertainties. Therefore, also for the spectral analysis (see ) we use only PCU2 data.
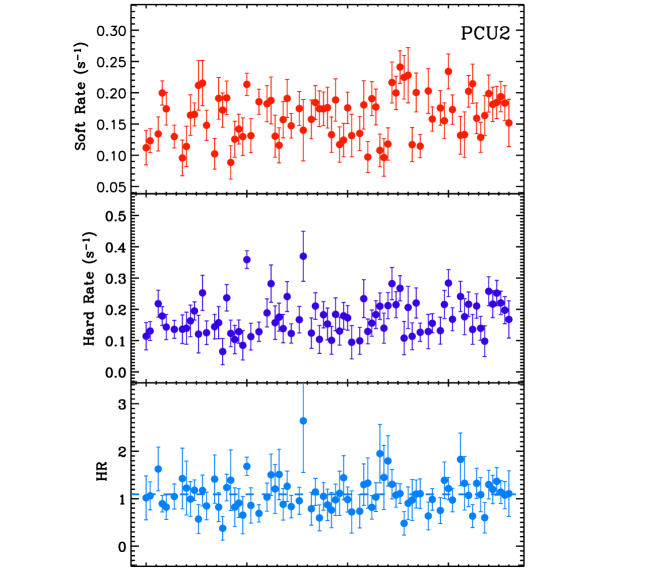
Using data from PCU2 only, we constructed background subtracted light curves in two energy bands, namely the “soft” (2.5–5 keV) and the “hard” (5–12 keV) band. We show them in Figure 4, together with the hardness ratio (hard/soft) plotted versus time. Time bins are 4 days. The soft and hard band light curves are significantly variable ( and , respectively) and appear to be qualitatively similar. This is formally confirmed by the hardness ratio light curve, which appears to be constant ().
We conclude that the flux variations observed in NGC 6251 on timescales of weeks-months are not associated with spectral variations.
4 Spectral variability: model-independent analysis
For this study we use simple methods such as hardness ratio versus count rate plots and the fractional variability versus energy plots. These can provide useful information without any a priori assumption regarding the shape of the X-ray continuum spectrum. Thus, the results from the study of these plots can be considered as “model-independent”.
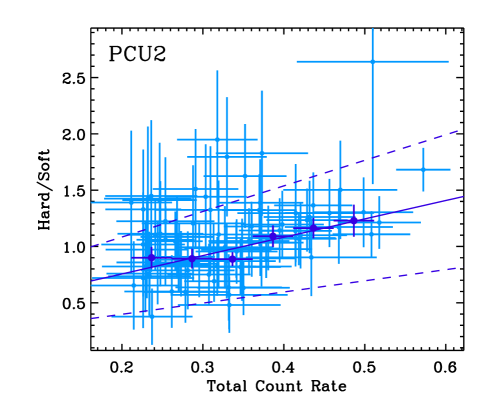
Figure 5 shows the Hard/Soft X-ray color
(5–12 keV)/(2.5–5 keV) plotted versus the
total count rate (2.5–12 keV) for un-binned (smaller, gray symbols) and
binned data (larger, darker symbols), respectively.
A visual inspection of this figure suggests the presence of a positive
trend between and the count rate (i.e., the spectrum hardens
as the flux increases), although within a large scatter.
This positive trend is apparently confirmed by the linear fit of the data,
with , which suggests
the presence of a positive correlation at 4.6 confidence level. This
analysis was performed
using the routine fitexy (Press et al. 1997) that accounts
for the errors not only on the y-axis but along the x-axis as well.
Better insight into the presence of correlations between and total count rate can be obtained by investigating the binned data. To this end, we have binned the data, shown in Fig. 5, using count rate bins of fixed size (0.05 counts/s), and computed the weighted mean (along both the y and x-axis) of all the points which fall into a bin. The error on the weighted mean is computed following Bevington’s prescriptions (Bevington 1969). Only bins with at least 5 data points have been plotted in Figure 5 and considered for the linear fit. In this case, the best linear fit, with , (shown in Fig. 5 with its 1 uncertainties), indicates that, if a few outliers with large count rate (and error-bar) are neglected, the significance of a positive correlation reduces to 2.67. This is slightly lower than the 3 level, which is generally accepted for significant variations, but it still implies a positive correlation at a confidence level of 99%.
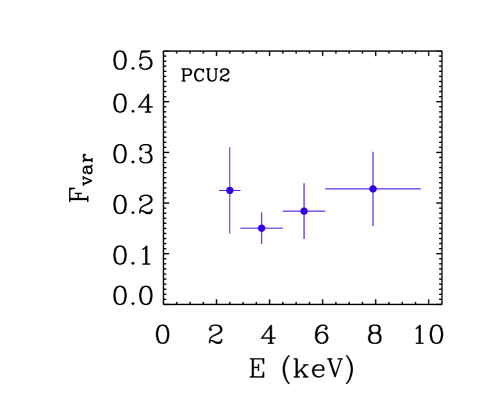
Another simple way to quantify the variability properties of NGC 6251 without considering the time ordering of the values in the light curves, is based on the fractional variability parameter . This is a commonly used measure of the intrinsic variability amplitude relative to the mean count rate, corrected for the effect of random errors, i.e.,
| (1) |
where is the variance, the unweighted mean count rate, and the mean square value of the uncertainties associated with each individual count rate. The error on has been estimated following Vaughan et al. (2003). We computed on selected energy bands, with mean count rates similar and sufficiently high.
The results are plotted in Figure 6 and suggest that, over the 3–8 keV energy range, a weak positive trend seems to be present. However, the large uncertainties on due to the low count rate in the narrow energy-selected bands hamper this kind of analysis. Indeed, statistically speaking, the trend shown in Figure 6 is consistent with the hypothesis of being constant in the energy range probed by RXTE. If only two broader energy bands are used for this analysis, the resulting fractional variability in the hard energy band 5–12 keV, appears to be larger than the value, , obtained in the soft band 2.5–5 keV. However, the difference is significant at the 1.7 level only.
In summary, the results from the study of the plots show evidence for a positive correlation between hardness ratio and total count rate. Similarly, an analysis of the fractional variability suggests that is more pronounced in the hard energy band than in the soft one. However, due to the rather limited signal-to-noise ratio of our data these results are significant at just the and level, respectively.
5 Spectral Analysis
5.1 Time-resolved Spectroscopy
Given that the data consist of short snapshots spanning a long temporal baseline, they are in principle well suited for monitoring the spectral variability of NGC 6251. However, due to the limited S/N of the data, the spectral slope , measured from spectra of individual observations, cannot be adequately constrained and hence the spectral variability cannot be investigated in such a way. Indeed, if we plot the values of versus time, no variations are detected due to the large errors on . This is fully consistent with the results from the -time plot described in . In order to increase the S/N and investigate the presence of possible spectral variations, we use spectra averaged over two-month intervals. This choice is a trade-off between the necessity of accumulate sufficient counts for a reliable spectral analysis and the need to use limited temporal intervals to minimize the effects of the slow drift in the detector gain.
We fitted each two-month spectrum with a simple power-law (PL) model absorbed by Galactic (). The model fits all the data reasonably well, as indicated by Fig. 7 that shows a typical spectrum fitted with a simple power law. The best-fit results are listed in Table 1 and can be summarized as follows. A simple PL model provides an acceptable parametrization for all spectra. The photon indices are all rather steep () and consistent with each other within the errors. In other words, our results suggest that the source’s spectrum does not vary significantly on timescales longer than two months. The weighted spectral slope mean is . Adding a Gaussian line at 6.4 keV to the PL continuum model does not improve the fit significantly in any of the six spectra, but the 90% confidence upper limits on the equivalent width are relatively high (EW200-700 eV).
In order to better constrain and the line EW, we have tried a comparison between the first and the last 6 months of monitoring campaign, by fitting together 3 two-month spectra at a time. The results – erg cm-2 s-1, , eV during the first half, and erg cm-2 s-1, , eV during the second half – are fully consistent with each other.
Since there are no indications for long-term spectral variability, we have fitted the 6 two-month spectra together. This yielded and a significantly smaller upper limit on the line strength: EW104 eV. In the 2–10 keV energy band, we obtained an average absorbed flux of 4.4 erg cm-2 s-1, and a corresponding intrinsic luminosity of erg s-1, assuming , and (Bennet et al. 2003).
5.2 Flux-selected Spectroscopy
In order to verify the presence of a direct correlation between and count rate derived in , we performed a flux-selected spectral analysis. To this end we divided the 94 individual spectra into 5 bins according to their average count rate (namely, c/s). In each bin, the individual spectra were fitted simultaneously with a PL model (absorbed by Galactic ) with their photon indices linked together and their respective normalizations free to vary.
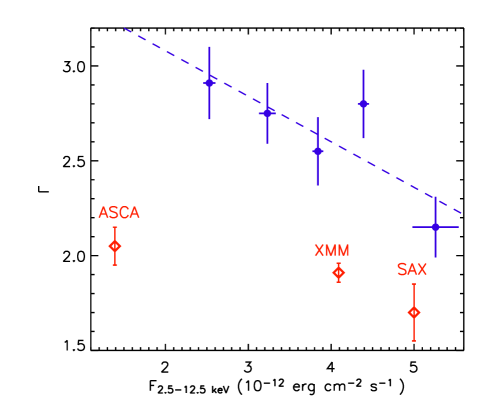
The results are summarized in Table 2, where the reported errors on and flux are respectively 1 and , with being the number of individual spectra per bin. The upper limits on EW correspond to the 90% confidence level. Table 2 indicates that the 2.5–12.5 keV spectra harden as the average flux increases. This is clearly shown in Figure 8, where the values of for each count rate bin have been plotted against their respective flux values. The dashed line represents the best linear fit, , which reveals that the inverse correlation is significant at 3- level.
For comparison, in Fig. 8 we have also plotted the values corresponding to the ASCA, BeppoSAX, and XMM-Newton observations. To this end, we have used PIMMS to convert the observed flux into the RXTE energy range, assuming the best-fit spectral parameters reported in Guainazzi et al. (2003) for BeppoSAX and ASCA, and Gliozzi et al. (2004) for XMM-Newton. The ASCA, BeppoSAX, and XMM-Newton photon indices seem to follow the same inverse trend shown by RXTE, becoming flatter as the flux increases. However, their values appear to be significantly smaller than those obtained from the flux-selected RXTE spectral analysis. This apparent discrepancy may be probably reconciled (at least for the BeppoSAX and XMM-Newton data) by bearing in mind that: 1) Past studies have shown that photon indices measured with the RXTE PCA are systematically steeper than those measured by other X-ray satellites (e.g., Yaqoob 2003). 2) The error-bars for the RXTE data in Fig. 8 are at 1 level. On the other hand, it appears more difficult to reconcile the ASCA value with the extrapolation of the RXTE best-fit trend, suggesting that the source was in a different physical state (for example, it lacked a jet contribution).
We have also added a Gaussian line to the PL continuum (see Table 2 last column). Only for the bin with the lowest flux, the line is very marginally significant (the value of decreases by 1.2 for one additional dof) with EW400 eV and large uncertainties. For bins with larger flux values, only upper limits on EW can be derived. These findings indicate that a Fe K line is never statistically required, although its presence cannot be completely ruled out when the source flux is at the lowest level measured by RXTE.
6 Discussion
We have undertaken the first X-ray monitoring study of the FR I galaxy NGC 6251, investigating the temporal and spectral variability as well as time-averaged and flux-selected spectral results.
By comparing the X-ray fluxes measured by different satellites over nearly a decade of observations, it is clear that NGC 6251 shows large flux changes on long timescales. For example, in October 1994 ASCA measured a flux of erg cm-2 s-1 in the 2–10 keV energy band, whereas BeppoSAX observed a flux of erg cm-2 s-1 in July 2001, and XMM-Newton of erg cm-2 s-1 in March 2002. The high throughput of the EPIC pn camera aboard XMM-Newton also revealed the presence of low-amplitude flux changes (of the order of 5%) on timescales of a few ks.
The variability behavior detected in the current RXTE observations is in agreement with the sparse evidence that had been gathered in the previous years, and show conclusively that NGC 6251 is a persistently variable source in X-rays. The frequent RXTE observations, spread over a period of one year, indicate that this radio galaxy is characterized by persistent variability in the total (2.5–12 keV), soft (2.5–5 keV), and hard (5–12 keV) energy bands. Throughout the observation, the flux appears to randomly change by a factor of 2 on timescales of a few weeks.
Previous X-ray studies, mostly based on the time-averaged spectral analysis, have revealed a dual behavior for NGC 6251: sometimes the source appears to behave like a Seyfert galaxy with a strong Fe K line (e.g., Turner et al. 1997; Sambruna et al. 1999; Gliozzi et al. 2004), whereas in other occasions NGC 6251 seems to be more consistent with a blazar-like behavior, showing a featureless X-ray spectrum (e.g., Guainazzi et al. 2003). The densely sampled, year-long RXTE observations and the investigation of the flux and spectral variability properties offer an alternative and model-independent way to shed some light on this issue.
6.1 Evidence from the flux variability properties
Unlike the brightest blazars frequently monitored by RXTE (e.g., Kataoka et al. 2001, Cui 2004, Xue & Cui 2005), NGC 6251 does not show any prominent flare on any observable timescale, nor does it show the large amplitude variability typically observed in several Seyfert-like objects during yearly-long monitoring campaigns (e.g., Markowitz & Edelson 2001).
On one hand, the apparent inconsistency with the large variability observed in Seyfert galaxies can be explained by the lower values of black hole mass in the latter objects, which is typically one order of magnitude lower than NGC 6251. On the other hand, the lack of prominent flares in the NGC6251 light curve, which instead characterize the blazar light curves, can be understood by keeping in mind that the blazars monitored by RXTE are the brightest members of this AGN class and that the observations are often triggered only during their flaring activity. Nonetheless, blazar monitoring campaigns with baselines covering several years reveal that also the brightest blazars alternate prominent flaring activity with “quiescent periods” that are characterized by moderate flux variations. Indeed, prolonged periods of moderate variability have been detected in several blazars (e.g., Böttcher et al. 2005; Marscher 2006).
A model-independent study of the RXTE variability properties of the prototypical blazar Mrk 501, similar to the one performed on NGC 6251 in this work, offers the best opportunity for a more quantitative comparison of NGC 6251 with a typical blazar behavior (Gliozzi et al. 2006). For instance, Mrk 501, which showed a large outburst in 1997, underwent a progressive decrease of its activity in the following years, resulting in a lower mean count rate accompanied by lower variability. Specifically, in 1999, when Mrk 501 reached a minimal flux value, the light curve was characterized by variations of the order of 2 on timescales of 20–30 days, which are fully consistent with those detected in NGC 6251.
Before proceeding further, it must be pointed out that the blazars regularly monitored over the past years with RXTE (including Mrk 501) are basically all High-peaked blazars (HBLs), with the synchrotron component peaking in the X-ray range and a second spectral component, generally attributed to inverse Compton scattering, peaking at TeV energies. On the other hand, in the blazar framework, the broadband SED of NGC 6251 is consistent Low-peaked blazars (LBLs), with the inverse Compton component peaking in the X-rays (Chiaberge et al. 2003; Guainazzi et al. 2003). As a consequence, a formal comparison of the X-ray properties of NGC 6251 should be in principle performed using the TeV properties of Mrk 501. However, detailed studies of X-ray and TeV emissions in HBLs have demonstrated the existence of a tight correlation between these energy bands, indicating that the X-ray and TeV radiation follow the same variability trend (e.g., Fossati et al. 2004; Gliozzi et al. 2006). Further support to this conclusion comes from recent investigations of the TeV properties of Mrk 501 and Mrk 421 carried out with the MAGIC and Whipple telescopes (Blazejowki et al. 2006; Albert et al. 2007). These studies demonstrate that also in the -ray energy band HBLs show the typical blazar spectral variability behavior observed in X-rays, that is a spectral hardening when the source brightens and a fractional variability more pronounced at higher energies (e.g., Zhang et al. 1999; Fossati et al. 2000; Gliozzi et al. 2006; Rebillot et al. 2006 and references therein). We therefore conclude that it is appropriate to compare the X-ray properties of Mrk 501 with those of NGC 6251.
Another relevant finding from the flux variability analysis of NGC 6251 is that the fractional variability appears to be more pronounced in the hard than in the soft energy band: . This result can be quantitatively compared with similar studies carried out on Seyfert galaxies monitored with RXTE for several months or years (Markowitz & Edelson 2004). Specifically, all the Seyfert galaxies with long RXTE monitoring yield negative values of ranging between -3.5 and -24.8, with a mean value of . On the other hand, a similar study, carried out using RXTE monitoring data of the blazar Mrk 501 between 1997 and 2000, yielded positive values of ranging between 5 and 42, with a mean value of .
We can therefore conclude that the limited amplitude of the NGC 6251 flux variability can be explained equally well in both Seyfert-like and blazar-like scenarios. However, the fractional variability behavior is inconsistent with the trend generally observed in Seyfert galaxies, but fully consistent with the typical blazar behavior observed in Mrk 501.
6.2 Evidence from the spectral properties
A comparative analysis of the spectral variability of NGC 6251 and the typical behaviors observed in both radio-quiet AGNs (where the X-rays are thought to be produced by Comptonization in the corona that is closely connected with the accretion disk) and radio-loud jet-dominated AGNs (whose radiation over the entire energy range is ascribed to jet emission) can help us understand whether the X-ray radiation from NGC 6251 is dominated by jet or accretion-related emission.
A flux-selected spectral analysis (in agreement with the plot) has shown that the X-ray spectrum of NGC 6251 hardens as the source brightens, following the linear correlation . A direct comparison of this result with a similar spectral study, carried out on 4 Seyfert galaxies monitored with RXTE, indicate that the latter have always positive slopes in the plane ranging between 0.05 and 0.15 with a mean value of (Papadakis et al. 2002). As a consequence, the spectral variability behavior of NGC 6251 appears to be inconsistent with the typical Seyfert-like trend. On the other hand, the slope measured for Mrk 501 during the weakly variable period of 2000, , appears to be fully consistent with the behavior of NGC 6251 during the RXTE monitoring campaign.
The existence of a Seyfert-like component suggested by previous X-ray studies was essentially based on the presence of a strong Fe K line. Unfortunately, the low S/N spectra obtained during the RXTE monitoring coupled with the poor spectral resolution of the RXTE PCA hampers a detailed investigation of this issue. Indeed, if the 2-month averaged PCA spectra are fitted with a model including a power law and a Gaussian line with spectral parameters fixed at the best-fit values obtained during the ASCA observation (we conservatively assumed the best-fit parameters reported in Guainazzi et al. 2003), the results are statistically indistinguishable from the fits obtained using a simple power law. This indicates that RXTE is unable to confirm or refute the presence of a Fe K line, and suggests that only a relatively long exposure of XMM-Newton with its superior capabilities is able to detect the presence of the line when the average flux of NGC 6251 is relatively high.
6.3 The origin of X-rays in NGC 6251
The primary goal of this work is to investigate the origin of the X-rays in NGC 6251 and in particular to assess the role played by the putative jet. At first sight, the possibility that the jet may dominate the radiative output of a radio galaxy may be surprising, and even more so for NGC6251, which has a Mpc radio jet (and hence appears forming a large viewing angle) and Seyfert-like emission during the low flux state. However, under specific circumstances, the jet-dominance hypothesis becomes plausible. This is the case when the base of the jet is not well collimated and the X-rays are produced by a part of the outflowing material that points towards the observer. Indeed, this is the framework proposed to explain the TeV emission detected in another radio galaxy M87 (Aharonian et al. 2006). Alternatively, if the base of the jet is tilted with respect to the large scale jet and forms a small viewing angle, the possible dominance of the jet in the 2–12 keV range can be naturally explained. In fact, this is the scenario put forward by Jones & Wehrle (2002) to explain the large jet/counterjet brightness ratio on parsec scales inferred for NGC 6251 from VLBA observations.
By comparing the spectral variability properties of NGC 6251 with those of radio-quiet AGNs and blazar objects, we find that they are certainly inconsistent with a typical Seyfert-like behavior but fully consistent with blazars. Combining pieces of information from the model-independent analysis with the findings from the flux-selected spectral analysis, we are led to the conclusion that, during the RXTE monitoring campaign, the bulk of the hard X-ray radiation from NGC 6251 was dominated by the emission from the unresolved base of the jet. Nonetheless, the presence of a disk-corona component, detected in previous observations with ASCA and XMM-Newton, cannot be ruled out: the upper limits measured on the equivalent width of the Fe K line are indeed fully consistent with the values measured by ASCA and XMM-Newton, but the low S/N of the spectra hampers a more quantitative analysis.
In conclusion, we can try to exploit the main results from this work (i.e., the jet dominance in the high flux state, with a possible contribution from a Seyfert-like component emerging at low flux values) to derive some constraints on the accretion process at work in NGC 6251. Assuming that an accretion-related component is always present in NGC 6251 and dominates during the low flux state, we can use the average flux measured in the low count rate bin (see Table 2) to compare the corresponding 2–10 keV luminosity – erg s-1– to the Eddington value readily derived from the black hole mass estimate. The relatively high value derived, , confirms that NGC 6251 is a bright FR I galaxy that is close to the FR I/FR II dividing line in terms of power of the central engine. However, it is not possible to derive any firm conclusion on the nature of the accretion process given the unknown contribution of the jet in the low-flux state.
7 Summary and Conclusions
We have used data from a year-long RXTE monitoring campaign to study the spectral variability of NGC 6251 following model-independent and spectral model fitting methods. The main results can be summarized as follows:
-
•
Throughout the monitoring campaign and especially during the last 4 months, NGC 6251 was in a relatively high-flux state, with values of the 2–10 keV absorbed flux comparable to that observed by BeppoSAX in 2001.
-
•
The light curves show persistent variations by a factor of 2 on timescales weeks/months in the total (2.5–12 keV), soft (2.5–5 keV), and hard (5–12 keV) energy bands.
-
•
The fractional variability, computed over the soft and hard energy bands, reveals an enhanced variability at harder energies (20%) compared to the soft band (10%).
-
•
There is evidence of a positive trend in the plot (or, analogously, of a negative trend in the -flux plot); in other words the spectrum hardens as the flux increases.
-
•
The 2-month averaged spectra are well fitted by a power-law model, with and no indication for an Fe K line. Combining all the 2-month averaged spectra yielded EW 104 eV. Only for the lowest flux-selected spectrum, there is marginal evidence for a Fe K line. However, the low S/N does not allows one to put reliable constraints on the putative Seyfert-like component.
The inconsistency of the spectral variability behavior of NGC 6251 with the typical trend observed in Seyfert galaxies and the similarity with blazars lead support to a jet-dominated scenario. However, based on the RXTE observations, a substantial contribution from a disk-corona system cannot be ruled out.
References
- Aharonian et al. (2006) Aharonian, F., et al. 2006, Science, 314, 1424
- Albert et al. (2007) Albert, J., et al. 2007, ApJ, 669, 862
- Arnaud (1996) Arnaud, K. 1996, in ASP Conf. Ser. 101, Astronomical Data Analysis Software and Systems V, ed. G. Jacoby & J. Barnes (San Francisco: ASP), 17
- Baum et al. (1995) Baum,S.A., Zirbel, E.L., & O’Dea, C.P. 1995, ApJ, 451, 88
- Bennet et al. (2003) Bennet, C.L. et al. 2003, ApJS, 148, 1
- Bevington (1969) Bevington, P.R. 1969. Data Reduction and Error Analysis for the Physical Sciences. McGraw-Hill, New York
- Birkinshaw & Worrall (1993) Birkinshaw, M., & Worrall, D.M. 1993, ApJ, 412, 568
- Blazejowski et al. (2005) Blazejowski, M., et al. 2005, ApJ, 630, 130
- Böttcher et al. (2005) Böttcher, M., Harvey, J., Joshi, M. et al. 2005, ApJ, 631, 169
- (10) Chiaberge, M., Gilli, R., Capetti, A., & Macchetto, F.D. 2003, ApJ, 597, 166
- Cui (2004) Cui, W. 2004, ApJ, 605, 662
- Donato et al. (2004) Donato, D., Sambruna, R.M., & Gliozzi, M. 2004, ApJ, 617, 915
- Evans et al. (2005) Evans, D.A., Hardcastle, M.J., Croston, J.H., Worrall, D.M., & Birkinshaw, M. 2005, MNRAS, 359, 363
- Fanaroff & Riley (1974) Fanaroff, B.L. & Riley, J.M. 1974, MNRAS, 167, 31
- (15) Ferrarese, L., & Ford, H.C. 1999, ApJ, 515, 583
- Fossati et al. (2000) Fossati, G., et al. 2000, ApJ, 541, 153
- Fossati et al. (2004) Fossati, G., Buckley, J., Edelson, R.A., Horns, D., & Jordan, M. 2004, NAR, 48, 419
- Ghisellini & Celotti (2001) Ghisellini, G. & Celotti, A. 2001, A&A, 379, L1
- Gliozzi et al. (2003) Gliozzi M., Sambruna, R.M., & Eracleous, M. 2003, ApJ, 584, 176
- Gliozzi et al. (2004) Gliozzi M., Sambruna, R.M., Brandt, W.N., Mushotzky, R., & Eracleous, M. 2004, A&A, 413, 139
- Gliozzi et al. (2006) Gliozzi M., et al. 2006, ApJ, 646, 61
- Gliozzi et al. (2007) Gliozzi M., Sambruna, R.M., Eracleous, M., Yaqoob, T. 2007, ApJ, 664, 88
- González-Martín et al. (2006) González-Martín, O., Masegosa, J., Márquez, I., Guerrero, M.A., & Dulzin-Hacyan, D. 2006 A&A, 460, 45
- Guainazzi et al. (2003) Guainazzi, M., Grandi, P., Comastri, A., & Matt, G. 2003, A&A, 410, 131
- (25) Hardcastle, M.J., & Worrall, D.M. 2000, MNRAS, 314, 359
- Ho (1999) Ho, L. 1999, ApJ 516, 672
- Jahoda et al. (1996) Jahoda, K., Swank, J., Giles, A.B., et al. 1996, Proc.SPIE, 2808, 59
- Jones & Wehrle (2002) Jones, D.L. & Wehrle, A.E. 2002, ApJ, 580, 114
- Kataoka et al. (2001) Kataoka, J., et al. 2001, ApJ, 560, 659
- Markowitz & Edelson (2001) Markowitz, A. & Edelson, R. 2001, ApJ, 547, 684
- Markowitz & Edelson (2004) Markowitz, A. & Edelson, R. 2004, ApJ, 617, 939
- Marscher (2006) Marscher, A.P. 2006, ChJAS, 6, 262
- (33) Melia, F., Liu, S., & Fatuzzo, M. 2002, ApJ 567, 811
- Mukherjee et al. (2002) Mukherjee, R., Halpern, J., Mirabal, N. , & Gotthelf, E.V. 2002, ApJ, 574, 693
- (35) Owen, F.N., & Laing R.A. 1989, MNRAS, 238, 357
- Papadakis et al. (2002) Papadakis, I.E., Petrucci, P.O., Maraschi, L., et al. 2002, ApJ, 573, 92
- Press et al. (1997) Press, W.H., Teukolsky, S.A., Vetterling, W.T., & Flannery, B.P. 1997, Numerical Recipes (Cambridge: Cambridge Univ. Press)
- Rebittlot et al. (2006) Rebillot, P.F., et al. 2006, ApJ, 641, 740
- Reynolds et al. (1996) Reynolds, C.S., Di Matteo, T., Fabian, A.C., Hwang, U., & Canizares, C.R. 1996, MNRAS, 283, 111;
- Rotschild et al. (1998) Rotschild, R.E., Blanco, P.R., Gruber, D.E., et al. 1998, ApJ, 496, 538
- Sambruna et al. (1999) Sambruna, R.M., Eracleous, M., & Mushotzky, R. 1999, ApJ, 526, 60
- Shuder & Osterbrock (1981) Shuder,J.M. & Osterbrock, D.E. 1981, ApJ, 250, 55
- Turner et al. (1997) Turner, T.J., George, I.M., Nandra, K., & Mushotzky, R.F. 1997, ApJS, 113, 23
- Vaughan et al. (2003) Vaughan, S., Edelson, R., Warwick, R.S., & Uttley, P. 2003, MNRAS, 345, 1271
- Xue & Cui (2005) Xue, Y. & Cui, W. 2005, ApJ, 622, 160
- Yaqoob et al. (2003) Yaqoob, T., et al. 2003, ApJ, 546, 759
- Zhang et al. (1999) Zhang, Y.H., et al. 1999, ApJ, 527, 719
- Zirbel & Baum et al. (1995) Baum,S.A. & Zirbel, E.L. 1995, ApJ, 448, 521

| Interval | EWFeKα | |||
|---|---|---|---|---|
| (eV) | ||||
| 1 | 0.60 | 4.1 | ||
| 2 | 0.53 | 4.5 | ||
| 3 | 0.45 | 4.4 | ||
| 4 | 0.81 | 4.0 | ||
| 5 | 1.00 | 5.2 | ||
| 6 | 0.59 | 4.8 |
Note: All errors and upper limits refer to 90% confidence levels.
| Individual Spectra | Count Rate | EWFeKα | |||
|---|---|---|---|---|---|
| (eV) | |||||
| 31 | 0.53 | ||||
| 26 | 0.55 | ||||
| 16 | 0.50 | ||||
| 12 | 0.59 | ||||
| 9 | 0.60 |
Note: The errors on are 1 (68% confidence level), whereas the upper limits on EW are 90% confidence levels.