Uncovering a pressure-tuned electronic transition in Bi1.98.Sr2.06Y0.68Cu2O8+δ using Raman scattering and x-ray diffraction
Abstract
We report pressure tuned Raman and x-ray diffraction data of Bi1.98Sr2.06Y0.68Cu2O8+δ revealing a critical pressure at 21 GPa with anomalies in six physical quantities: electronic Raman background, electron-phonon coupling , spectral weight transfer from high to low frequency, density dependent behaviour of phonon and magnon frequencies, and a compressibility change in the c-axis. For the first time in a cuprate, mobile charge carriers, lattice, and magnetism all show anomalies at a distinct critical pressure in the same experimental setting. Furthermore, the Raman spectral changes are similar to that seen traversing the superconducting dome with doping, suggesting that the critical pressure at 21 GPa is related to the much discussed critical point at optimal doping.
pacs:
One of the most outstanding questions in condensed matter physics concerns the emergence of high temperature superconductivity via doping a Mott insulator. The phase diagram of the cuprates as a function of doping offers many clues. The general phenomenology of the high-Tc phase diagram divides it into distinct under-doped and over-doped regions characterized by, respectively, insulating behaviour1 ; 2 , gapped Fermi surfaces3 ; 4 ; 5 charge, spin and current order6 ; 7 ; 8 ; 9 ; 10 ; 11 and fluctuating superconductivity 12 ; 13 on the one side, and metallicity1 ; 2 , well-defined Fermi surfaces14 , and BCS-like superconductivity on the other4 ; 5 . The under-doped region, associated with a ”pseudogap” state and a temperature scale T*4 ; 5 , has been identified through detailed changes in the curvature of the normal state resistivity2 , changes in specific heat jumps at Tc5 , or spectroscopic techniques, such as optical conductivity4 , ARPES3 ; 14 (Angle-Resolved Photoemission Spectroscopy) and Raman15 . While superconductivity prevents the establishment of a putative hidden ordered phase underneath the superconducting dome via resistivity measurements, high field experiments that quench the superconductivity reveal an electronic transition underneath the superconducting dome1 . Muon spin resonance and Kerr rotation also suggest a critical point16 ; 17 . However, the connection of the critical point with high temperature superconductivity itself is missing. With the exception of the recent work on the optical Kerr effect 17 , changes in microscopic processes involving lattice and/or magnetism have not been explicitly correlated with the evolution of the electronic structure and scattering across optimal doping, suggesting the need for a continuous tuning parameter to investigate changes on a finer scale than doping can provide.
Through Raman spectroscopy and x-ray diffraction of a slightly doped ( 0.03), insulating parent compound of the cuprates (BSr2.06Y0.68Cu2O8+δ) to pressures of 35 GPa in a Diamond Anvil Cell (DAC), we establish a critical pressure in a single sample and tie six anomalies in electronic, spin, and lattice degrees of freedom to it. Pressure, being a continuous, reversible, and laboratory controlled physical variable, can tune a single sample across a phase transition. As a contact-less probe separable from its surroundings, Raman spectroscopy circumvents the difficulties that prevent conventional methods from investigating a critical point under pressure.
Therefore, we rely primarily on spectroscopic and diffraction data to define the critical pressure. We measure electronic scattering, short-range magnetic correlation, and electron-phonon coupling via the analysis of the electronic background and collective mode frequencies/line-shape in Raman spectra15 . By also performing x-ray diffraction experiments, we measure compressibility of the lattice and phonons, identifying the c-axis lattice density in these highly layered compounds as a complimentary metric to pressure.
Single crystals of Bi1.98Sr2.06Y0.68Cu2O8+δ were grown by the floating zone method, and have a doping dependence described by Maeda18 and Terasaki19 . Raman spectroscopy was performed on 40x40 m2 crystals in both back-scattering geometry with 514.5 nm light and 135∘ incidence geometry with 488 nm light of an Argon ion laser. High-pressure structure determination was based on angle-dispersive synchrotron powder x-ray diffractometry. The diffraction experiments were carried out at the 16ID-B beamline of the High Pressure Collaborative Access Team (HPCAT), Advanced Photon Source of Argonne National Laboratory. The monochromatic xray of wavelength 0.40165 Åwas focused to a beam size of x 30 m2 with two bent mirrors. The beam was finally reduced to a size of 10 m with a pin-hole collimator and the diffraction images were recorded with a MAR345 charge coupled device and converted to 2 using Fit-2D 20 . In both Raman and x-ray diffraction experiments, samples were loaded into a DAC containing a pressure chamber of a rhenium gasket filled with a quasi-hydrostatic neon gas medium. A ruby chip served as an optical pressure sensor in the DAC21 .
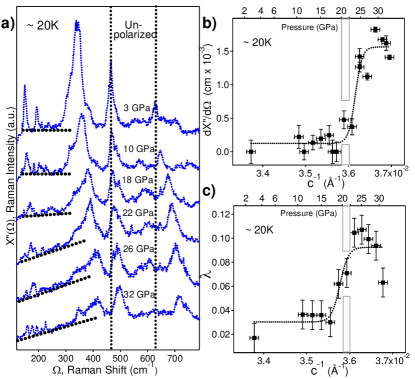
Representative Raman spectra for the insulating compound are shown in the low pressure spectra of Fig 1a. The peaks at 340cm-1, 490cm-1, and 620cm-1 are, respectively, the out-of-phase vibrations of the in-plane oxygen (B1g ”bond-buckling” mode), the oxygen vibration in the Bi-O block layer, and the apical oxygen vibration 22 . With pressure, the oxygen vibration in the block layers far from the Cu-O plane remains nearly constant, while the frequencies of the B1g bond-buckling and the apical oxygen modes shift by over 100 cm-1. Pressure, then, predominantly modifies the local crystal fields in the perovskite octahedral relevant to the physics of the Cu-O plane. In the pressure range shown, the c-axis compresses by 10 while the a,b-axes compress by 5 (see Fig 4).
We establish a pressure driven electronic transition through the onset of a linear electronic background and an abrupt increase of electron-phonon coupling at 21 GPa in the low-T Raman spectra of Fig 1. The Raman cross-section may be related to the conductivity in the following way: , such that a change in conductivity contributes a change of low frequency, linear background to the Raman cross-section23 ; 24 . Fig 1b shows the results of a linear fit of the electronic background between 200cm-1 and 300-350cm-1—a spectral range below the oxygen B1g phonon—with a sharp onset at 21GPa. Concomitant to this change in the electronic background, the intensity of the B1g phonon decreases significantly and its line-shape becomes asymmetric. The full Fano line-shape of the B1g phonon was fit using the theory of Ref. 25, giving a sharp increase of 0.1 at 21 GPa25 . The sharp change of is consistent with an increase of mobile charge carriers in the presence of an unscreened electron-phonon interaction26 . Upon further increase of metallicity, the electron-phonon interaction becomes screened as in conventional metals, consistent with the downward trend of beyond 25 GPa shown in Fig 1c. Thus both the electronic background and Fano lineshape indicate an abrupt change in conduction at 21 GPa.
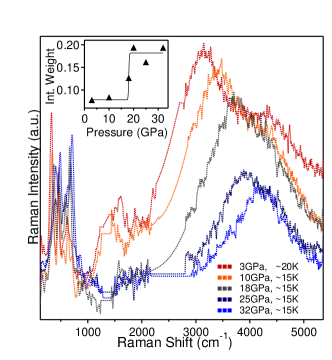
We also find a weakening of the magnetic correlation by tracking the two-magnon peak, in analogy to changes observed with doping27 . Data taken over a large spectral range reveal a substantial decrease in the high frequency 3000 - 5000 cm-1 two-magnon peak spectral weight and concomitant spectral weight increase below 1000cm-1 across the 21 GPa transition (Fig 2). This spectral weight transfer suggests that the abrupt change in conduction shown in Fig 1 occurs simultaneously with a weakening of the magnetic correlation. Plotted in the inset of Fig 2 is the ratio of the integrated spectral weight below 1,000 cm-1 to that above 1,000 cm-1 for each pressure point, showing a similar onset in the magnetic correlation at 21GPa.
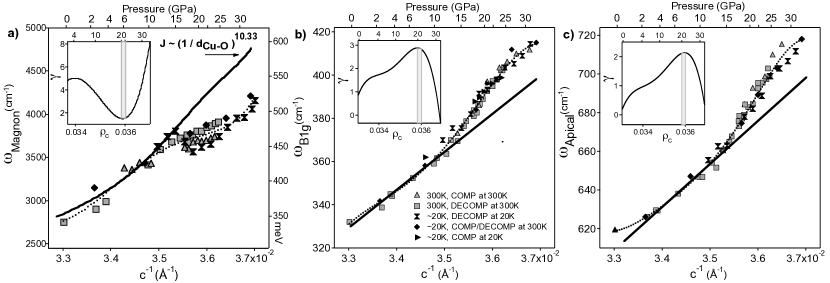
Furthermore, the two-magnon peak softens significantly in the pressure range beyond the electronic transition. The two-magnon peak positions are plotted in Fig 3a versus pressure and the c-axis lattice density. In a canonical Mott-Hubbard insulator, such as K2NiF4, the experimentally determined28 scaling of the two-magnon peak is (1/dCu-O)9.5, where dCu-O is the copper-oxygen distance. We obtain a similar exponent of (1/dCu-O)10.33 for the insulating, low pressure data. However, we find a softening of 100meV in the pressure range beyond 21GPa from the expected dependence. Note that the x-ray diffraction data in Fig 4 gives a relation between the a, b-axes and the c-axis that allows one to plot the expected dCu-O dependence versus c-axis lattice density.
Coincident with the electronic transition at 21 GPa are also changes in lattice compressibility. Figs. 3b and 3c show a maximum in the compressibility of two phonon modes (B1g and apical oxygen). The phonon frequency of the B1g and apical oxygen mode scale approximately linearly with c-axis lattice density up to 18 GPa, from 18-21GPa increase with a faster rate, and by 32 GPa show saturation. A derivative of a fit to all the points has a maximum at 21GPa for both phonons (insets); this derivative can be likened to a pressure-dependent Gruneisen parameter, () = dln()/dln(). The same type of analysis was done for the two-magnon mode (inset of Fig 3a) revealing, instead, a minimum in the Gruneisen parameter at 21 GPa.
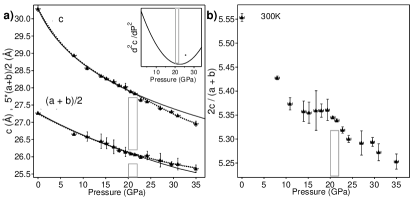
Fig 4a and 4b reveal a discontinuity in the compressibility of the c-axis also at 21 GPa. A fit to the Birch-Murnaghan equation of state deviates29 from the c-axis x-ray data at 21 GPa. This fit indicates a certain bulk modulus, (1/V)V/P, below 21 GPa, and different bulk modulus above. Further, plots of c/a reveal a kink at 21GPa; a second derivative of the polynomial fit to the c-axis data set shows an inflection point at 20-24 GPa.
We now turn to how this critical pressure at 21 GPa resembles the critical point at optimal doping and the associated dichotomy in the phase diagram. While due to the discrete doping axis significantly fewer data points are plotted and with less of a clear onset, Raman spectroscopy has also found an onset in the electronic background occurring maximally at 0.2 holes/Cu30 . Further, the line-shape evolution under pressure is not unlike that seen with doping. As with higher pressures, an appreciable is obtained for significantly doped compounds25 ; 31 . Finally, the two-magnon peak softens by a similar value ( 150meV) from the insulating state to optimal doping27 as it does by 21GPa (100meV) here. These comparisons suggest that 30 GPa is enough to traverse the high-Tc phase diagram, starting from a slightly doped parent insulator. Screening may account for the changes in and the exchange energy J across the phase diagram. With an abrupt increase in screening, the phonons should harden, accounting for the concavity of the phonon Gruneisen parameter, while the exchange energy should soften, accounting for the convexity of the magnon Gruneisen parameter.
One could also ascertain how the pressure driven transition relates to optimal doping by investigating how pressure effects more highly doped samples in the phase diagram. Past pressure experiments on superconducting samples of Bi2Sr2CaCu2O8+δ have shown increases in Tc and concomitant decreases in RH, the Hall coefficient, on the underdoped side of the dome, and decreases in Tc with continued decrease of RH on the overdoped side 32 ; 33 . The predominant interpretation is that preferred compression along the layered c-axis brings the chemically substituted block layers closer to the Cu-O planes, inducing hole doping. The dopant charge is not fully donated to the Cu-O plane in these compounds and therefore, hole count depends on the distance of the Cu-O plane to the dopants. Estimates of hole count based on LDA give 0.008 holes/Cu/GPa for both underdoped and optimally doped samples34 , which would suggest that a slightly doped parent insulator could reach optimal doping (a hole count of 0.2 hole/Cu), by 20GPa. However, this pressure induced doping does not preclude pure electronic or lattice density from also driving the transition. It does suggest that the two axes-x, P are not independent tuning parameters.
In conclusion, we have established a critical pressure at 21 GPa, where the electronic background and electron-phonon coupling show clear onsets of change, spectral weight transfers from high to low frequencies, magnons and phonons show maximum change in the Gruneisen parameter, and the c-axis compressibility changes discontinuously. This dramatic result opens up the high-Tc field to a number of other condensed matter experiments in the pressure domain. It also suggests aspects of the data and ideas based on critical points inside the superconducting dome1 ; 2 ; 3 ; 4 ; 5 ; 6 ; 7 ; 8 ; 9 ; 10 ; 11 ; 12 ; 13 ; 14 . The number of physical quantities showing anomalies across this critical pressure indicates that a unifying low energy feature, such as the Fermi surface, drives these changes. Further, the independence of the results to a number of different P, T- pathways and the discontinuity in the c-axis compressibility are consistent with a continuous, 2nd order-like transition 35 . Therefore, we suggest an electronic Lifshitz transition 36 ; 37 as a possible explanation. A change in the topology of the Fermi surface concomitant with a marked increase in mobile charge carriers may naturally occur in the cuprates, for example when the van Hove Singularity at (,0) crosses the Fermi level. Such an electronic transition would also be consistent with the doping evolution seen in ARPES14 from pockets or arcs to a large Fermi surface and with transport38 and optics39 data where the carrier number crosses over from a small (x) to large (1-x) Luttinger number near optimal doping. However, using pressure to continuously tune a single sample, we go beyond the doping evolution by identifying a distinct transition at a critical pressure and connecting lattice and magnetic anomalies to it.
We would like to acknowledge helpful discussions with R.B. Laughlin, S.A. Kivelson, S.C. Zhang, A. Mackenzie, E. Gregoryanz, and O. Degatyerova. The work at Carnegie was supported by DOE/NNSA and DOE/BES grant DE-FG02-02ER45955. The Stanford work was supported by DOE Office of Science, Division of Materials Science, with contract DE-FG03-01ER45929-A001. TPD would like to acknowledge support from NSERC, CFI and the Alexander von Humboldt Foundation. CK acknowledges support from the ONR. Use of the HPCAT facility was supported by DOE-BES, DOE-NNSA (CDAC), NSF, DOD -TACOM, and the W.M. Keck Foundation. Use of the APS was supported by DOE-BES, under Contract No. W-31-109-ENG-38.
References
- (1) Y. Ando et al. Phys. Rev. Lett. 75, 4662 (1995)
- (2) H. Takagi et al. Phys. Rev. Lett. 69, 2975 (1992)
- (3) A.G. Loeser et al. Science 273, 325 (1996)
- (4) T. Timusk and B. Statt Rep. Prog. Phys. 62, 61 (1999)
- (5) J. Tallon and J.W. Loram Physica C 349, 53 (2001)
- (6) J.M. Tranquada et al. Nature 375, 561 (1995)
- (7) T. Hanaguri et al. Nature 430, 1001 (2004)
- (8) L. Benatto, S. Caprara, and C. DiCastro. Eur. Phys. J. B. 17, 95 (2000)
- (9) J. Zaanen and O. Gunnarsson Phys. Rev. B 40, 7391 (1989)
- (10) S. Chakravary, R.B. Laughlin, D.K. Morr and Chetan Nayak Phys. Rev. B 63, 094501-1-10 (2001).
- (11) C.M. Varma et. al. Phys. Rev. B. 73, 155113 (2006)
- (12) Y.J. Uemura et. al. Phys. Rev. Lett. 62, 2317 (1989)
- (13) S.A. Kivelson Rev. Mod. Phys. 75, 1201-1241 (2003)
- (14) A. Damascelli, Z. Hussain, Z-X. Shen Rev. Mod. Phys. 75, 473 (2003)
- (15) T.P. Devereaux and R. Hackl Rev. Mod. Phys. 79, 175 (2007)
- (16) J.E. Sonier et. al. cond-mat.supr-con arXiv: 0707.2104v1 (2007)
- (17) J. Xia et. al. cond-mat.supr-con arXiv: 0711.2494v1 (2007)
- (18) A. Maeda et al. Phys. Rev. B 41, 6418-6434 (1990)
- (19) I. Terasaki, T. Takemura, T. Takayanagi and T. Kitajima Proceedings of the 12th International Conference on Superconductivity. Cond-mat: 9911153 (1999)
- (20) A. P. Hammersley, S. O. Svensson, M. Hanfland, A. N. Fitch, and D. H usermann High Press. Res. 14, 235-248 (1996)
- (21) H. K. Mao, J. Xu, and P. M. Bell J. Geophys. Res. 91, 4673-4676 (1986)
- (22) M. Kakihana Phys. Rev. B 53, 11796-11806 (1996)
- (23) B. Shastry and B. Shraiman Phys. Rev. Lett. 65, 1068-1071 (1990)
- (24) J.K. Freericks and T.P. Devereaux Phys. Rev. B 64, 125110-1-11 (2001)
- (25) T.P. Devereaux, Virosztek, and A. Zawadowski Phys. Rev. B 51, 505-514 (1995)
- (26) M. Capone et al. Science 296, 2364 (2002)
- (27) S. Sugai, H. Suzuki, Y. Takayanagi, T. Hosokawa, and N. Hayamizu Phys. Rev. B 68, 184504-7 (2003)
- (28) V. Struzhkin, U. Schwarz, H. Wilhelm, and K. Syassen Materials Science and Engineering A168, 103-106 (1993)
- (29) F. Birch Physical Review 71, 809-824 (1947)
- (30) F. Venturini et al. Phys. Rev. Lett. 89, 107003-1-4 (2002)
- (31) M. Opel Phys. Rev. B 60, 9837-9844 (1999); Phys. Rev. B 69, 064514 (2004)
- (32) X. J. Chen et al. Phys. Rev. B 70, 214502 (2004)
- (33) C. Murayama et al. Physica C 183, 277 (1991)
- (34) J. D. Jorgensen et al. Physica C 171, 93-102 (1990)
- (35) L.D. Landau, and E.M. Lifshitz Statistical Physics, 3rd ed. Pt. 1. Oxford: Butterworth-Heinemann, p. 202 (2001)
- (36) I.M. Lifshitz Soviet Physics JETP 11, 1130 (1960)
- (37) G. G. N. Angilella, E. Piegari, and A. A. Varlamov Phys. Rev. B 66, 014501 (2002)
- (38) N.P. Ong, Z.Z. Wang, J. Clayhold, J. Tarascon, L. Greene, and W.R. Mckinnon Phys. Rev. B 35, 8807 (1987)
- (39) S. Uchida, T. Ido, H. Takagi, T. Arima, Y. Tokura, and S. Tajima Phys. Rev. B 43 7942-7954 (1991)