H Kinematics of the SINGS Nearby Galaxies Survey – II
Abstract
This is the second part of an H kinematics follow–up survey of
the Spitzer Infrared Nearby Galaxies Survey (SINGS) sample.
The aim of this program is to shed new light on the role of baryons
and their kinematics and on the dark/luminous matter relation in the
star forming regions of galaxies, in relation with studies at other
wavelengths. The data for 37 galaxies are presented. The
observations were made using Fabry–Perot interferometry with the
photon–counting camera FaNTOmM on 4 different telescopes, namely the
Canada–France–Hawaii 3.6m, the ESO La Silla 3.6m, the William
Herschel 4.2m, and the Observatoire du mont Mégantic 1.6m
telescopes. The velocity fields are computed using custom IDL
routines designed for an optimal use of the data. The kinematical
parameters and rotation curves are derived using the GIPSY
software. It is shown that non–circular motions associated with
galactic bars affect the kinematical parameters fitting and the
velocity gradient of the rotation curves. This leads to incorrect
determinations of the baryonic and dark matter distributions in the
mass models
derived from those rotation curves.
keywords:
instrumentation: interferometers – techniques: radial velocities – galaxies: ISM – galaxies: kinematics and dynamics – galaxies: dark matter – surveys1 Introduction
Understanding star formation mechanisms and their physical connection to the interstellar medium (ISM) properties of galaxies is crucial for resolving astrophysical issues such as the physical nature of the Hubble sequence, the nature and triggering of starbursts, and the interpretation of observations of the high–redshift universe. These scientific objectives constitute the core science program of the Spitzer Infrared Nearby Galaxies Survey (SINGS) (Kennicutt et al., 2003). Since the science drivers of the project are dependent of many variables, the SINGS project requires a comprehensive set of data including infrared imaging and spectroscopic data, broadband imaging in the visible and near–infrared as well as UV imaging and spectrophotometry. The Spitzer data and ancillary observations of the SINGS galaxies will also provide valuable tools for understanding the physics of galaxy formation and evolution.
The formation of individual stars from the collapse of dense molecular clouds is relatively well known, e.g. the intensity of star formation is strongly correlated with the column density of gas and stars (Kennicutt, 1998b). However, the large–scale processes driving star formation are still poorly understood. For instance, the effect of gas dynamics on the regulation of star formation is somewhat unknown. Since young stars are often associated with spiral arms, it is thought that protostars are formed from compressed gas along large–scale shock fronts. Moreover, the star formation history varies greatly along the Hubble sequence. Elliptical galaxies, being gravitationally supported by velocity dispersion, have exhausted their gas reservoir and hence star–forming processes have ceased (Kennicutt, 1998a). Nevertheless, some elliptical galaxies having a rotating disc are still forming stars (e.g. NGC 2974, Jeong et al. 2007). Spiral galaxies, on the other hand, continue to form stars and are supported by rotation. Understanding the effect of gas dynamics on star formation would certainly help improving our understanding of galaxy formation. Indeed, a Schmidt law modulated by rotation seems to better fit the data than a simple (gas column density) Schmidt law (Boissier et al., 2003; Martin & Kennicutt, 2001; Kennicutt, 1989).
This paper presents the second part of an H kinematics survey of the SINGS galaxies. The 37 galaxies showing H emission were observed by means of Fabry–Perot (FP) interferometry. The paper is organized as follows. Section 2 describes the composition of the SINGS sample and the hardware used for the observations. The data reduction process, using a custom IDL pipeline designed for an optimal use of the data, is introduced in section 3. In section 4, the details of the kinematical analysis that has been done on the SINGS galaxies are described. Section 5 presents the observational results in the form of velocity fields, monochromatic maps, position–velocity diagrams, and rotation curves. In section 6, the effect of the bar on the observed kinematics is discussed. Finally, the scientific applications of the kinematical results presented in this paper are reviewed in section 7.
2 Observations
2.1 The sample
The sample, as described by Kennicutt et al. (2003), is composed of 75 nearby ( Mpc, for = 70 km s-1Mpc-1) galaxies covering, in a three–dimensional parameter space, a wide range of physical properties:
-
•
morphological type : associated with gas fraction, star formation rate (SFR) per unit mass, and bulge/disc structure;
-
•
luminosity : associated with galaxy mass, internal velocity, and mean metallicity;
-
•
FIR/optical luminosity ratio : associated with dust temperature, dust optical depth, and inclination.
In particular, there are roughly a dozen galaxies in each RC3 type (E–S0, Sa–Sab, Sb–Sbc, Sc–Scd, Sd–Sm, Im–I0) leading to an extensive set of combinations of luminosity and FIR/optical luminosity ratio. In particular, a factor of in infrared luminosity and in is covered by the sample. The 75 galaxies also represent a vast range of other galaxy properties such as nuclear activity, surface brightness, inclination, CO/HI ratio, spiral arm structure, bar structure, and environment. The galaxies were chosen as far as possible from the Galactic plane in order to avoid Galactic extinction and high density of foreground stars.
Since gas fraction is correlated with morphological type (Boselli et al., 2001), not all the 75 galaxies are H emitters. In fact, H was not detected for ten galaxies (E–S0 and Irr types), thus kinematical information could not be extracted for those galaxies from emission lines. H kinematics for 28 galaxies of the SINGS sample have already been published in Daigle et al. (2006a). This paper presents the second part of the follow–up survey, namely the H kinematics of the remaining 37 galaxies. Table 1 presents the basic galaxy parameters.
| Galaxy | (J2000) | (J2000) | Type | 111: distance. Taken from Kennicutt et al. (2003). | 222: apparent major diameter at the 25 mag arcsec-2 in B. Taken from the RC3. | 333: total apparent magnitude in B. Taken from the RC3. | 444: total absolute magnitude in B. Calculated from and . | 555: systemic velocity. Taken from Kennicutt et al. (2003). |
| name | (hh mm ss) | (∘ ′ ′′) | RC3 | (Mpc) | (arcmin) | ( km s-1) | ||
| NGC 24 | 00 09 56.7 | 24 57 44 | SA(s)c | 8.2 | 5.8 | 12.19 | 17.38 | 554 |
| NGC 337 | 00 59 50.3 | 07 34 44 | SB(s)d | 24.7 | 2.9 | 12.06 | 19.90 | 1650 |
| NGC 855 | 02 14 03.6 | 27 52 38 | E | 9.6 | 2.6 | 13.30 | 16.61 | 610 |
| NGC 1097 | 02 46 19.0 | 30 16 30 | SB(r’1)b | 16.9 | 9.3 | 10.23 | 20.91 | 1275 |
| NGC 1291 | 03 17 18.6 | 41 06 29 | SB(l)0/a | 9.7 | 9.8 | 9.39 | 21.75 | 839 |
| NGC 1482 | 03 54 39.3 | 20 30 09 | SA0 | 22.0 | 2.5 | 13.10 | 18.61 | 1655 |
| NGC 1512 | 04 03 54.3 | 43 20 56 | SB(r)ab | 10.4 | 8.9 | 11.13 | 18.96 | 896 |
| NGC 1566 | 04 20 00.4 | 54 56 16 | SAB(rs) | 18.0 | 8.3 | 10.33 | 20.95 | 1496 |
| NGC 1705 | 04 54 13.5 | 53 21 40 | SA0 | 5.8 | 1.9 | 12.77 | 16.05 | 628 |
| Ho II | 08 19 05.0 | 70 43 12 | Im | 3.5 | 7.9 | 11.10 | 16.62 | 157 |
| DDO 053 | 08 34 07.2 | 66 10 54 | Im | 3.5 | 1.5 | 14.70 | 13.02 | 19 |
| NGC 2841 | 09 22 02.6 | 50 58 35 | SA(r)b | 9.8 | 8.1 | 10.09 | 19.87 | 638 |
| Ho I | 09 40 32.3 | 71 10 56 | IAB(s)m | 3.5 | 3.6 | 13.00 | 14.72 | 143 |
| NGC 3034 | 09 55 52.2 | 69 40 47 | I0 | 3.5 | 11.2 | 9.30 | 18.42 | 203 |
| Ho IX | 09 57 32.0 | 69 02 45 | Im | 3.5 | 2.5 | 14.30 | 13.42 | 46 |
| NGC 3190 | 10 18 05.6 | 21 49 55 | SA(s)a | 17.4 | 4.4 | 12.12 | 19.08 | 1271 |
| IC 2574 | 10 28 21.2 | 68 24 43 | SAB(s)m | 3.5 | 13.2 | 10.80 | 16.92 | 57 |
| NGC 3265 | 10 31 06.8 | 28 47 47 | E | 20.0 | 1.3 | 13.00 | 18.50 | 1421 |
| Mrk 33 | 10 32 31.9 | 54 24 03 | Im | 21.7 | 1.0 | 13.20 | 18.50 | 1461 |
| NGC 3351 | 10 43 57.7 | 11 42 13 | SB(r)b | 9.3 | 7.4 | 10.53 | 19.31 | 778 |
| NGC 3627 | 11 20 15.0 | 12 59 30 | SAB(s)b | 8.9 | 9.1 | 9.65 | 20.10 | 727 |
| NGC 3773 | 11 38 13.0 | 12 06 43 | SA0 | 18.3 | 1.2 | 12.90 | 18.40 | 987 |
| NGC 4254 | 12 18 49.6 | 14 24 59 | SA(s)c | 20.0 | 5.4 | 10.44 | 21.07 | 2407 |
| NGC 4450 | 12 28 29.6 | 17 05 06 | SA(s)ab | 20.0 | 5.2 | 10.90 | 20.61 | 1954 |
| NGC 4559 | 12 35 57.7 | 27 57 35 | SAB(rs)cd | 11.6 | 10.7 | 10.46 | 19.86 | 816 |
| NGC 4594 | 12 39 59.4 | 11 37 23 | SA(s)a | 13.7 | 8.7 | 8.98 | 21.70 | 1091 |
| NGC 4631 | 12 42 08.0 | 32 32 26 | SB(s)d | 9.0 | 15.5 | 9.75 | 20.02 | 606 |
| NGC 4736 | 12 50 53.0 | 41 07 14 | SA(r)ab | 5.3 | 11.2 | 8.99 | 19.63 | 308 |
| DDO 154 | 12 54 05.2 | 27 08 59 | IB(s)m | 5.4 | 3.0 | 13.94 | 14.72 | 376 |
| NGC 4826 | 12 56 43.7 | 21 40 52 | SA(rs)ab | 5.6 | 10.0 | 9.36 | 19.38 | 408 |
| DDO 165 | 13 06 24.8 | 67 42 25 | Im | 3.5 | 3.5 | 12.80 | 14.92 | 37 |
| NGC 5033 | 13 13 27.5 | 36 35 38 | SA(s)c | 13.3 | 10.7 | 10.75 | 19.87 | 875 |
| NGC 5408 | 14 03 20.9 | 41 22 40 | IB(s)m | 4.5 | 1.6 | 12.20 | 16.07 | 509 |
| NGC 5474 | 14 05 01.6 | 53 39 44 | SA(s)cd | 6.9 | 4.8 | 11.28 | 17.91 | 273 |
| NGC 6822 | 19 44 56.6 | 14 47 21 | IB(s)m | 0.6 | 15.5 | 9.31 | 14.58 | 57 |
| NGC 7552 | 23 16 11.0 | 42 34 59 | SB(s)ab | 22.3 | 3.4 | 11.25 | 20.49 | 1585 |
| NGC 7793 | 23 57 49.8 | 32 35 28 | SA(s)d | 3.2 | 9.3 | 9.63 | 17.90 | 230 |
2.2 Observing runs
The observations have been obtained with the same instrumental set–up consisting of a scanning Fabry–Perot (FP) interferometer, an imaging device designed for faint fluxes, and a narrow–band (15Å) interference filter. For imaging, a photon–counting camera (FaNTOmM) and an Andor commercial (L3CCD) camera were used. Each instrument was attached to a focal reducer at the Cassegrain or Nasmyth focus of the telescope. The focal reducers used were Panoramix at the Observatoire du mont Mégantic (OmM) 1.6m telescope, Cigale at the European Southern Observatory (ESO) La Silla 3.6m telescope, MOS/FP at the Canada–France–Hawaii 3.6m telescope (CFHT), and GHaFaS at the William Herschel 4.2m telescope (WHT). Table 2 describes the various characteristics of the instruments.
The spectral profiles for every pixel in the field of view were obtained by scanning the free spectral range (FSR) of the Fabry–Perot. The FSR is the wavelength interval between two adjacent transmission peaks :
| (1) |
where is the rest wavelength and p the interference order. The number of channels needed to scan the FSR must be at least 2.2 times the FP finesse F for a good sampling (Nyquist criteria). The finesse is a dimensionless parameter representing the spectral resolving power R of the scanned line and is related to the full–width half–maximum (FWHM) of the transmitted line:
| (2) |
The FP etalon used for the observations has a high interference order (typically p=765 at H) and is capable of achieving high values for the finesse and spectral resolution. A typical observation would be to scan the FP etalon in 48 channels with an exposure time of 15s per channel, then repeat the process for 15 cycles. However, when the sky transparency is not excellent during an exposure, the etalon is scanned more rapidly with an exposure time of 10s per channel so that the atmospheric conditions can be averaged out more efficiently. The resulting data cube is a set of interferograms stacked together, where each one represents an image of the object modulated by the interference pattern for a given FP spacing.
The filter set used has 24 narrow–band H filters covering the galaxies’ systemic velocities ranging from –300 to 10 0000 km s-1. Sometimes, the filter was tilted by a few degrees to adjust its central wavelength to the Doppler shifted galaxy emission. Narrow–band filters, used to select the proper order that will go through the etalon, allow for the H emission to pass while at the same time blocking most of the night sky emission.
The photon–counting cameras FaNTOmM I & II (Hernandez et al., 2003) consist of a GaAs Hamamatsu photomultiplier tube having a quantum efficiency of 23% coupled to a Dalsa commercial CCD. The absence of read–out noise for this camera enables one to scan very rapidly the FP interferometer whereas CCDs need long exposures to overcome their read–out noise. Consequently, FaNTOmM can achieve high signal to noise ratios (S/N) and thus is ideal for faint fluxes like the emission found in galaxies (Gach et al., 2002). Additionally, a camera using a low light level charge–coupled device (L3CCD) made by Andor Technology was also used as the imaging device. L3CCDs have high quantum efficiency (80 per cent) and sub–electron readout noise (0.1 e-). This kind of sensor differs from traditional CCDs in the sense that the signal is amplified before it reaches the output circuitry which is the major source of noise. Gain is created by passing electrons through a multiplication register where an electron will create a second one by avalanche multiplication. More details about the L3CCD can be found in Daigle et al. (2004) and in Daigle, Carignan, & Blais–Ouellette (2006).
The observations of the sample were spread over nine different observing runs over a three year period. Five runs took place at the OmM 1.6m telescope where FaNTOmM is a permanent instrument. A second generation instrument, called FaNTOmM II, has been built recently and was tested successfully on the faint dwarf galaxy DDO 154 during one of these runs. Also, a new instrument for the La Silla NTT is under development and regarding this matter, the L3CCD camera was used to test its capabilities on very faint fluxes like galaxies. Therefore, four galaxies were observed with this camera during the same run at the OmM Observatory. Two runs took place at the ESO La Silla 3.6m telescope and one at the CFHT 3.6m telescope, both where FaNTOmM I is a visitor instrument. A last observing run took place at the WHT 4.2m telescope with the new instrument GHaFas (Carignan et al., 2007). The Fabry–Perot observations parameters for each galaxy can be found in Table 3.
| Telescope | Instrument | Pixel Size | FOV |
|---|---|---|---|
| (arcsec) | (arcmin) | ||
| OmM | FaNTOmM | 1.61 | 19.43 |
| OmM | FaNTOmM II | 1.54 | 18.55 |
| OmM | L3CCD | 1.07 | 12.89 |
| ESO | FaNTOmM | 0.42 | 5.02 |
| CFHT | FaNTOmM | 0.48 | 5.84 |
| WHT | GHaFaS | 0.40 | 4.82 |
| Galaxy | Date | FWHM | p | FSR | F | R | ||||||
| 666: Non–tilted filter central wavelength at 20∘C (in Å) | 777FWHM: Non–tilted filter Full–Width Half–Maximum at 20∘C (in Å) | 888: Non–tilted filter transmission at and at 20∘C (in %) | 999: Total exposure time (in min) | 101010: Total exposure time per channel (in min) | 111111p: Interference order at H | 121212FSR: Free spectral range at H (in km s-1) | 131313F: Finesse | 141414R: Resolution according to the finesse | 151515: Number of FP channels | 161616: wavelength difference between channels (in Å) | ||
| NGC 24 171717ESO: European Southern Observatory, La Silla, Chile, 3.6m telescope. | 2005/11/04 | 6581 | 19.8 | 60 | 150 | 2.50 | 765 | 392 | 19.7 | 15071 | 60 | 0.14 |
| NGC 337\footrefESO | 2005/11/02 | 6598 | 18.2 | 73 | 150 | 2.50 | 765 | 392 | 20.5 | 15657 | 60 | 0.14 |
| NGC 855181818OmM: Observatoire du mont Mégantic, Québec, Canada, 1.6m telescope. | 2003/11/27 | 6584 | 15.5 | 74 | 190 | 4.75 | 609 | 492 | 13.2 | 8010 | 40 | 0.27 |
| NGC 1097\footrefESO | 2005/11/07 | 6598 | 18.2 | 73 | 470 | 7.83 | 765 | 392 | 20.0 | 15321 | 60 | 0.14 |
| NGC 1291\footrefESO | 2005/11/06 | 6584 | 15.5 | 74 | 385 | 6.42 | 765 | 392 | 20.5 | 15669 | 60 | 0.14 |
| NGC 1482\footrefESO | 2005/11/08 | 6608 | 16.2 | 69 | 115 | 1.92 | 765 | 392 | 20.3 | 15561 | 60 | 0.14 |
| NGC 1512\footrefESO | 2005/11/03 | 6584 | 15.5 | 74 | 740 | 2.67 | 765 | 392 | 17.5 | 13389 | 60 | 0.14 |
| NGC 1566\footrefESO | 2005/11/02 | 6598 | 18.2 | 73 | 150 | 2.50 | 765 | 392 | 20.7 | 15864 | 60 | 0.14 |
| NGC 1705\footrefESO | 2005/11/03 | 6581 | 19.8 | 60 | 130 | 2.17 | 765 | 392 | 20.0 | 15282 | 60 | 0.14 |
| Ho II \footrefOmM | 2005/02/05 | 6563 | 30.4 | 80 | 204 | 4.25 | 765 | 392 | 17.7 | 13527 | 48 | 0.18 |
| DDO 053191919CFHT: Canada–France–Hawaii Telescope, Hawaii, USA, 3.6m telescope. | 2006/04/07 | 6563 | 30.4 | 80 | 96 | 2.00 | 765 | 392 | 18.1 | 13885 | 48 | 0.18 |
| NGC 2841 \footrefOmM | 2005/02/03 | 6584 | 15.5 | 74 | 240 | 5.00 | 765 | 392 | 12.7 | 9731 | 48 | 0.18 |
| Ho I \footrefCFHT | 2006/04/05 | 6563 | 30.4 | 80 | 176 | 3.67 | 765 | 392 | 14.2 | 10869 | 48 | 0.18 |
| NGC 3034\footrefOmM | 2007/03/01 | 6581 | 19.8 | 60 | 384 | 8.00 | 765 | 392 | 17.2 | 13181 | 48 | 0.18 |
| Ho IX \footrefOmM | 2005/05/10 | 6563 | 30.4 | 80 | 228 | 4.75 | 765 | 392 | 15.9 | 12185 | 48 | 0.18 |
| NGC 3190\footrefOmM | 2004/11/03 | 6598 | 18.2 | 73 | 144 | 3.00 | 765 | 392 | 15.6 | 11905 | 48 | 0.18 |
| IC 2574 \footrefOmM | 2005/02/03 | 6563 | 30.4 | 80 | 180 | 3.75 | 765 | 392 | 16.6 | 12713 | 48 | 0.18 |
| NGC 3265\footrefOmM | 2007/03/01 | 6598 | 18.2 | 73 | 100 | 2.08 | 765 | 392 | 18.8 | 14396 | 48 | 0.18 |
| Mrk 33 \footrefCFHT | 2006/04/08 | 6598 | 18.2 | 73 | 48 | 1.00 | 765 | 392 | 16.7 | 12798 | 48 | 0.18 |
| NGC 3351\footrefOmM | 2005/02/03 | 6584 | 15.5 | 74 | 156 | 3.25 | 765 | 392 | 18.0 | 13750 | 48 | 0.18 |
| NGC 3627\footrefOmM | 2005/02/06 | 6584 | 15.5 | 74 | 144 | 3.00 | 765 | 392 | 16.6 | 12670 | 48 | 0.18 |
| NGC 3773\footrefCFHT | 2006/04/08 | 6584 | 15.5 | 74 | 76 | 1.58 | 765 | 392 | 17.2 | 13127 | 48 | 0.18 |
| NGC 4254\footrefOmM | 2005/02/14 | 6621 | 18.0 | 68 | 240 | 5.00 | 765 | 392 | 17.4 | 13825 | 48 | 0.18 |
| NGC 4450\footrefESO | 2002/04/07 | 6607 | 12.0 | 69 | 60 | 2.50 | 793 | 381 | 12.1 | 4604 | 24 | 0.35 |
| NGC 4559\footrefOmM | 2005/02/06 | 6584 | 15.5 | 74 | 408 | 8.50 | 765 | 391 | 16.5 | 12631 | 48 | 0.18 |
| NGC 4594202020WHT: William Herschel Telescope, La Palma, Spain, 4.2m telescope. | 2007/07/05 | 6585 | 15.5 | 75 | 64 | 5.00 | 765 | 392 | 16.5 | 12623 | 48 | 0.18 |
| NGC 4631\footrefOmM | 2005/02/01 | 6584 | 15.5 | 74 | 180 | 3.75 | 765 | 392 | 18.0 | 13757 | 48 | 0.18 |
| NGC 4736\footrefOmM | 2005/05/11 | 6563 | 30.4 | 80 | 216 | 4.50 | 765 | 392 | 16.7 | 12745 | 48 | 0.18 |
| DDO 154 \footrefOmM | 2007/02/22 | 6581 | 19.8 | 60 | 320 | 8.00 | 765 | 392 | 17.1 | 13097 | 40 | 0.21 |
| NGC 4826\footrefCFHT | 2006/04/07 | 6563 | 30.4 | 80 | 128 | 2.67 | 765 | 392 | 17.2 | 13121 | 48 | 0.18 |
| DDO 165\footrefCFHT | 2006/04/06 | 6563 | 30.4 | 80 | 172 | 3.58 | 765 | 392 | 17.1 | 13091 | 48 | 0.18 |
| NGC 5033\footrefOmM | 2005/05/10 | 6584 | 15.5 | 74 | 460 | 9.58 | 765 | 392 | 16.7 | 12782 | 48 | 0.18 |
| NGC 5408\footrefCFHT | 2006/04/07 | 6581 | 19.8 | 60 | 108 | 2.25 | 765 | 392 | 17.1 | 13083 | 48 | 0.18 |
| NGC 5474\footrefOmM | 2007/02/28 | 6581 | 19.8 | 60 | 108 | 2.25 | 765 | 392 | 17.2 | 13157 | 48 | 0.18 |
| NGC 6822\footrefESO | 2005/11/08 | 6563 | 30.4 | 80 | 60 | 1.00 | 765 | 392 | 19.8 | 15121 | 60 | 0.14 |
| NGC 7552\footrefESO | 2005/11/02 | 6598 | 18.2 | 73 | 120 | 2.00 | 765 | 392 | 19.8 | 15160 | 60 | 0.14 |
| NGC 7793\footrefESO | 2005/11/08 | 6563 | 30.4 | 80 | 100 | 1.67 | 765 | 392 | 19.7 | 15040 | 60 | 0.14 |
3 Data reduction
This section introduces the few steps towards obtaining radial velocities and monochromatic maps from raw interferograms. In particular,
-
•
wavelength calibration;
-
•
spectral smoothing and sky emission subtraction;
-
•
adaptive spatial binning and map extraction;
-
•
WCS astrometry.
For a more complete description of the data reduction steps, we refer to Hernandez et al. (2005a), Daigle et al. (2006a), Daigle et al. (2006b), and Chemin et al. (2006a). The software used can be found at http://www.astro.umontreal.ca/fantomm/reduction.
3.1 Wavelength calibration
The raw data cube, obtained during an acquisition, must be wavelength corrected since the transmitted wavelength is a function of the angle of the incoming light beam :
| (3) |
where p is the interference order at (6562.78 Å), n the index of the medium, and e the distance between the parallel plates of the etalon. The wavelength calibration is made by scanning the neon line at 6598.95 Å just before and after a three hour acquisition, in the same conditions as the observation itself. This enables one to calculate the phase shift needed to assign a wavelength to a particular FP spacing, for every pixel of the field. This phase map transforms raw interferograms into a wavelength–sorted data cube. Since one can only know the transmitted wavelength value FSR, an uncertainty remains on the zero–point of the velocity scale. Comparison with other kinematical work will remove this uncertainty. Note that the data cubes are not flux–calibrated.
3.2 Spectral smoothing and sky emission subtraction
A Hanning smoothing was performed on every spectrum of the wavelength–sorted data cubes in order to remove any artifacts caused by the discrete sampling. After that, the strong night sky emission lines were subtracted. The method used for this is to reconstruct a sky cube using the sky dominated regions and interpolating it in the galaxy region. This sky cube was then subtracted from the data cube. This method has proven to be very successful at eliminating sky residuals compared with subtracting a median sky spectrum where both spatial and spectral inhomogeneities in the interference filter can lead to high sky residuals.
3.3 Adaptive spatial binning and map extraction
In order to increase the signal–to–noise ratio (S/N) in the diffuse and/or faint interstellar regions (e.g. inter–arm regions) of the observed galaxies, an adaptive spatial binning was applied to the data cubes. This technique is based on Voronoi diagrams where pixels are accreted into bins until the desired S/N (5, typically chosen) is reached. In high intensity emission regions like the galactic center and spiral arms, the S/N exceeds by far the targeted minimal value and hence the high spatial resolution is maintained. This is an improvement over the usual gaussian smoothing where the kernel convolution would dilute the signal in high S/N regions.
Next, the final steps are the integration of the flux under the H line for every bin, yielding a monochromatic map, and the barycenter computation, yielding a velocity field, following the procedure described by Daigle et al. (2006b). The radial velocities (RV) are given in the heliocentric rest frame. A continuum map and a velocity dispersion map are also computed by the algorithm. The determination of the continuum threshold is a critical step in the data reduction as it defines the position of the barycenter of the line. This is done by iterative procedures.
3.4 WCS astrometry
Finally, WCS coordinates are attached to the computed maps using the task koords in the KARMA package (Gooch, 1996). No references to the World Coordinate System are obtained during the acquisition and are necessary since the major axes position angle (PA) of the galaxy is field–orientation dependent. Besides, WCS astrometry is needed to combine the H kinematics with ancillary SINGS surveys. The coordinates are added by comparing positions of stars between a reference file (a redband DSS image for instance) and the FP non–binned continuum image.
4 kinematical parameters fitting
Rotation curves are computed using the task rotcur available in the GIPSY software (Vogelaar & Terlouw, 2001). Rotcur derives the kinematical parameters for a particular galaxy by fitting tilted–rings to the observed velocity field. More precisely, a least–squares–fitting is done to the function :
| (4) |
Here denotes the radial velocity at the pixel coordinates (x,y), the systemic velocity, the rotational velocity for the corresponding radius r, the azimuthal angle from the major axis in the plane of the galaxy, the inclination angle of the galaxy, and the expansion velocity. Since GIPSY does not take into account the field rotation of the supplied velocity field with respect to WCS coordinates, the velocity fields were all rotated in order to compute accurate position angles (PAs) of the kinematical major axis.
Fitting the kinematical parameters was done in a three–step process. First, the systemic velocity and the kinematical center () are fitted while keeping fixed the inclination i and position angle PA. The starting parameters used are the photometric i and PA given by the hyperleda catalog and for , the value used for selecting the interference filter. The starting values for the galactic center are the photometric center corresponding to the maximum value near the galactic center in the continuum map for spiral galaxies or in the Spitzer 3.6 m image for distorted and irregular galaxies. Then, a second fitting is done by letting i, PA, and vary with radius while keeping fixed the new–found values for , , and, . Finally, rotcur is run again, with only as the varying parameter. The computed rotation curve is thus derived with fixed kinematical parameters so that the sample could be homogeneous, even though some velocity fields (e.g. NGC 3627) were better modeled with parameters varying with radius.
The ring width used in the fitting procedure was set to be greater than 3 times the pixel width for a good sampling. The result is 5″ for the OmM observations and 2″ for the ESO, CFHT and WHT observations. Also, additional rotcur runs were done for the approaching and receding sides separately in order to model any asymmetries arising between the two sides. Finally, the expansion velocity was fixed to zero for all galaxies, thus assuming pure circular rotation. Letting vary with radius did not change significantly the rotation velocities in the computed regions.
Two rotcur parameters remain to be explained, namely the free angle and the weighting function. To diminish the importance of deprojection errors, radial velocities in an opening angle (called the free angle) of typically 35∘ about the minor axis were rejected from the least–square fitting and a (where = angle from the major axis) weighting function was applied to give more importance to points near the major axis. Naturally, for more face–on galaxies, the projected velocities along the line–of–sight possess little information about rotational velocities resulting in large errors for the kinematical parameters.
Afterwards, the GIPSY output was analyzed by IDL routines (mainly computing averages and standard deviations). The determination of constant values for i and PA throughout the galaxy is performed by eliminating radii where non–circular motions and warps can occur. For a non–barred galaxy, this results in discarding radii located in the galactic center and outer spiral arms where one usually finds a substantial scatter in i and PA values. For a barred galaxy, this is complicated by the fact that important non–circular motions are present in the bar region, therefore this region was excluded from the fit. Also, for barred and non–barred galaxies, rings containing too few points or dominated by one side of the galaxy were discarded.
5 Results
This section presents the H monochromatic and RV maps as well as the rotation curves for each galaxy in order of increasing right ascension. Appendix A briefly describes the observed kinematics for each galaxy of the sample. In Appendix B, four images per galaxy are first shown : DSS blue image when available (top–left), Spitzer 3.6 m image (top–right), H monochromatic image (middle–left), and the corresponding H velocity field (middle–right). The blue images show the intermediate ( yrs) stellar population and the 3.6 m the old stellar population, tracer of the total mass of galaxies, while the H monochromatic maps show the gas ionized by massive (M M☉), young ( yrs) OB stars (Kennicutt, 1998a; Boselli et al., 2001). These four maps are WCS–oriented and represent the same field of view. For each galaxy, the field of view is adjusted so that the H morphology and kinematics as well as the large scale stellar morphology are displayed with great detail. The maps and the rotation curves can be found at http://www.astro.umontreal.ca/fantomm/singsII/
Moreover, a position–velocity (PV) diagram is provided for each galaxy when the extraction of the kinematical parameters was possible. They represent a slice in the data cube along the kinematical major axis. The black line, superposed on the diagrams, represents a cut in the model velocity field. A data cube slice along the kinematical major axis showing a rotation curve which superposes well on the velocities of the maximum intensity of the ionized gas emission implies that there are no significant non–circular motions nor any kinematical twist. Lastly, rotation curves can be found in Appendix C. The definition of the errors used is either the largest velocity difference between both sides and the approaching or receding side separately, or the rotcur intrinsic error if it is greater.
The kinematical parameters inclination and position angle found by the technique described in section 4 are presented in Table 4. Figure 1 compares the kinematical parameters with respect to the photometric values. As expected, the agreement is better for the PAs than for the inclinations. The two points that stand out are NGC 1512 (iphot = 65∘ & ikin = 35∘) and NGC 1566 (iphot = 56∘ & ikin = 32∘). In both cases, the explanation is quite clear: the photometric parameters are mainly representative of the bar which contributes a large part of the light resulting in more edge–on values. Only looking at the B or 3.6-m images in Figures B7 & B8, one can see that the outer isophotes are much more face–on.
Finally, on the overall 37 galaxies exhibiting H emission, it was not possible to extract rotation curves for 21 of them due to either poor spatial coverage, absence of large–scale rotation or extremely perturbed discs.
| Galaxy | Phot | Kin | ||
|---|---|---|---|---|
| name | PA | i | PA | i |
| NGC 24 | 225 | 78 | 226 1 | 75 3 |
| NGC 337 | 130 | 53 | 121 5 | 52 6 |
| NGC 1097 | 140 | 37 | 133 1 | 55 1 |
| NGC 1512 | 253 | 65 | 260 1 | 35 14 |
| NGC 1566 | 212 | 56 | 214 2 | 32 14 |
| NGC 2841 | 147 | 68 | 150 1 | 70 1 |
| NGC 3351 | 193 | 42 | 193 1 | 41 2 |
| NGC 3627 | 173 | 57 | 173 7 | 65 7 |
| NGC 4254 | 45 | 28 | 69 3 | 31 6 |
| NGC 4450 | 355 | 43 | 353 5 | 49 17 |
| NGC 4559 | 330 | 67 | 323 3 | 68 5 |
| NGC 4736 | 285 | 35 | 292 2 | 36 7 |
| DDO 154 | 219 | 48 | 236 17 | 59 32 |
| NGC 4826 | 295 | 60 | 291 1 | 53 1 |
| NGC 5033 | 351 | 66 | 353 2 | 71 2 |
| NGC 7793 | 264 | 53 | 277 3 | 47 9 |

6 Discussion
In this paper, the rotation curves given in Appendix C were obtained from the kinematical parameters derived using tilted–ring models which assume pure circular motions. Even if we tried to avoid the zones obviously affected by non–circular motions, there is still considerable work needed to extract rotation curves that are truly representative of the mass distribution, and can be used for mass modeling purposes. This is especially true for barred systems, which account for about one third of the galaxies in Table 1.
The idea behind obtaining an accurate determination of the gravitational potential is correlated with the dark halo modeling. For instance, there has been significant debate about the shape of dark matter density profiles, especially regarding their inner slope. Based on cosmological N–body simulations (Navarro et al. 1996, 1997, hereafter collectively NFW), the dark matter halo profile appears to be independent of halo mass with an inner logarithmic slope equal to . Nevertheless, recent higher resolution simulations suggest that the density profiles do not converge to a single power law at small radii. At the smallest resolved scales (0.5% of the virial radius), profiles usually have slopes between –1 and –1.5 (Moore et al. 1999; Ghigna et al. 2000; Jing & Suto 2000; Fukushige & Makino 2001; Klypin et al. 2001; Power et al. 2003; Navarro et al. 2004; Diemand et al. 2004).
In addition, all simulations find density profiles that are inconsistent with the isothermal profile found in observations. In the outer regions, the determination of the dark halo slope based on mapping the outer density profile of galaxies is difficult, owing mainly to a lack of mass tracers at large radii. In the inner regions, the unknown value of the stellar mass–to–light ratio further complicates the determination of the mass distribution. This has led to dedicated analysis on dwarf and low surface brightness (LSB) galaxies that are believed to be dark matter dominated at all radii (de Blok & McGaugh 1997; Verheijen 1997; Swaters 1999). It has been suggested that rotation curves of dwarf and LSB galaxies rise less steeply than predicted by numerical simulations based on the cold dark matter (CDM) paradigm (Moore 1994; Flores & Primack 1994; de Blok & McGaugh 1997; McGaugh & de Blok 1998; de Blok et al. 2001a, 2001b).
However, a number of observational uncertainties cast doubt over these early claims. These include beam smearing for HI rotation curves (Swaters et al. 2000; van den Bosch et al. 2000), high inclination angles and H long–slit alignment errors (Swaters et al. 2003a), and non–circular motions close to the center of galaxies (Swaters et al. 2003b). Many of these uncertainties can be quantified or eliminated by measuring high–resolution two–dimensional velocity fields (Barnes et al. 2004). At optical wavelengths, these can be obtained via Fabry–Perot interferometry (e.g., Blais–Ouellette et al. 1999) or integral field spectroscopy (e.g., Andersen & Bershady 2003; Courteau et al. 2003).
There are ways to extract the true kinematics that reflect the gravitational potential. One is to derive the potential directly from the 2D velocity field or the 3D data cube (this is work in preparation). The other way is to derive the bar parameters using the Spitzer images, compare with numerical simulations, and apply the necessary corrections for, e.g. the streaming motions induced by the bars (see Hernandez et al. 2005b; Perez, Fux & Freeman, 2004). This detailed work will be done in another paper (Hernandez et al. 2007 in preparation), but we can illustrate what needs to be done by using three of the barred systems in our sample.
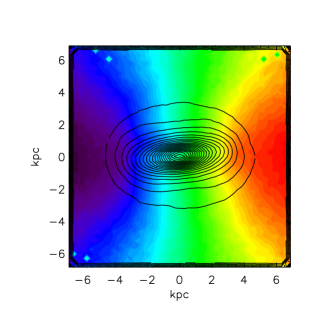
The galaxy NGC 3351, better known as Messier 95, is a SBb galaxy, member of the Leo group. Situated at a distance of 9.3 Mpc, this starburst galaxy has a large–scale stellar bar which has a deprojected value of 47″ for the semi–major axis (Martin, 1995). Outside this bar, the H velocity field is fairly regular and the kinematical PA and inclination found by GIPSY agree well with the photometric values. Thus, the gas outside the bar is thought to be in circular orbits so that the rotation curve represents accurately the kinematics of this galaxy. The small deviations from circular motions are due to streaming along the inner ring. The H rotation curve shows a more or less constant velocity beginning at the end of the stellar bar with peaks corresponding to the 70″ inner ring. Figure 2 displays the tilted–ring model results and one can see, outside the bar, the fairly regular values for the position angle and inclination as a function of the radius.

However, inside the large–scale bar, the H velocity field shows the perturbed kinematics expected for this barred system. The twisted isovelocity contours indicate that a pure circular rotation model will present a poor fit to the data and hence kinematical information extracted in this region will be incorrect. This is illustrated in Figure 2 where the filled circles represent the values computed in the bar region. It is thus imperative to take into account the bar location when deriving kinematical parameters.
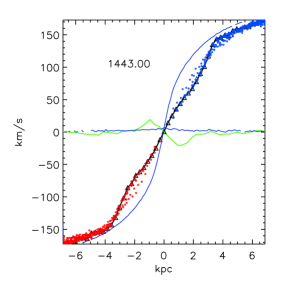
Furthermore, bar modeling is crucial in order to properly compute the rotation curve in this region. Numerical computations were performed with GADGET, a tree–based N–bodySPH code developed by Springel, Yoshida & White (2001). For the needs of the simulations, an initial stellar population is set up to reproduce a disc galaxy with an already formed bulge. The initial positions and velocities of the stellar particles are drawn from a superposition of two axisymmetric Miyamoto–Nagai discs (Miyamoto & Nagai 1975) of mass respectively and M☉, of scale lengths respectively and kpc and common scale height of kpc. Velocity dispersions are computed solving numerically the Jeans equations. The total number of stellar particles is 1.1 . The run includes a dark halo made of 2.2 live particles distributed in a Plummer sphere of scalelength kpc and of mass respectively 2.42 and 6.46 M☉. The total mass of the gas is 0.11 M☉. Finally, the total mass of the simulated galaxy is 7.67 M☉.
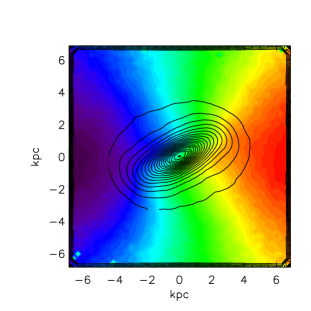
Numerical simulations of the kinematical effect of the bar are shown in Figure 3. The input model for the galaxy is pure rotation and the corresponding rotation velocities along the major and minor axis are shown in faint blue and green lines. Afterwards, the code simulates galaxy evolution where a bar is developing. The difference in orientation between the major axis and the bar corresponds to different evolving times which are given in units of millions years. For NGC 3351, the kinematical PA (∘) is almost perpendicular to the bar, with ∘ using the value found by Menéndez–Delmestre et al. (2007). The results of the simulations are shown in the form of RV maps and stellar densities superposed. For an 80∘ difference between the major axis and the bar PAs, the overall effect is an artificial increase in the velocity gradient. This can be explained by gas moving along x1 orbits (parallel to the bar) where the velocity is greater at the perigalacticon (near the center) than at the apogalacticon (near the end of the bar). The true kinematics of this galaxy will therefore be obtained by correcting this artificial increase in the velocity gradient. Until then, rotation velocities inside the bar region are not given for the final rotation curve. See the galaxy description in Appendix A for additional evidences of non–circular motions.
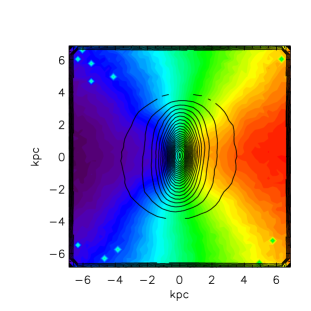
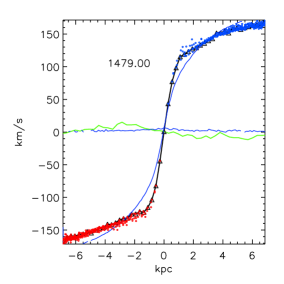


Another galaxy displaying a perturbed velocity field is NGC 337. This asymmetric SBd galaxy features an off–center stellar bar having a PA of 162∘ and a deprojected value of 35″ for the bar semi–major axis (Menéndez–Delmestre et al., 2007). Since the photometric major axis of this galaxy is 130∘, the bar has an intermediate orientation with respect to the major axis. Numerical simulations have been done for this bar position and the results are illustrated in the middle panel of Figure 3. The simulated velocity field displays the characteristic Z–shape of the isocontours similar to what is seen in the H velocity map. One characteristic is the velocity gradient along the minor axis (green line in Figure 3). Another feature is the relative agreement between the input rotation velocities (faint blue line) and the computed ones (triangle symbols show averaged red and blue points calculated using the method presented in section 4). The rotation curve in the bar region is thus provided for this galaxy since these perturbations are confined to the minor axis which is excluded from the fit. The tilted–ring model for this galaxy, presented in Figure 4, illustrates the small differences for the fitted values between the bar region (filled circles) and spiral arms (open circles).
After having completed the kinematical fitting procedure, one can look at the Spitzer IRAC 3.6m image in order to compare the bar location with the velocity residuals. Since the eastern side is approaching and the western side is receding, the spiral arms seem to be trailing in an anti–clockwise direction. The velocity residuals from the pure circular rotation model indicate positive residuals east of the bar as well as negative residuals on the southern end of the bar, suggesting an inflow of gas towards the bar.
Two other barred galaxies having a bar orientation intermediate to the major axis are NGC 1566 and NGC 3627, but their Seyfert activity and warped disc respectively make difficult the kinematical analysis regarding the effects of the bar. Their rotation curves are provided at the end of this paper.

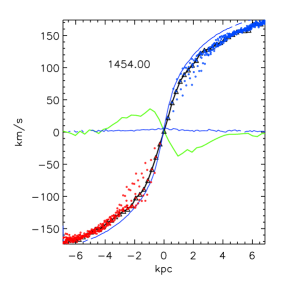
Finally, the last barred system discussed in this paper is NGC 4559, an SABcd galaxy having a small bar roughly aligned with the major axis ( 340∘ vs ∘). Numerical simulations have been done for a bar parallel to the major axis and are presented in the bottom panel of Figure 3. The small velocity gradient seen in the PV diagram and in the rotation curve is in agreement with the predicted behavior seen in the simulation. The rotation velocities are artificially lowered by the radial motions in the bar, resulting in an underestimation of the luminous mass in the central regions. It is thus vital to model the bar in order to determine the accurate mass distribution. The radial mass distribution of the gas was analyzed between the 3 time steps to verify that modifications of the inner part of the rotation curve was not an effect of migration of the gas during the run.
Further bar modeling enables the bar length to be calculated. Using the Fourier moment analysis on azimuthal profiles derived using J and K 2MASS images (see Aguerri, Beckman, & Prieto 1998 and Aguerri et al. 2000), the deprojected value for the bar semi–major axis is ″. For example, the tilted–ring model for NGC 4559 shows that it is difficult to assess which radii are affected by the bar (see Figure 5). However, the H velocity field displays streaming motions outside the bar as well, therefore the velocities are perturbed to at least a radius of 40″. Deriving the form of the gravitational potential directly from 2D kinematics and/or using numerical simulations of the bar, are thus essential to perform in order to study properly the mass distribution and solve the dark halo density profile inconsistencies.
7 Conclusions
We have presented in this paper the second and last part of the H kinematics follow–up survey of the Spitzer Infrared Nearby Galaxies Survey (SINGS) sample. The goal of this kinematical follow up is to better understand the role of baryons and of the dark/luminous matter relation in star forming regions of galaxies. The shape of the velocity field in the central galactic regions, drawn through its H component, is indeed directly related to the baryonic luminous disk and the star formation processes. The SINGS sample will provide a unique opportunity to link the kinematics with numerous observations and studies at other wavelengths.
The data have been obtained from high resolution Fabry–Perot observations using the FaNTOmM camera and a L3CCD detector. The SINGS sample of galaxies has been observed at the OmM 1.6m telescope, ESO La Silla 3.6m telescope, CFHT 3.6m telescope, and WHT 4.2m telescope. The velocity fields were obtained by using a data reduction pipeline written in IDL and the rotation curves were computed by the rotcur task from the GIPSY software. When fitting the kinematical parameters, care was taken to avoid the zones obviously affected by non–circular motions. However, we have demonstrated that for barred systems, different bar characteristics considerably modify the central velocity gradient of the computed rotation curves in the pure circular rotation hypothesis. Therefore, numerical modeling of barred galaxies is crucial in order to extract rotation curves that are truly representative of the gravitational potential and hence of the mass distribution in those galaxies. In the meantime, the dark matter distribution of the SINGS galaxies, using the rotation curves derived here, will be presented in a forthcoming paper.
Not only will these observations provide the high spatial resolution data needed for constraining the dark matter density profiles of galaxies, but they will be helpful for studying these profiles as a function of morphological type. Furthermore, they will help to delineate the role of gas kinematics in regulating the star formation rate. For instance, Palouš, Ehlerova, & Elmegreen (2002) have argued that the probability of collapse of molecular clouds leading to star formation is greatly enhanced in slowly rotating gas discs compared to high velocity rotation. Moreover, Chemin et al. (2003) and Fathi et al. (2007) have suggested that the star forming inner and nuclear rings in the nearby galaxies NGC 3627 and NGC 628 (respectively) are driven by a rotating asymmetry because their location in the host disk are in agreement with Lindblad resonances caused by a bar pattern speed. Gas dynamical processes therefore are important in regulating the star formation history of galaxies and the H kinematics presented in this paper will help understanding the star formation processes.
Acknowledgments
We would like to thank Jacques Boulesteix, Jean–Luc Gach, Philippe Balard and Olivier Boissin for helping with the instrumentation and part of the observations and the staff of the four Observatories, where the data were obtained, for their continuing support. The William Herschel Telescope is operated on the island of La Palma by the Isaac Newton Group in the Spanish Observatorio del Roque de los Muchachos of the Instituto de Astrofisica de Canarias. We acknowledge support from the Natural Sciences and Engineering Research Council of Canada and the Fonds Québécois de la recherche sur la nature et les technologies. The Digitized Sky Surveys (DSS images) were produced at the Space Telescope Science Institute under U.S. Government grant NAG W–2166. The images of these surveys are based on photographic data obtained using the Oschin Schmidt Telescope on Palomar Mountain and the UK Schmidt Telescope. The plates were processed into the present compressed digital form with the permission of these institutions. The IR images were obtained by the Spitzer Space Telescope, which is operated by the Jet Propulsion Laboratory, California Institute of Technology under a contract with NASA.
References
- Afanasiev & Sil’chenko (1999) Afanasiev V. L., Sil’chenko O. K., 1999, AJ, 117, 1725
- Afanasiev & Sil’chenko (2005) Afanasiev V. L., Sil’chenko O. K., 2005, A&A, 429, 825
- Agüero, Díaz, & Bajaja (2004) Agüero E. L., Díaz R. J., Bajaja E., 2004, A&A, 414, 453
- Aguerri, Beckman, & Prieto (1998) Aguerri J. A. L., Beckman J. E., Prieto M., 1998, AJ, 116, 2136
- Aguerri et al. (2000) Aguerri J. A. L., Muñoz-Tuñón C., Varela A. M., Prieto M., 2000, A&A, 361, 841
- Barbieri et al. (2005) Barbieri C. V., Fraternali F., Oosterloo T., Bertin G., Boomsma R., Sancisi R., 2005, A&A, 439, 947
- Blais–Ouellette, Amram, & Carignan (2001) Blais–Ouellette S., Amram P., Carignan C., 2001, AJ, 121, 1952
- Bohuski et al. (1972) Bohuski T. J., Burbidge E. M., Burbidge G. R., Smith M. G., 1972, ApJ, 175, 329
- Boissier et al. (2003) Boissier S., Prantzos N., Boselli A., Gavazzi G., 2003, MNRAS, 346, 1215
- Boselli et al. (2001) Boselli A., Gavazzi G., Donas J., Scodeggio M. 2001, AJ, 121, 753
- Bosma (1981) Bosma A., 1981, AJ, 86, 1791
- Braun, Walterbos, & Kennicutt (1992) Braun R., Walterbos R. A. M., Kennicutt R. C., Jr., 1992, Natur, 360, 442
- Bridges et al. (1997) Bridges T. J., Ashman K. M., Zepf S. E., Carter D., Hanes D. A., Sharples R. M., Kavelaars J. J., 1997, MNRAS, 284, 376
- Bureau & Carignan (2002) Bureau M., Carignan C., 2002, AJ, 123, 1316
- Burstein, Krumm, & Salpeter (1987) Burstein D., Krumm N., Salpeter E. E., 1987, AJ, 94, 883
- Buta (1988) Buta R., 1988, ApJS, 66, 233
- Carignan & Beaulieu (1989) Carignan C., Beaulieu S., 1989, ApJ, 347, 760
- Carignan & Freeman (1988) Carignan C., Freeman K. C., 1988, ApJ, 332, L33
- Carignan & Puche (1990) Carignan C., Puche D., 1990, AJ, 100, 394
- Carignan & Purton (1998) Carignan C., Purton C., 1998, ApJ, 506, 125
- Carignan et al. (2007) Carignan C., Hernandez O., Beckman J. E., Fathi K., 2007, arXiv, 705, arXiv:0705.4093
- Carter & Jenkins (1993) Carter D., Jenkins C. R., 1993, MNRAS, 263, 1049
- Cayatte et al. (1990) Cayatte V., van Gorkom J. H., Balkowski C., Kotanyi C., 1990, AJ, 100, 604
- Chemin et al. (2003) Chemin L., Cayatte V., Balkowski C., Marcelin M., Amram P., van Driel W., Flores H., 2003, A&A, 405, 89
- Chemin et al. (2006a) Chemin L., et al., 2006a, MNRAS, 366, 812
- Chemin et al. (2006b) Chemin L., Carignan C., Drouin N., Freeman K. C., 2006b, AJ, 132, 2527
- Haynes, Giovanelli, & Kent (2007) Haynes M. P., Giovanelli R., Kent B. R., 2007, ApJ, 665, L19
- Colina et al. (1997) Colina L., Garcia Vargas M. L., Mas–Hesse J. M., Alberdi A., Krabbe A., 1997, ApJ, 484, L41
- Daigle et al. (2004) Daigle O., Gach J.–L., Guillaume C., Carignan C., Balard P., Boisin O., 2004, SPIE, 5499, 219
- Daigle et al. (2006a) Daigle O., Carignan C., Amram P., Hernandez O., Chemin L., Balkowski C., Kennicutt R., 2006a, MNRAS, 367, 469
- Daigle et al. (2006b) Daigle O., Carignan C., Hernandez O., Chemin L., Amram P., 2006b, MNRAS, 368, 1016
- Daigle, Carignan, & Blais–Ouellette (2006) Daigle O., Carignan C., Blais–Ouellette S., 2006, SPIE, 6276,62761F
- de Blok & Walter (2000) de Blok W. J. G., Walter F., 2000, ApJ, 537, L95
- Devereux, Kenney, & Young (1992) Devereux N. A., Kenney J. D., Young J. S., 1992, AJ, 103, 784
- Dumas et al. (2007) Dumas G., Mundell C., Emsellem E., Nagar N., 2007, arXiv, 705, arXiv:0705.4162
- Elfhag et al. (1996) Elfhag T., Booth R. S., Hoeglund B., Johansson L. E. B., Sandqvist A., 1996, A&AS, 115, 439
- Fathi et al. (2006) Fathi K., Storchi–Bergmann T., Riffel R. A., Winge C., Axon D. J., Robinson A., Capetti A., Marconi A., 2006, ApJ, 641, L25
- Fathi et al. (2007) Fathi K., Beckman, J. E., Zurita, A., Relano, M., Knapen, J. H., Daigle, O., Hernandez, O., Carignan, C., 2007, A&A, 466, 905
- Gach et al. (2002) Gach J.–L., et al., 2002, PASP, 114, 1043
- Gerin, Combes, & Nakai (1988) Gerin M., Combes F., Nakai N., 1988, A&A, 203, 44
- Golla, Dettmar, & Domgoergen (1996) Golla G., Dettmar R.–J., Domgoergen H., 1996, A&A, 313, 439
- Gooch (1996) Gooch R. E., 1996, ASPC, 101, 80
- Gordon (1991) Gordon M. A., 1991, ApJ, 371, 563
- Hägele et al. (2007) Hägele G. F., Díaz Á. I., Cardaci M. V., Terlevich E., Terlevich R., 2007, MNRAS, 378, 163
- Hawarden et al. (1979) Hawarden T. G., van Woerden H., Goss W. M., Mebold U., Peterson B. A., 1979, A&A, 76, 230
- Haynes et al. (2007) Haynes M. P., Giovanelli R., Kent B. R. 2007, ApJ, 665, 19
- Helfer et al. (2003) Helfer T. T., Thornley M. D., Regan M. W., Wong T., Sheth K., Vogel S. N., Blitz L., Bock D. C.–J., 2003, ApJS, 145, 259
- Hernandez et al. (2003) Hernandez O., Gach J.–L., Carignan C., Boulesteix J., 2003, SPIE, 4841, 1472
- Hernandez et al. (2005a) Hernandez O., Carignan C., Amram P., Chemin L., Daigle O., 2005a, MNRAS, 360, 1201
- Hernandez et al. (2005b) Hernandez O., Wozniak, H., Carignan C., Amram P., Chemin L., Daigle O., 2005b, ApJ, 632, 253
- Hoffman et al. (1993) Hoffman G. L., Lu N. Y., Salpeter E. E., Farhat B., Lamphier C., Roos T., 1993, AJ, 106, 39
- Hota & Saikia (2005) Hota A., Saikia D. J., 2005, MNRAS, 356, 998
- Jeong et al. (2007) Jeong H., Bureau M., Yi S. K., Krajnović D., Davies R. L., 2007, MNRAS, 376, 1021
- Kennicutt (1989) Kennicutt R. C., Jr., 1989, ApJ, 344, 685
- Kennicutt (1998a) Kennicutt R. C., Jr., 1998a, ARA&A, 36, 189
- Kennicutt (1998b) Kennicutt R. C., Jr., 1998b, ApJ, 498, 541
- Kennicutt et al. (2003) Kennicutt R. C., Jr., et al., 2003, PASP, 115, 928
- Knapp (1987) Knapp G. R., 1987, IAUS, 127, 145
- Kranz, Slyz, & Rix (2001) Kranz T., Slyz A., Rix H.–W., 2001, ApJ, 562, 164
- Lake, Schommer, & van Gorkom (1987) Lake G., Schommer R. A., van Gorkom J. H., 1987, ApJ, 314, 57
- Legrand et al. (1997) Legrand F., Kunth D., Mas–Hesse J. M., Lequeux J., 1997, A&A, 326, 929
- Lequeux et al. (1995) Lequeux J., Kunth D., Mas–Hesse J. M., Sargent W. L. W., 1995, A&A, 301, 18
- Leroy et al. (2005) Leroy A., Bolatto A. D., Simon J. D., Blitz L., 2005, ApJ, 625, 763
- Lindblad & Jorsater (1981) Lindblad P. O., Jorsater S., 1981, A&A, 97, 56
- Martimbeau, Carignan, & Roy (1994) Martimbeau N., Carignan C., Roy J.–R., 1994, AJ, 107, 543
- Martin (1995) Martin P., 1995, AJ, 109, 2428
- Martin & Kennicutt (2001) Martin C. L., Kennicutt R. C., 2001, ApJ, 555, 301
- Mediavilla et al. (2005) Mediavilla E., Guijarro A., Castillo–Morales A., Jiménez–Vicente J., Florido E., Arribas S., García–Lorenzo B., Battaner E., 2005, A&A, 433, 79
- Méndez & Esteban (2000) Méndez D. I., Esteban C., 2000, A&A, 359, 493
- Menéndez–Delmestre et al. (2007) Menéndez–Delmestre K., Sheth K., Schinnerer E., Jarrett T. H., Scoville N. Z., 2007, ApJ, 657, 790
- Meurer, Staveley–Smith, & Killeen (1998) Meurer G. R., Staveley–Smith L., Killeen N. E. B., 1998, MNRAS, 300, 705
- Meurer et al. (2006) Meurer G. R., et al., 2006, ApJS, 165, 307
- Miller (1995) Miller B. W., 1995, ApJ, 446, L75
- Muñoz–Tuñón, Caon, & Aguerri (2004) Muñoz–Tuñón C., Caon N., Aguerri J. A. L., 2004, AJ, 127, 58
- Nakanishi et al. (2007) Nakanishi H., Tosaki T., Kohno K., Sofue Y., Kuno N., 2007, PASJ, 59, 61
- Ondrechen, van der Hulst, & Hummel (1989) Ondrechen M. P., van der Hulst J. M., Hummel E., 1989, ApJ, 342, 39
- Palouš, Ehlerova, & Elmegreen (2002) Palouš J., Ehlerova S., Elmegreen B. G., 2002, Ap&SS, 281, 101
- Pence, Taylor, & Atherton (1990) Pence W. D., Taylor K., Atherton P., 1990, ApJ, 357, 415
- Phookun, Vogel, & Mundy (1993) Phookun B., Vogel S. N., Mundy L. G., 1993, ApJ, 418, 113
- Puche & Carignan (1988) Puche D., Carignan C., 1988, AJ, 95, 1025
- Rand (1994) Rand R. J., 1994, A&A, 285, 833
- Regan et al. (2002) Regan M. W., Sheth K., Teuben P. J., Vogel S. N., 2002, ApJ, 574, 126
- Regan et al. (2006) Regan M. W., et al., 2006, ApJ, 652, 1112
- Rownd, Dickey, & Helou (1994) Rownd B. K., Dickey J. M., Helou G., 1994, AJ, 108, 1638
- Rubin (1994) Rubin V. C., 1994, AJ, 107, 173
- Rubin, Waterman, & Kenney (1999) Rubin V. C., Waterman A. H., Kenney J. D. P., 1999, AJ, 118, 236
- Sanders, Scoville, & Soifer (1991) Sanders D. B., Scoville N. Z., Soifer B. T., 1991, ApJ, 370, 158
- Shopbell & Bland–Hawthorn (1998) Shopbell P. L., Bland–Hawthorn J., 1998, ApJ, 493, 129
- Sofue et al. (1990) Sofue Y., Handa T., Golla G., Wielebinski R., 1990, PASJ, 42, 745
- Summers, Stevens, & Strickland (2001) Summers L. K., Stevens I. R., Strickland D. K., 2001, astro, arXiv:astro-ph/0106475
- Tempel & Tenjes (2006) Tempel E., Tenjes P., 2006, MNRAS, 371, 1269
- Thean et al. (1997) Thean A. H. C., Mundell C. G., Pedlar A., Nicholson R. A., 1997, MNRAS, 290, 15
- van der Hulst & Huchtmeier (1979) van der Hulst J. M., Huchtmeier W. K., 1979, A&A, 78, 82
- van Driel & Buta (1991) van Driel W., Buta R. J., 1991, A&A, 245, 7
- van Driel, Rots, & van Woerden (1988) van Driel W., Rots A. H., van Woerden H., 1988, A&A, 204, 39
- Veilleux & Rupke (2002) Veilleux S., Rupke D. S., 2002, ApJ, 565, L63
- Vogelaar & Terlouw (2001) Vogelaar M. G. R., Terlouw J. P., 2001, ASPC, 238, 358
- Walsh et al. (1990) Walsh D. E. P., van Gorkom J. H., Bies W. E., Katz N., Knapp G. R., Wallington S., 1990, ApJ, 352, 532
- Walter, Weiss, & Scoville (2002) Walter F., Weiss A., Scoville N., 2002, ApJ, 580, L21
- Walter et al. (2007) Walter F., et al., 2007, ApJ, 661, 102
- Wong & Blitz (2000) Wong T., Blitz L., 2000, ApJ, 540, 771
- Zhang, Wright, & Alexander (1993) Zhang X., Wright M., Alexander P., 1993, ApJ, 418, 100
Appendix A Description of the individual galaxies
NGC 24: This galaxy is in the background of the Sculptor Group of galaxies (Puche & Carignan, 1988). The tilted–ring model fitted to the velocity field gives a mean inclination of 75 3°, which is consistent with the photometric inclination but not with the HI kinematical inclination of 64 3° derived in Chemin et al. (2006b). As previously noticed by these authors, the low resolution HI data likely highly underestimates the inclination. A more detailed description and analysis of our H data for this low surface brightness galaxy will be presented in a forthcoming article (Chemin et al. 2007, in prep.).
NGC 337: The spiral arms of this barred galaxy are easily visible in the H integrated map. The velocity field shows a central Z–shape of the velocities indicating that a strong disturbance caused by the bar. See more details in section 6.
NGC 855: Not only bright H emission can be seen in this dwarf elliptical galaxy, but CO emission has also been detected and star formation is an ongoing process (Nakanishi et al., 2007). The HI gas distribution is extended but the corresponding mass is much smaller than for spirals (Walsh et al., 1990).
NGC 1097: This large SBb galaxy exhibits a bright circumnuclear ring with an associated steep velocity gradient. Radial streaming motions from the nuclear ring to the galactic center and a nuclear spiral are believed to be part of a mechanism by which gas is fueled to the supermassive black hole (Fathi et al., 2006). Those large streaming motions are most likely responsible for the steep velocity gradient (up to nearly 300 km s-1, see Fig. C1) seen toward the center. The PA of the bar is aligned with both the galaxy’s PA and companion, NGC 1097 A. The HI gas is distributed fairly symmetrically in the prominent spiral arms and in the bar. Non–circular motions are found in and around the bar as shown by the S–shape distortion of the HI velocities and the spiral arms display large streaming motions indicating the presence of strong density waves (Ondrechen, van der Hulst, & Hummel, 1989). CO emission is detected mostly in the nuclear ring and the high inferred mass can be explained by the secular action of the bar enhanced by the interaction with NGC 1097 A (Gerin, Combes, & Nakai, 1988).
NGC 1291: This early–type galaxy does not have enough detected ionized gas for detailed kinematical mapping. In fact, only nine HII regions distributed in a ring–like structure can be seen in the H monochromatic and RV maps. The velocity range corresponding to these HII regions (835–855 km s-1) is comparable to what is seen in HI observations, where the gas is distributed in a bright ring surrounding a large central hole devoid of gas (van Driel, Rots, & van Woerden, 1988), typical of what is seen in the bulge–dominated region of most early–type galaxies. The HI velocity field of this face–on galaxy looks quite regular and the associated rotation curve is essentially flat.
NGC 1482: The H distribution of this early–type galaxy displays a bright central emission region and an eastern blob of H emission. The measured velocity dispersion of the lines in the central region (some with km s-1) is consistent with the gas being ejected from the center. H and [NII] images by Veilleux & Rupke (2002) revealed a galactic wind shaped like an hourglass extending above and below the plane of the galaxy. Both H and HI observations show two bright blobs of emission located on either side of the disc that are rotating about the center of the galaxy (Hota & Saikia, 2005). The CO global profile presents a blueshifted component which is narrower and weaker than the redshifted one (Sanders, Scoville, & Soifer, 1991).
NGC 1512: This strongly barred galaxy hosts two rings inside the bar, a nuclear ring with strong H emission and large velocity gradient and an inner ring located at the end of the bar with weak emission compared to the nuclear ring. The PA of the nuclear ring is not perfectly aligned with those of the outer ring and bar and the nuclear ring is off–centered with respect to the inner ring. This H morphology is consistent with that presented by Buta (1988). Their rotation model shows that the nuclear ring must be expanding at a significant velocity (see also Lindblad & Jorsater 1981). This galaxy is likely to be gravitationally interacting with its neighbor NGC 1510, as shown by the perturbed HI velocity field (Hawarden et al., 1979). It is worth also mentioning the presence of very extended tidal arms in H and in UV, outside our FOV (Meurer et al., 2006).
NGC 1566: The spiral arms of this grand–design galaxy are well traced in the 3.6 m and monochromatic images. Inside the 20″ radius lies intense Doppler broadening typical of a Seyfert I galaxy but too strong to be sampled by the free spectral range of the FP interferometer used for our observations. Also, there is an expanding bubble of gas located near , associated with four strong HII regions in the northwest arm and exhibiting a strong velocity gradient. These results are consistent with the H observations made by Pence, Taylor, & Atherton (1990). See Agüero, Díaz, & Bajaja (2004) for a dynamical analysis based on long–slit spectroscopy.
NGC 1705: This peculiar galaxy shows a rotating disc that is dominated by an intense ongoing starburst. Therefore, no kinematical parameters could be extracted. The double profiles and multiple arcs of material visible in H suggest indeed violent ejections of gas. In contrast, HI synthesis observations revealed a rotating disc in a dominant dark matter halo (Meurer, Staveley–Smith, & Killeen, 1998).
Holmberg II: The H content of this irregular galaxy shows weak rotation and a lack of spatial coverage, therefore no kinematical parameters or rotation curve could be extracted. Besides, the neutral gas appears compressed on the southeast with a large but faint component extending on the opposite side, indicating ram pressure stripping from the intergalactic medium (Bureau & Carignan, 2002). The HI velocity field displays a weak but clear rotating disc pattern. Like most of the dwarfs (see e.g. Carignan & Purton, 1998), there is more luminous mass in HI than in stars, but contrary to most dwarfs where dark matter dominates at nearly all radii, in HoII, dark matter dominates only in the outer parts of the galaxy like in massive spirals.
DDO 053: This dwarf irregular galaxy has some diffuse H but since our observations have little spatial coverage, no kinematical parameters are given for this galaxy. The HI distribution is compact and shows two peaks of emission with one peak being associated with the brighter region visible in H (Walter et al., 2007).
NGC 2841: The velocity field of this fast–rotating galaxy does not show any sign of perturbation. The radial velocities inside a 50” radius are not mapped in this H study because of Doppler broadening of the line typical of Seyfert 1 galaxies. Inside the 50” radius, H and [NII] images by Afanasiev & Sil’chenko (1999) seem to suggest that the excitation of the ionized gas is caused by shock–wave fronts. Little CO is seen in this galaxy (Helfer et al., 2003).
Holmberg I: This dwarf galaxy has very little H emission and the associated velocity field shows weak rotation. The HI morphology is characterized by one giant hole enclosed by a ring–like structure. The south side of the HI ring is located so that it encloses the H emission (Walter et al., 2007).
NGC 3034 (M82): This starburst galaxy is seen nearly edge–on and the opacity of the gas renders impossible the extraction of the kinematical parameters. The almost hourglass shape of the H distribution and the presence of double profiles above and below the disc indicates a remarkable outflow of gas perpendicular to the plane of the galaxy. Line–splitting is also found in CO observations of the outflow and an estimated 10 percent of the gas may be lost to the intergalactic medium (Walter, Weiss, & Scoville, 2002). The FP data presented here agree reasonably well with those of Shopbell & Bland–Hawthorn (1998), particularly the strong redshifting and blueshifting seen north and south of the disc respectively. The differences in velocity between the two FP data sets are mainly due to the high interference order of our Fabry–Perot etalon which is designed for smaller radial velocity range and higher spectral resolution. Fast ejection of material is seen in the H velocity field, splitting the H line by km s-1.
Holmberg IX: There is no H emission originating from this galaxy. However, an expanding bubble of gas can be seen 2′ northeast of Holmberg IX. This large supershell ( pc) is thought to be one of the most X–ray luminous supernova remnants (SNRs) (Miller, 1995). The position, velocity, and abundance similarities between Holmberg IX and the superbubble suggest that they are related.
NGC 3190: This early–type galaxy has very little H. A close companion lies just 5″ northwest and both galaxies are in interaction. No kinematical parameters are given for this peculiar galaxy.
IC 2574: The H integrated map of this dwarf spiral galaxy presents several supershells as well as large arc–like shaped HII complexes indicating gas compressed by powerful star–forming events. The kinematics yields a slowly rising rotation curve until a value of V km s-1 is reached (Blais–Ouellette, Amram, & Carignan, 2001). Mass modeling using the HI rotation curve from Martimbeau, Carignan, & Roy (1994) yields a dark matter contribution of 90% which dominates at all radii. The HI morphology is characterized by holes and several of the H regions are located around the rims of the HI holes. Finally, Leroy et al. (2005) have detected molecular gas in this star–forming galaxy.
NGC 3265: This dwarf elliptical galaxy has a small rotating H disc of radius ″ in agreement with 21–cm line observations. The HI rotation curve rises steeply until r = 20″ then goes flat and the RV map shows presence of non–circular motions or warping (Lake, Schommer, & van Gorkom, 1987). Since, for the few elliptical galaxies detected in HI, the gas content is not correlated with luminosity and the spatial distribution is not reminiscent of that found in spiral galaxies, the origin of the gas is thought to be external (Knapp, 1987). Molecular gas is detected in this elliptical galaxy and star formation is an ongoing process in the centre (Gordon, 1991). Both CO and HI profiles have half–intensity widths of km s-1.
Mrk 33: The H emission of this dwarf starburst galaxy, also known as Haro 2, reveals at least two star–forming regions in the galactic centre and the overall kinematics resemble a luminous oblong expanding shell. A more in–depth observation by Méndez & Esteban (2000) has shown three bright H knots and faint filamentary structures. The presence of an extended X–ray emitting region lying within the supershell suggests a superbubble caused by a starburst–driven outflow (Summers, Stevens, & Strickland 2001, Legrand et al. 1997, Lequeux et al. 1995). No kinematical parameters are given for this galaxy.
NGC 3351 (M95): The H distribution in this barred galaxy shows a luminous centre with an H ring and the corresponding velocity field presents evidence of strong non–circular motions in the centre. Kinematics inside this region reveal that the stellar bar is radially driving gas towards the star forming H ring at V = 25 km s-1(Hägele et al., 2007), from elongated x1 orbits to the x2 orbits closer to the bar. Furthermore, the detected excess in the central ISM content of the large–scale bar implies that the latter is transporting gas to smaller radii (Regan et al., 2006). Interestingly, CO observations have shown a small molecular bar aligned perpendicular to the large scale stellar bar (Helfer et al. 2003, Devereux, Kenney, & Young 1992). The earlier paper argues that a resonance caused by the stellar bar lies in the vicinity of the H ring and nuclear molecular gas bar. The velocity gradient in the central regions is steep in both CO and H data. There is also an inner ring at the end of the bar where the velocities are regular and not perturbed. Another H kinematical analysis has been done for this galaxy by Buta (1988). Finally, two nuclear spiral arms residing inside the circumnuclear ring can be seen in Spitzer IRAC 3.6m data.
NGC 3627 (M66): This member of the Leo triplet shows a highly perturbed H morphology and velocity field. Streaming motions can be seen along the spiral arms and a warp can be fitted on the southern, receding side of the disc. The H kinematics is consistent with CO and HI data obtained by Helfer et al. (2003) and Regan et al. (2002) respectively. A molecular and H ring has been found lying at the position of the ultra–harmonic resonance induced by the bar pattern speed (Chemin et al., 2003). The proposed explanation for the asymmetric and perturbed gas morphology is a tidal interaction with NGC 3628 (Afanasiev & Sil’chenko (2005); see also Zhang, Wright, & Alexander (1993)).
NGC 3773: Visible in both H and HI data, this early–type galaxy displays gas concentration in its centre. There is no detectable rotation and the global profile is very narrow, both for the ionized and neutral gas (Burstein, Krumm, & Salpeter, 1987).
NGC 4254(M99): The kinematical analysis of this grand design spiral galaxy has already been presented in the Virgo galaxy cluster sample of Chemin et al. (2006a). The H velocity field presents significant streaming motions along the spiral structure. Recent observations by Haynes et al. (2007) reported an HI tail extending 250 kpc to the North of NGC 4254, perhaps the result of galaxy harassment as the galaxy enters the Virgo cluster.
NGC 4450: The Fabry–Perot data of this anemic galaxy have been presented in Chemin et al. (2006a). The H distribution is very clumpy and the velocity field perturbed in the innermost regions of the galaxy. A new tilted–ring model is fitted to the velocity field using rings of 4″ width instead of 2″ in our previous analysis. This allows one to derive a new major axis position angle of 3535° with a smaller error bar than in Chemin et al. (2006b). The values remain in agreement within the errors.
NGC 4559: The H velocity field of this late–type galaxy shows the presence of streaming motions in its centre and is somewhat patchy far from the centre. The HI disc, extending further out than the optical disc, is warped and lopsided in both distribution and kinematics (Barbieri et al., 2005). Their HI PV diagram revealed the presence of a thick HI layer rotating 25–50 km s-1 more slowly than the value for the thin disc.
NGC 4594 (M104): This early–type galaxy is better known as the Sombrero galaxy. The H observations display only one diffuse ionized region west of the nearly edge–on disc and the corresponding radial velocities are in agreement with the galaxy’s systemic velocity. Stellar kinematics reveal for the rotation curve a rapid rise followed by a decrease which can be explained by the prominent galactic bulge (Carter & Jenkins, 1993). Mass modeling using globular cluster kinematics has shown that the value increases with radius, hence that M104 has a dark matter halo (Bridges et al., 1997). Another study of the dark matter distribution has been done by Tempel & Tenjes (2006).
NGC 4631: This galaxy is seen edge–on and its inclination renders impossible the extraction of the kinematical parameters. The interaction with the nearby dwarf galaxy is thought to be responsible for the warp seen on the southeast side of the H velocity field. Our H results are consistent with those of Golla, Dettmar, & Domgoergen (1996). As for the HI data, the results obtained by Rand (1994) show that the maximum rotation velocity is 140 km s-1and that the HI disc can be modeled as having two distinct velocity components. CO observations have demonstrated that the sources of these distinct velocities are the spiral arms within the gas disc (Sofue et al., 1990).
NGC 4736 (M94): This ringed galaxy exhibits a bright inner ring with a nearly constant rotational velocity of about 195 km s-1. The dispersion velocities are typical of those seen in HII regions. The location of this H ring is consistent with resonances caused by the bar and by a larger oval distortion. CO observations reveal tightly wound spiral arms separated by a small nuclear bar that is perpendicular to the major axis PA of the galaxy (Helfer et al., 2003) as well as gas moving on elliptical orbits around the nuclear bar. Modeling of H and CO kinematics shows an inflow of material near the ends of the nuclear bar, an outflow between the bar and the ring, and an inflow of gas just outside the ring (Muñoz–Tuñón, Caon, & Aguerri 2004, Wong & Blitz 2000). The slightly declining H rotation curve presented in this paper is consistent with CO and HI observations, but not in the central regions.
DDO 154: This dwarf irregular galaxy has only a few discrete HII regions and larger diffuse regions. The H velocity field shows large–scale but slow rotation ( km s-1) that can be measured to just below 2′. The 21–cm HI observations present a regular but extended gas disc having a slight warp at the southwest end (Hoffman et al. 1993, Carignan & Beaulieu 1989). Mass modeling of this galaxy reveals that more than 90% of the mass is found in the dark component (Carignan & Purton 1998, Carignan & Freeman 1988).
NGC 4826 (M64): The H distribution of this galaxy, confined to the inner disc, is more extended on the northwest receding side than on the approaching side, which is consistent with CO emission (Helfer et al., 2003). The HI gas, on the other end, extends far beyond the optical radius and is also distributed asymmetrically. The HI velocity field reveals a counter–rotating gaseous disc outside the 2′ diameter (Braun, Walterbos, & Kennicutt, 1992). A detailed kinematical study, based on H long–slit spectroscopy, reveals a transition region near the prominent dust lane (50′′r70′′) where the gas motion is undergoing a change in its orbital direction, from prograde in the inner disc to retrograde in the outer disc (Rubin, 1994). This situation, symptomatic of a merger, has been widely seen in elliptical galaxies, but rarely in disc galaxies.
DDO 165: The H map of this dwarf galaxy presents only four HII regions that may not be all physically related to the galaxy. The HI distribution is extended and is somewhat arc–like shaped (Walter et al., 2007).
NGC 5033: The H velocity field displays a strong velocity gradient ( km s-1per kpc) in the centre of this galaxy, agreeing with CO emission (Helfer et al., 2003). The broad profiles found near the centre of the galaxy are characteristic of a Seyfert galaxy. [OIII] and H observations show respectively an asymmetric morphology and an off–centered active nucleus which can be understood in terms of a past merger (Mediavilla et al., 2005). The HI large–scale velocity field is well ordered and streaming motions can be seen near the spiral structures (see Thean et al. 1997 and Bosma 1981). The H and HI rotation curves present a constant rotational velocity of km s-1 and a warp developing beyond the optical disc.
NGC 5408: This irregular galaxy has a highly asymmetric H morphology with a bright nuclear region situated at one end of an elongated optical distribution. The FP observations are in agreement with those of Bohuski et al. (1972). The absence of large–scale motions is the reason why no kinematical parameters are given for this galaxy.
NGC 5474: The H distribution of this peculiar galaxy is composed of several HII regions and clumpy diffuse ionized gas which are rotating weakly. The HI disc also displays a clumpy but fairly symmetric distribution. The HI velocity field exhibits normal differential rotation but warping near the edge of the HI disc can be seen (Rownd, Dickey, & Helou 1994, see also van der Hulst & Huchtmeier 1979).
NGC 6822: This nearby irregular galaxy does not exhibit strong rotation within the FOV of our observations, while some is seen in the HI data (de Blok & Walter, 2000). The H emission is composed of HII regions and low density regions of diffuse ionized gas. The HI distribution is far more extended and is dominated by holes and clouds.
NGC 7552: This SBab galaxy is completely dominated by its bar, making the extraction of kinematical parameters impossible. The velocity field shows a central S–shape disturbance indicating non–circular motions caused by the bar. A steep velocity gradient ( km s-1 per kpc) is present in the nuclear region as well as a bright H centre representative of a LINER galaxy.
NGC 7793: The close–up view of this galaxy displays several HII regions and the corresponding H velocity field exhibits an s–shape distortion of the velocities along the minor axis. A kinematical analysis of the fairly regular HI velocity field reveals a declining rotation curve (Carignan & Puche, 1990). Deep FP observations of the diffuse gas have shown an extended H disc that is detected all the way to the edge of the HI disc.
Appendix B Figures
Figures were removed for the astro-ph version of this paper due to file size constraints. You can access them online at http://www.astro.umontreal.ca/fantomm/singsII/.
Appendix C Rotation curves


