The Evolution of NGC 7027 at Radio Frequencies
A New Determination of the Distance and Core Mass
Abstract
We present the results of a 25-year program to monitor the radio flux evolution of the planetary nebula NGC 7027. We find significant evolution of the spectral flux densities. The flux density at 1465 MHz, where the nebula is optically thick, is increasing at a rate of , caused by the expansion of the ionized nebula. At frequencies where the emission is optically thin, the spectral flux density is changing at a rate of per year, caused by a decrease in the number of ionizing photons coming from the central star. A distance of pc is derived. By fitting interpolated models of post-AGB evolution to the observed changes, we find that over the 25-yr monitoring period, the stellar temperature has increased by K and the stellar bolometric luminosity has decreased by %. We derive a distance-independent stellar mass of adopting the Blöcker stellar evolution models, or about 0.04 M⊙ higher when using models of Vassiliadis & Wood which may provide a better fit. A Cloudy photoionization model is used to fit all epochs at all frequencies simultaneously. The differences between the radio flux density predictions and the observed values show some time-independent residuals of typically 1%. A possible explanation is inaccuracies in the radio flux scale of Baars et al. We propose an adjustment to the flux density scale of the primary radio flux calibrator 3C 286, based on the Cloudy model of NGC 7027. We also calculate precise flux densities for NGC 7027 for all standard continuum bands used at the VLA, as well as for some new 30 GHz experiments.
1 Introduction
Planetary nebulae trace one of the fastest phases of stellar evolution. They form during the transformation from a low to intermediate mass star (1–8 M⊙) to its final white dwarf stage. The star first ejects its hydrogen envelope during a phase of catastrophic mass loss. This mass loss ceases once the hydrogen envelope is reduced to . The star subsequently heats up, briefly reaching surface temperatures in excess of K, before the cessation of hydrogen burning when the remnant C/O core enters the white dwarf cooling track. The evolution from the end of the AGB mass loss to the onset of cooling lasts between and yr: the duration is a steep function of white dwarf mass (Blöcker, 1995). The time scales are short enough that one may expect, in some cases, to observe significant changes in stellar temperature and luminosity within decades.
Once the star has reached temperatures above K, it ionizes the ejecta forming a bright planetary nebula (PN). The strong emission lines and radio continuum from the PN provides a tracer of the evolution of the parent star. Masson (1986, 1989) detected evidence for expansion of the brightest planetary nebula, NGC 7027, using radio images over a four-year baseline: this provided proof of the fast evolution. As the expansion velocity of the nebular gas is known, the result provides both a measure of its distance and of its age since ejection. Masson found a distance of 880 pc. The same method has been applied by Hajian et al. (1993) who found a somewhat faster angular expansion and therefore a lower distance, 770 pc. The radio method has been applied to three other PNe (Seaquist, 1991; Christianto & Seaquist, 1998; Hajian et al., 1993; Kawamura & Masson, 1996). Expansion-based distances have also been measured using optical HST images (Palen et al., 2002).
The evolution of the temperature and luminosity of the star can be derived through observations at optical or radio wavelengths. In the optical, the absolute photometric accuracy is set by the Earth’s atmosphere as well as instrumentational limitations. At radio frequencies, the required accuracies are currently achievable in the centimeter wavelength range, due to the limited to negligible effect of the atmosphere, the stability of radio telescopes and electronics, and the availability of constant flux calibrators. In this paper, we utilize these to investigate variations in the the radio flux of NGC 7027 over a 25-year period.
NGC 7027 is one of the secondary flux calibrators used in the Baars et al. (1977) flux scale. Its rapid evolution may raise doubts on its suitability as a calibrator. However, the radio spectrum, due to free-free emission, can be well understood and modeled, and hence predicted. We use this to investigate whether NGC 7027 can be used to improve the internal consistency of the radio flux calibration scale.
2 Observations
NGC 7027 has been observed at the VLA over a 25-year period. The data analyzed are a subset of those taken as part of the VLA Calibrator Flux Density project (Perley & Butler, 2008). This project commenced in 1983, with the goal of better determining the flux density ratios between the secondary flux density calibrators proposed in Baars et al. (1977). The VLA cannot by itself determine the absolute flux density of any object, but can very accurately measure the ratios between any pair of unresolved, or slighly resolved, sources (at some frequencies, errors in the ratio are as low as 0.1%). These ratios can then be used to determine absolute spectral flux densities, if at least one of the sources has a known spectral flux density. This can be provided by, for example, observations with a telescope of known gain (as reported by Baars et al., 1977), or by observations of an object whose emission processes are sufficiently well understood to permit calculation of its spectral flux density.
Observations in this program are typically made over the course of a full day, once every months when the VLA is in its low-resolution ‘D’-configuration. Short observations of each of 14 sources are taken at each available frequency band, approximately hourly when the sources are between an elevation of 30 and 70 degrees. These limits are set because of degraded high-frequency antenna performance at low elevations (antenna gain loss due to gravitational dish deformation, and increasing system temperatures due to atmospheric emission) and because of degraded pointing performance for observations near the zenith. In 1983, the observations were made only at the four original wavelength bands (20 cm, 6 cm, 2 cm, and 1.3 cm). More recent observations have included the newer bands at 90 cm, 3.6 cm, and 0.7 cm. All epochs have data from five key small-diameter steep-spectrum objects: 3C 48, 3C 138, 3C 147, 3C 286 and 3C 295. The first four of these are unresolved at all frequencies (in the ‘D’-configuration), and form the basis of the antenna gain calibration. 3C 295 is known to be non-varying on physical grounds, and hence establishes the reference for determining source variability.
The dominant source of error for determination of accurate flux densities at the shorter wavelengths (2 cm, and less) is in antenna pointing. For all epochs after 1990, the technique of ’referenced pointing’ was utilized at the shorter wavelengths to minimize this error. In this technique, a nearby calibrator of known position is utilized to determine the ’local’ pointing parameters, which were then applied to the target source. This method is effective if the nearby calibrator is within a few degrees. Unfortunately, for NGC 7027, the offset is rather large (eight degrees), limiting the effectiveness of the correction, as we discuss later. For the four basic calibrator sources, the effectiveness is certain, as they served as their own pointing calibrators. Unfortunately, NGC 7027 is too heavily resolved to serve as its own referenced pointing source.
All data from all epochs were edited and calibrated following the same procedures, summarized below. These will be described at length in Perley & Butler (2008).
1) Clearly discrepant individual data were edited visually through examination of visibility amplitudes.
2) Estimates of atmospheric opacity were made through ‘sky dips’ at 23 and 43 GHz, and the visibility amplitudes corrected for absorption at all frequencies, utlizing a simple atmospheric opacity model. These corrections are generally small, with zenith opacities typically 0.12 at 1.3 cm, and 0.08 at 0.7 cm.
3) The antenna gain dependency on elevation was estimated by fitting a polynomial to the observed elevation dependence of visibility amplitudes (following the opacity correction) for the four unresolved calibrators. Residual errors in opacity will be absorbed into the polynomial gain curve. The ratios of the spectral flux densities of the four sources are also determined at this step.
4) The Baars et al. (1977) value for the absolute flux density of 3C 286 was assumed correct, and the flux densities of the remaining three calibrator sources were determined after having accounted for opacity and antenna gain dependencies.
5) The visibility amplitudes for all sources were then calibrated utilizing the elevation-dependent gains and opacities, and the calibrator source flux densities, through application of a temporally constant gain solution.
6) The data were then re-examined for discrepant values – most notably due to antenna pointing errors – and the preceding steps were repeated until the residuals in the derived antenna gains showed an absence of clearly deviant values.
3C 286 is utilized as the flux density standard as it is unresolved, and its flux density ratio to 3C 295 has been determined to be changing by less than 0.01%/year at all bands (Perley & Butler, 2008).
Removal of atmospheric phase perturbations was done through the well-established methods of self-calibration, whereby the source emission is used to estimate and correct the antenna-based phase errors, utilizing a rough initial estimate of the source structure. In general, the process is iterative, as the source structure is not known in advance. However, for NGC 7027, we have utilized all the data, over all epochs, to establish a standard model to accelerate the convergence. Only the phases are corrected in this process, while the amplitudes are held fixed, to prevent ‘wandering’ of the flux density. At the resolutions utilized in this program, the secular changes in angular size are completely negligible, thus allowing the use of a single model.
Following basic calibration, the spectral flux density for each target source at each frequency and epoch was then determined by a number of methods, depending on source size and observing frequency. For NGC 7027 at 20 cm, the large primary beam includes many background sources whose contributions must be removed from that of NGC 7027: these background sources contribute 265 mJy of additional flux density to the 1.5 Jy from NGC 7027. The separation is done through imaging by fourier inversion. All data from the observations for each epoch were gridded, fourier transformed, and deconvolved following established methods. The effective resolution of 45 arcseconds partially resolves the source, so the integrated flux density is derived by spatial integration of the imaged response. Two methods were utilized: one simply sums all the brightness within the observed bounds of the source, while the other fits a gaussian to the observed brightness. This latter method can only be used for very slightly resolved objects, an assumption well justified at this frequency.
At all other frequencies, NGC 7027 is heavily resolved, while background source contamination is negligible as the antenna primary beam restricts the field of view. For these, the source emission was imaged, and the total flux estimated by spatial integration over the source.
The uncertainty in the flux density determination for a particular epoch and frequency was determined by measuring the source flux for each of the 8 to 10 observations taken at each band for each epoch. The variance in these determination, divided by , gives a 1- estimate of the error. The justification that the observations are independent arises from analysis of pointing errors from high-frequency observations of standard calibrators: the typical angular scale for pointing variations (due to the antenna azimuth and elevation mounts) is found to be 15 degrees, or about 1 hour in time. At longer wavelengths (3.6, 6 and 20 cm), pointing errors are not the dominant source of error, which is likely to be set by small-temporal-scale variations in antenna gain. The timescale for these is not certain, but is likely to be less than an hour.
3 NGC 7027 radio flux densities
Data were obtained for 12 epochs between 1983 and 2006. The available data, along with the estimated uncertainties, are summarized in Table 1, as ratios between NGC 7027 and 3C 286. Flux densities for NGC 7027 can be calculated using the Baars flux density scale for 3C 286, listed in Table 2. The Baars scale for 3C 286 extends only to 15 GHz – for the 23 and 43 GHz calibration, we have utilized observations of, and a model for the planet Mars, as will be described by Perley & Butler (2008). In this paper we will refer to the full frequency range as the ’Baars scale’, even where the supplemental Mars data is used. The Baars et al. 3C 286 values are likely to have their own uncertainties, as we argue for below.
| Epoch | 1275 MHz | 1465 MHz | 4535 MHz | 4885 MHz | 8435 MHz | 8735 MHz | 14965 MHz | 22460 MHz | 43340 MHz | |||||||||
|---|---|---|---|---|---|---|---|---|---|---|---|---|---|---|---|---|---|---|
| ratio | unc. | ratio | unc. | ratio | unc. | ratio | unc. | ratio | unc. | ratio | unc. | ratio | unc. | ratio | unc. | ratio | unc. | |
| 1983.42 | .1003 | .0004 | .7413 | .0022 | 1.67 | .06 | 2.29 | .13 | ||||||||||
| 1985.99 | .1014 | .0002 | .7457 | .0014 | 1.716 | .006 | 2.206 | .053 | ||||||||||
| 1987.34 | .1022 | .0004 | .7498 | .0016 | 1.183 | .004 | 1.760 | .016 | 2.292 | .044 | ||||||||
| 1989.99 | .1022 | .0003 | .7424 | .0015 | 1.166 | .004 | 1.715 | .011 | 2.222 | .019 | ||||||||
| 1995.20 | .1043 | .0005 | .7411 | .0022 | 1.165 | .002 | 1.7013 | .0028 | 2.183 | .007 | 3.21 | .12 | ||||||
| 1998.09 | .1049 | .0004 | .7374 | .0015 | 1.159 | .0018 | 1.692 | .003 | 2.214 | .021 | 3.15 | .10 | ||||||
| 1999.35 | .0758 | .00026 | .10467 | .00010 | .7400 | .0009 | 1.153 | .0011 | 1.689 | .003 | 2.199 | .008 | 3.27 | .04 | ||||
| 2000.77 | .07494 | .00060 | .10481 | .00068 | .6860 | .0008 | .7396 | .0010 | 1.150 | .003 | 1.18 | .0017 | 1.693 | .004 | 2.154 | .009 | 3.20 | .06 |
| 2001.86 | .0770 | .0006 | .1063 | .0004 | .6830 | .0011 | .7356 | .0015 | 1.155 | .0019 | 1.1844 | .002 | 1.686 | .008 | 2.15 | .017 | 3.29 | .06 |
| 2003.10 | .07673 | .0002 | .1060 | .0002 | .6833 | .0010 | .7362 | .0010 | 1.155 | .0020 | 1.186 | .002 | 1.682 | .005 | 2.199 | .008 | 3.22 | .040 |
| 2004.65 | .0763 | .00028 | .1066 | .00069 | .6835 | .0013 | .7352 | .0009 | 1.150 | .0010 | 1.1768 | .0013 | 1.6824 | .0028 | 2.199 | .013 | 3.368 | .040 |
| 2006.04 | .0774 | .00033 | .10668 | .00029 | .6822 | .0013 | .7350 | .0014 | 1.145 | .0020 | 1.182 | .0020 | 1.674 | .006 | 2.119 | .010 | 3.07 | .040 |
| Freq. [MHz] | 1275 | 1465 | 4535 | 4885 | 8435 | 8735 | 14965 | 22460 | 43340 |
|---|---|---|---|---|---|---|---|---|---|
| Flux density [Jy] | 15.52 | 14.51 | 7.758 | 7.410 | 5.189 | 5.066 | 3.455 | 2.560 | 1.537 |
| 15.33 | 14.70 | 7.875 | 7.477 | 5.132 | 5.004 | 3.439 | 2.571 |
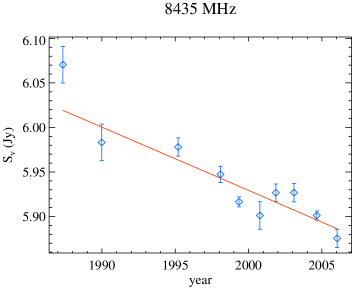
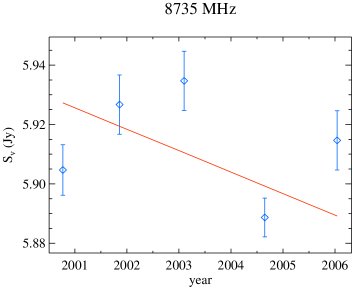
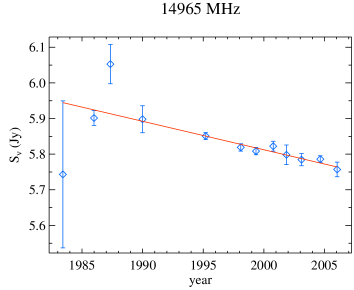
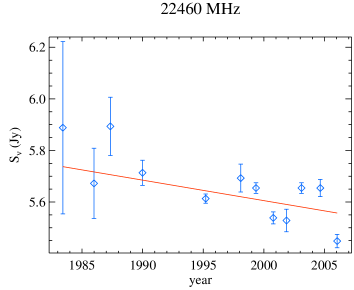
At the higher frequencies, NGC 7027 shows a larger scatter in the radio flux, especially during the first two epochs, than at the lower frequencies. At these earlier times, the VLA pointing was not as well established, nor were the receivers as sensitive as those now employed. In addition, referenced pointing was not employed until 1990.
The 43 GHz fluxes show large fluctuations, and are also considerably below the expected flux density for this frequency, compared, e.g., to the 1998 measurement of the absolute flux at 32 GHz, of Jy (Mason et al., 1999). The uncertainties may be weather-related, as the single epoch (2004.65) where the flux approached its expected value had exceptionally good (and dry) weather, while the 2006 observations with extremely low flux had very poor (and windy) weather. It is also probable that residual pointing errors are responsible – pointing errors can only lower the observed flux, and the source is unique amongst all the sources in the program in that it both transits near the zenith (where VLA pointing is most problematic) and that the nearest referenced pointing calibrator is over eight degrees away – a separation amplified by in the antenna’s coordinate frame, where is the elevation. These problems are probably also responsible for the larger errors in the 22460 MHz observations, as shown in Figure 1.
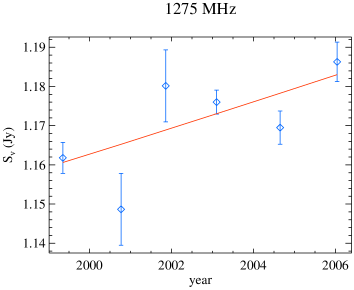
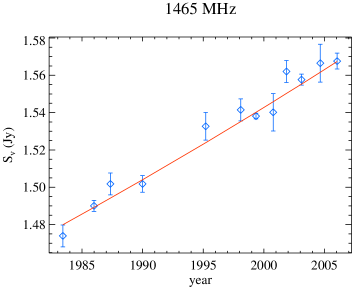
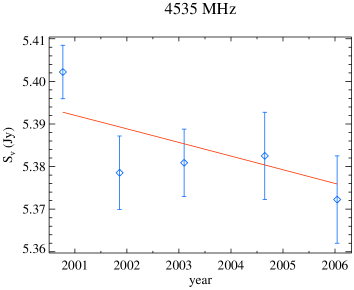
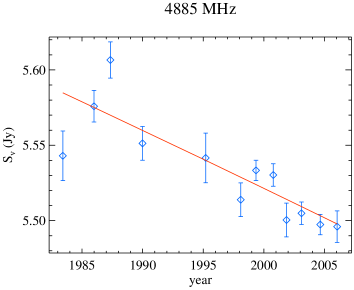
After allowing for the uncertainties, the ratios show significant, slow variations with time, well above the uncertainties. The changes in the fluxes are plotted in Fig. 1. At most frequencies, evidence is seen for linear changes with time. The 43 GHz data are not shown, and have not been incorporated into the analysis, for the reasons detailed above.
Interestingly, the secular changes vary with frequency. At 1.4 GHz, where the nebula is optically thick, a significant, steady flux increase is seen, from 1.46 to 1.56 Jy over the time span of the observations. At all higher frequencies, where the nebula is partially or fully optically thin, a small but significant decrease is seen instead. The fractional change per year ranges from +0.251 (at 1465 MHz) to per cent per year at optically thin frequencies.
4 SED modeling
The model of the radio spectrum is based on the Cloudy photoionization model described in Beintema et al. (1996). This one-dimensional model was used to fit the rich ISO infrared line spectrum, as well as the radio, optical and UV spectrum; a stellar (blackbody) temperature of was derived, with some evidence for changes after 1981 which could be due to an increase in temperature.
We modified this Cloudy model by forcing the inner radius to 2/3 of the outer radius, in order to give better agreement with the observed thickness of the shell as reported by Masson (1989). A new fit was derived, to give the best fit to all the observational data, including the 15 GHz radio flux measurement from Masson (1989). This model yields the electron temperature and density, as well as the ionization structure of the most important elements (H, He, C, N, O) as a function of radius. The abundances determined with the new Cloudy model showed some differences. Especially the helium abundance changed from 10.98 in Beintema et al. (1996) to 11.08 in the current model. These abundances are relative number densities on a logarithmic scale w.r.t. n(H) . Abundances have also been derived from this ISO spectrum by Bernard Salas et al. (2001), but using ionization correction factors, rather than modeling. We tested the sensitivity of the results discussed below to the abundance differences, but found only insignificant changes. The new model requires a somewhat higher stellar temperature to fit the high ionization lines, because of the larger inner radius, . Because we find that this is very sensitive to the adopted inner radius, below we will use the temperature from Beintema et al. (1996).
The radio fluxes were calculated using a purpose-built spherically symmetric model. This included a very accurate Gaunt free-free factor routine and exact radio radiative transfer to cover optical depth effects. Radio emission can originate from other processes than free-free emission. Non-thermal emission is not observed in PNe, but rotational emission from dust has been suggested (Casassus et al., 2004), giving excess emission at 20-30 GHz. Sub-millimeter polarimetry has confirmed the presence of spinning, non-spherical dust grains in NGC 7027 (Sabin et al., 2007). However, using emissivities tabulated in Draine & Lazarian (1998), we find an expected flux from spinning dust at 22 GHz of mJy, which is negligible. Radio recombination lines are also not included in the model. All frequency bands used avoid the H transitions, apart from the 4.885 GHz band which includes the H110 line with a line-to-continuum ratio of % (Roelfsema et al., 1991): this line will contribute % to the total in-band flux.
Four free parameters were introduced to model secular variations in the number of ionizing photons (due to evolution of the central star) and optical depth scale (due to expansion of the nebula). Both were assumed to vary linearly, of the form where the scaling factors are independent of frequency, and is time in years.
The electron temperature can be considered constant with time. The photoionization equilibrium is established on a time scale of the order of a year. The cooling function of nebular gas is a very steep function of electron temperature. Hence, obtaining an appreciable amount of change in the electron temperature requires a large change in the heating rate: the so-called thermostat effect.
| freq | flux | sec.var. | f |
|---|---|---|---|
| GHz | Jy | mJy/yr | |
| 1.2750 | 1.1627 | 3.28 | 1.0126 0.0006 |
| 1.4650 | 1.5428 | 4.00 | 0.9874 0.0006 |
| 4.5350 | 5.3953 | 3.18 | 0.9852 0.0006 |
| 4.8850 | 5.5215 | 3.88 | 0.9910 0.0005 |
| 8.4350 | 5.9294 | 7.12 | 1.0112 0.0005 |
| 8.7350 | 5.9329 | 7.23 | 1.0124 0.0006 |
| 14.9650 | 5.8125 | 7.99 | 1.0046 0.0007 |
| 22.4600 | 5.6054 | 7.95 | 0.9956 0.0006 |
| 43.3400 | 5.2034 | 7.51 |
Using this procedure, the quality of the fit does not agree with the uncertainties on the data: the model flux densities are typically discrepant by % – offsets significantly greater than the measurement uncertainties. We therefore decided to include in the model systematic uncertainties in the flux density scale, represented by multiplicative factors for each frequency which are constant over time. We set the conditions that the factors for 1275 and 1465 MHz add up to 2, and the factors for the higher frequencies sum to 6 exactly, to avoid degeneracy with the scale factors ’’ defined above (the 43 GHz flux densities were not used for reasons described earlier). This division is based on the observation that the lowest two frequencies will be mainly sensitive to the scale factor for the optical depth, while the higher frequencies will be mainly sensitive to the scale factor for the number of ionizing photons. In effect, we have by this procedure fixed the flux density scale to the Baars scale including the Mars calibration at 23 GHz. Observations at different frequencies will have different weights, determined by the number of observations, the observational uncertainty, and the strength of the optical depth effect. This procedure resulted in a total of 10 free parameters for 74 observations.
The multiplicative factors gave a large improvement, with the reducing from 2000 to 170. The resulting best fit is shown in Table 3, where the flux values refer to the epoch 2000.0. One would expect an ideal . The larger obtained may indicate that the errors on the flux determination have been underestimated, especially at 23 GHz.
The best fit is given by the following relations, where is the number of hydrogen-ionizing photons emitted per second, is the optical depth at radio frequencies and is the time in years.
| (1) |
with
| (2) |
The secular variation of the model flux is in principle non-linear, but this is only noticeable (barely) for the lowest frequencies.
5 Expansion and distance
5.1 Measured expansion
The flux density in the optically thick regime, at 1465.9 MHz, is increasing at a rate of per cent yr-1. We note that the brightness temperature, which is given by
| (3) |
derived from high-resolution 1.4 GHz data (–: Bains et al., 2003) is in good agreement with the electron temperature predicted by the Cloudy model (). This indicates that the optical depth at these frequencies must be high. The intensity at the surface of the nebula is approximately equal to the source function at an optical depth of 2/3. Since the source function can be approximated by the blackbody function () in the radio regime, it follows that the intensity only depends on the electron temperature, which can be assumed to be nearly constant, as we already argued above. Hence the flux density only depends on the surface area of the emitting region. Since the total optical depth in the nebula is high, the layer at which is reached must be close to the ionization front. Therefore the increase in the 1465.9 MHz is measures the increase in the surface area of the ionized region.
5.2 Distance
To obtain a distance from the measured angular expansion, an expansion velocity is needed. The expansion velocity in the equatorial plane is reported as , based on the [O iii] line (Bains et al., 2003). This value was used by these authors, together with the measured angular expansion (Masson, 1989) to obtain a rather short distance of pc. Other measured values of the velocities are higher, such as the 19.5 km s-1 in Br (Cox et al., 2002). In optical lines Walsh et al. (1997) find an expansion velocity of . The CO shell has an expansion velocity of 13–16 km s-1 (Hasegawa & Kwok, 2001; Fong et al., 2006). Other lines arising from the photo-dissociation region show larger line widths than does the CO. High velocity gas, reaching 55 km s-1, is seen along a bipolar axis (Cox et al., 2002), but such a fast component is not known from the ionized gas. Radio recombination lines indicate an expansion velocity of (Ershov & Berulis, 1989).
Most of the measurements refer to the equatorial direction where most of the gas is located, and where the 1-d radio expansion was measured. Our 2-d expansion measurement also requires information on the polar expansion, which is known to be faster. The velocity field has been studied comprehensively by Walsh et al. (1997) and Roelfsema et al. (1991). The velocity law obtained by fitting the 3-dimensional line data (optical forbidden lines and radio recombination lines) is (Walsh et al., 1997):
| (4) |
where is the radial coordinate in the nebula and is the distance. The velocities are radially away from the central star. This model predicts a peak velocity on the minor axis of , and on the major axis .
The velocity law of Walsh et al. (1997) does not preserve the morphology: the expansion is not self-similar. This is expected, as for bipolar planetary nebulae the opening angle of the polar lobes increases over time, eventually reaching an ’X’ shape. NGC 7027 is still at an early phase of this evolution.
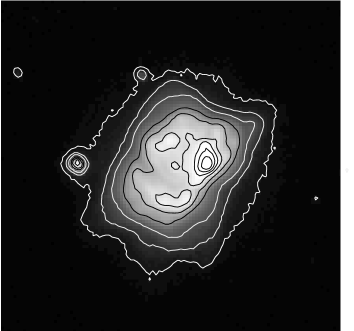
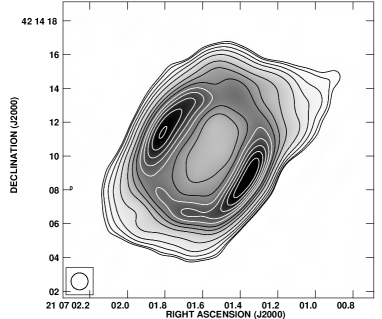
The ionized nebula is approximately rectangular with diameter arcsec, measured from the 1.4 GHz images presented in Bains et al. (2003). An -band optical image obtained during the IPHAS survey (Drew et al., 2005), and a VLA image derived from the 43 GHz data, are shownn in Fig. 2.
To represent this morphology, following Masson (1989), we first assume a cylindrical model for the nebula, with arcsec and arcsec, observed on an inclination of degrees with respect to the line of sight. The axial ratio of the unprojected cylinder is 1.4. (The observed elongation is slightly amplified by the thickness of the cylinder.) This model, together with the velocity field above, predicts that the surface area of the nebula increases by a fraction of . We also considered the ellipsoid model of Masson (1989) (their model 3). This requires a much larger intrinsic axial ratio and therefore reaches much higher velocities in the polar direction, assuming the velocity field above. But the tangential expansion is very similar and we find a fractional increase of surface area of , i.e. almost identical to the cylindrical model. The tangential expansion predicted from the two models is illustrated in Fig. 3.
The kinematical models compared to the measured increase of , yield a distance of . Here, covers several correction factors which still need to be applied: the decline in surface brightness (Kawamura & Masson, 1996), and most importantly, the difference in speed between the velocity of the gas and the speed of the ionization front (Masson, 1989). We find that the assumption of constant underestimates the expansion by 10 percent.111Terzian (1997) notes that the correction will also depend on the presence of clumps, filaments, etc. which may show a different surface brightness decline from the diffuse gas. The photo-ionization model shows that the ionization front moves 40 per cent faster than the gas. This is the most uncertain part of expansion distances, and in extreme cases the ionization front can move up to three times faster than the gas (Schönberner et al., 2005). The structure of the ionization front requires a time-dependent model, which we have not attempted.
Combining the two factors, which act in opposite direction, yields . For comparison, Masson (1989) finds a factor of . The difference can be taken as an indication for the uncertainty in the models. This uncertainty dominates over our uncertainty on the angular expansion. It will be difficult to improve on the expansion distance without better nebular models.

Taking the average correction factors found by us and Masson (1989) (i.e. ), we derive an expansion distance to NGC 7027 of pc.
5.3 Previous expansion distance measurements
| Vexp | Distance | ref. | Corrected distance | |
|---|---|---|---|---|
| [km/s] | [pc] | [pc] | ||
| 2D | 3D | This paper | ||
| 21 | Masson (1986) | |||
| Masson (1989) | ||||
| Hajian et al. (1993) | ||||
| 18.9 | Walsh et al. (1997) | 950 | ||
| Bains et al. (2003) |
Previous distance measurements are listed in Table 4. Two independent expansion measurements are reported in Hajian et al. (1993) and Masson (1989), together with an intermediate result reported in Masson (1986). The other papers re-used their measurements.
Masson (1989) applied several corrections to the measured expansion, to obtain the bulk gas motion from the measured expansion of the ionization front. One of these corrections is not warranted, as they include a decline of the 4.9 GHz radio flux which we do not confirm. Removing this correction decreases the change in angular diameter by 0.4 mas yr-1. They also derive a correction for the difference in the velocity of the ionization front and the gas, and include the correction for the declining brightness temperature. Bains et al. (2003) simply corrected the result of Masson (1989) for a lower expansion velocity, and so implicitly used the other correction factors. Hajian et al. (1993) used the measured expansion as the bulk gas motion, but ignored the differential movements; they also did not correct for inclination effects. Walsh et al. (1997) present a careful determination of the 3D velocity field, based on optical velocity cubes, and apply this to the inclined ellipsoidal model of Masson (1989) to obtain the velocity in the plane of the sky. They use the expansion measurement of Hajian et al. (1993) but do not correct for the ionization front velocity or the brightness temperature decrease.
Comparing the values in Table 4, the low expansion velocity of Bains et al. (2003) is noticable. Their velocity is based on [O iii] which measures velocities in an intermediate excitation region closer to the central star. Lines formed near the ionization front in planetary nebulae, such as [N ii], commonly show higher velocities (e.g. Gesicki et al., 2003).
6 Evolution and mass of the central star

The radio measurements reveal a clear decrease in the flux at higher frequencies, where the emission is optically thin. The radio flux in this regime is proportional to the recombination rate within the ionized nebula. Recombination time scales are fast since the nebular densities are high. The Cloudy model indicates a recombination time of 4 yr. We can therefore assume ionization equilibrium such that the recombination rate is equal to the ionization rate.
The ionization rate is determined by the number of ionizing photons, , where every photon gives one ionization. The decline of the optically thin flux indicates a reduction in the number of ionizing photons. The model described above gives a fractional decline of . The number of ionizing photons depends on the stellar temperature and luminosity.
To get the evolution of the stellar temperature and luminosity with time, we use the evolutionary tracks from Blöcker (1995). These are calculated for hydrogen-burning central stars (a minority of stars may be helium burners, in particular the [WC] stars). The tracks are available for a number of different masses: 0.546, 0.565, 0.605, 0.625, 0.696, 0.836, and 0.940 M⊙. The initial masses are much higher; the stars lose between 20 and 80 per cent of their mass on the Asymptotic Giant Branch. The initial-final mass relation remains uncertain. The rates of change of temperature and luminosity for different final masses are plotted in Fig. 4.
We have interpolated between the individual Blöcker models to obtain a much finer core-mass resolution, and to determine for each core mass the relation between (, ). The procedure is described in Frankowski (2003), and we used tracks obtained from K. Gesicki (priv. comm.).
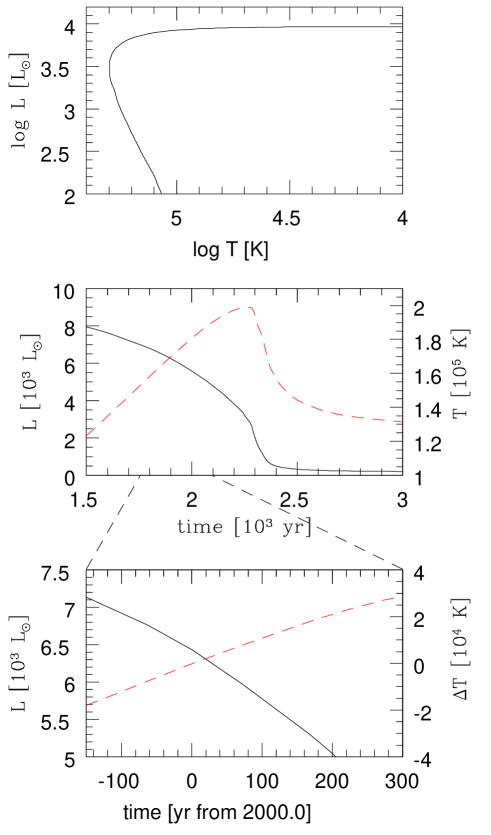
Fig. 5 illustrates the expected evolution of the star for one of these interpolated tracks. On the post-AGB track, the temperature increases while the remaining hydrogen envelope is reduced by burning. Once the nuclear burning ceases, a fast drop in luminosity occurs, typically by a factor of 100 over a century. The temperature reaches its maximum during the initial decline and afterwards begins a slow decline. This evolution gives rise to the characteristic ’knee’ in the HR diagram. The maximum temperature which is reached depends on the mass of the star. The timescales before the knee, in terms of the temperature increase per year, are a strong function of stellar mass. This in principle allows for an accurate measurement of this mass. Recent papers have derived the evolutionary time scale of a PN from the expansion age of the nebula, assuming that the heating started immediately after the nebula was originally ejected. This yields a very narrow mass distribution for the central stars, between 0.58 and 0.65 M⊙ with a peak at M⊙ (Gesicki & Zijlstra, 2007). This is based on indirect measurements of the stellar heating time. NGC 7027 allows us to apply the same technique using a direct measurement of the current rate of evolution.
(H) depends on stellar temperature and luminosity. For sufficiently hot stars it decreases with increasing temperature (assuming constant luminosity) because each photon carries more energy. In order to derive a relationship between and , we need to know the spectral energy distribution of the star. We used 2 assumptions: a blackbody spectrum and Rauch H-Ni line-blanketed NLTE model atmospheres with log() = 7 or 8 (Rauch, 2003). The observed decrease in would, for constant luminosity and an initial temperature of K (Beintema et al., 1996), translate into a temperature change of using the Rauch model atmosphere calibration. Using the interpolated Blöcker tracks, we find that this rate of temperature evolution is reached for . In practice, this yields an upper limit to the mass. The luminosity is also decreasing, and this contributes to the rate of evolution. Thus, the real temperature increase is less than this limiting value. For each mass, we computed the temperature at which . For each track there are two solutions, one on the horizontal track and one on the cooling track. The latter can be rejected, as the luminosity at this point on the cooling track is while the observed value is close to (Middlemass, 1990; Beintema et al., 1996; Wolff et al., 2000).
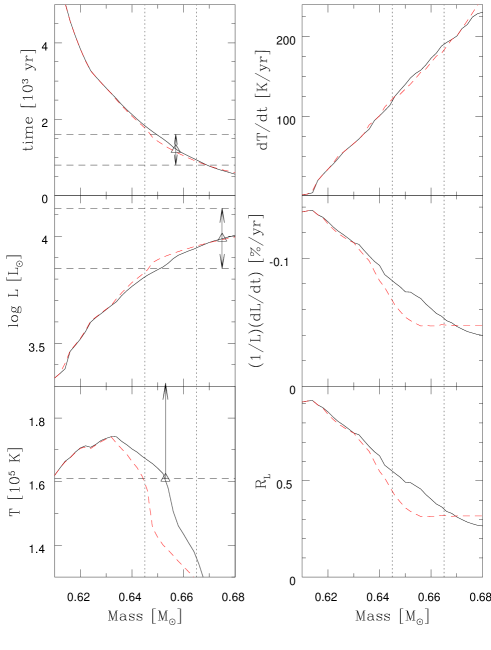
The observed can be reproduced for a range of masses, as illustrated in Fig. 6. Hence we need an additional constraint to break the degeneracy. For this we use the kinematical age of the nebula. We calculate the kinematical age using the method of Gesicki & Zijlstra (2000): it uses the observed expansion velocity and radius, but measures these quantities at 0.8 of the outer radius. PN velocity fields show strong acceleration near the outer boundary, due to the overpressure of the ionized gas. The value of 0.8 of the outer radius is closer to the mass-averaged radius, and gives more stable values. Gesicki & Zijlstra (2000) also apply a correction to allow for the acceleration of the nebula, which we did not use as NGC 7027 is still ionization bounded and the acceleration is still minor. Using the velocity field above (eq. 4), we find a dynamical age of 1200 yr. The uncertainty on the method is estimated as yr, including the distance uncertainty. The top panel of Fig. 6 shows the corresponding age of the star on the Blöcker track, measured from the start of the post-AGB phase. The horizontal dashed lines indicate the age uncertainty.
The luminosity at the time the specific value for is reached, for each mass, is plotted in the middle-left panel of Fig. 6. The luminosity corresponding to our kinematical age is log = 3.86 – 3.91, depending on the calibration for . The luminosity is derived by Wolff et al. (2000) based on HST photometry of the star: they give a range of values, depending on the uncertain extinction. Converting their values to our preferred distance gives = 3.89 – 4.09. The Beintema et al. (1996) model, scaled to our distance, gives . The luminosity corresponding to our kinematical age agrees with the lower end of the range found by Wolff et al. (2000). Our distance uncertainty of 100 pc corresponds to an uncertainty in of 0.084, and this is sufficient to bring the predictions and observations in agreement.
The bottom left panel of Fig. 6 shows the stellar temperature for which the observed is reached. For the adopted K (Beintema et al., 1996), there are two solutions, one at 0.61 M⊙ and one at 0.644 – 0.652 M⊙ depending on the calibration. The lower solution is clearly ruled out by our constraint on the kinematical age, but the higher value is in fair agreement (especially if the blackbody calibration is adopted). There is however disagreement in the literature for the stellar temperature: published values range from K (Middlemass, 1990) to K (Zhang et al., 2005), while our revised model also igves a somehwat higher temperature. The first detection of the [Ne vi] and [Ar vi] lines by Beintema et al. (1996) favors a high temperature, and makes the low temperature found by Middlemass (1990) seems doubtful. But none of the higher values can be ruled out at this stage, so that we indicate the adopted value as a lower limit. We find no solution in the Blöcker tracks for temperatures above K: for the indicated mass range, such high temperatures are only reached in the ’knee’, when the luminosity drops too fast. Higher mass stars reach such temperatures while still on the horizontal track, but their temperatures increase too fast. Hence we can summarize that the large uncertainty on the stellar temperature makes this a very poor constraint on the core mass. At this stage we cannot even confirm that the temperature is in agreement with the theoretical tracks. More observations and/or modeling are needed to settle this point.
We can summarize the previous discussion as follows. The kinematical age of the nebula is consistent with a stellar mass of , while the luminosity favors a more massive star but given the distance uncertainties may still be consistent with this mass. Masses below 0.645 M⊙ appear to be inconsistent with the luminosity or age. The stellar temperature favors a mass below 0.66 M⊙. Combining these requirements, we adopt a mass derived from the Blöcker tracks of
| (5) |
For this mass and assuming a blackbody atmosphere, we find
| (6) |
The individual contributions from the changing luminosity and temperature are indicated in the right panels of Fig. 6. The bottom right panel shows the fraction of the which can be attributed to the change in luminosity, . Approximately 45-65% of the decline in the number of ionizing photons is due to the increasing temperature, and the remaining 55–35% to a decreasing luminosity. The individual evolutionary rates of the luminosity and temperature are indicated in the right panels of Fig. 6. For lower masses, the luminosity decrease dominates the total , while for higher masses, the temperature change is more important.
6.1 Model uncertainty
The derivation above yields a consistent, well defined mass as derived from the interpolated Blöcker tracks. The error margin does not, however, include any systematic uncertainty in the interpolated Blöcker models. This uncertainty becomes evident when comparing to the alternative tracks of Vassiliadis & Wood (1994).
The tracks of Vassiliadis & Wood (1994) (hereafter VW95) differ from the Blöcker tracks mainly in the treatment of the mass loss. They assume an early and fast end to the AGB mass loss, leading to an extended period between the end of the AGB and the onset of ionization, the so-called transition time. After this transition, the VW94 models speed up and during the PN phase, the model tracks behave qualitatively similar. The shorter transition times of the Blöcker models provide a better fit to the ages of planetary nebulae.
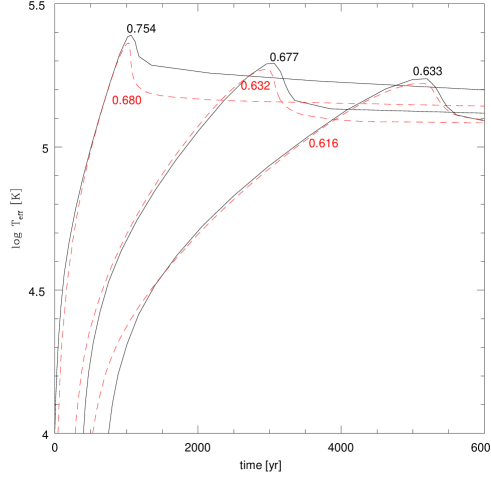
We have compared the heating rates of the VW94 models to those of Blöcker. This shows a surprising difference, in that the former show a slower temperature increase for the same mass, even for hot, ionizing central stars where the mass loss through the stellar wind is unimportant. For the same heating rate, the VW94 models require a higher stellar mass. This is illustrated in Fig. 7, where for three tracks of VW94 we show the interpolated Blöcker track with the same heating rate, labeling both tracks by their masses. To take account of the different transition times, the VW94 tracks are shifted horizontally to force overlap with the corresponding Blöcker track. For the Blöcker mass range derived for NGC 7027, the tracks differ by M⊙. Thus, using the VW94 tracks we would have derived a mass of around 0.7 M⊙.
We have used the Blöcker tracks because of their better treatment of the early post-AGB phase. Higher mass models show a higher luminosity, and allow for a higher stellar temperature. This may indicate that better agreement could have been obtained with the VW94 models. However, it is not currently possible to decide between the models and new model calculations would be warranted.
This large difference appears to be related to the relation between the envelope mass and the stellar temperature. Comparing the – relation in Fig. 4 of Blöcker (1995), to those derived from the VW94 models as shown in Frankowski (2003), shows that the VW94 models of the same core mass and envelope mass are much hotter, or for the same temperature have a higher envelope mass. The explanation of this discrepancy is not clear to us,.
The dominant source of uncertainty in the derived mass is therefore a systematic one, related to the adopted stellar evolution model.
6.2 Initial–final mass relation
The initial-final mass relation is not well known, but is best constrained from white dwarfs in open clusters. A comprehensive study is presented by Ferrario et al. (2005), re-analyzed by Williams (2007). The latter proposes the following linear relation, based on white dwarfs in open clusters:
| (7) |
For NGC 7027, the nebular abundances indicate a progenitor mass in the range 3-4 M⊙ (Bernard Salas et al., 2001). Assuming the lowest mass, the final mass should be M⊙. The (Blöcker) mass determinations place NGC 7027 well below the proposed initial-final mass relation. A mass as high as implied by the relation above can be excluded, as such a massive star would have evolved much faster than observed. The mass implied from the VW94 models is closer to the proposed relation, although still below its lower limit.
However, individual white dwarfs within the same cluster show a very large range of masses. For the two clusters with initial masses around 3 M⊙, Praesepe and Hyades, 4 out of 11 stars have masses below 0.7 M⊙, while 3 have masses M⊙. A mass of 0.65 M⊙ for NGC 70727 would be unexceptional, and for instance identical to that of 0431+125, with a progenitor mass of 2.8 M⊙ and a white dwarf mass of .
We conclude that the derived mass of the central star of NGC 7027 does agree with the initial-final mass distribution, assuming a progenitor mass near 3 M⊙. This distribution is however not well represented by the proposed single, linear relation. Ferrario et al. (2005) also discuss a higher order relation which may be in better agreement with at least the lower masses.
7 Radio flux density calibrators
The radio flux scale in use at the VLA is based on Baars et al. (1977), who determined a scale based on absolute flux density measurements of the young supernova remnant Cas A and the extragalactic radio source Cygnus A. These two sources are uniquely suitable for absolute measurements, as they provide typically 1000 Jy of spectral radio flux density. The flux density of Cas A has been determined for the range 0.3–30 GHz. Cas A is itself evolving, and is decreasing in flux by per cent per year, where is the frequency in GHz.
The rapid evolution, which may not be entirely uniform, makes Cas A less useful as a time-independent calibrator. More importantly, both Cas A and Cygnus A are far too extended for use by modern radio interferometers. Baars et al. (1977) therefore transferred the scale to several small-diamater (typically less than 1”) extragalactic sources. For the purposes of setting the flux scale, we utilize the Baars expression for 3C 295, which we believe to be non-varying as it is an extragalactic radio emitter with physical size scales in excess of 1 kpc. The only compact radio emission comes from the nucleus, which for this source constributes less than 5 mJy – or less than 1% of the total at any frequency. The effect of any secular variations on the total can thus be neglected. As mentioned earlier, the variation of the ratio of 3C 286 to 3C 295 is less than 0.01% per year, thus justifying our assumption that 3C 286 is also constant. The original (Baars) flux scale adopted for 3C 286 is listed in Table 2.
The Cloudy model discussed above showed the need for time-independent correction factors which dramatically improved the quality of the fit. The factors are listed in Table 3. Although imperfections in the model may be present, it is unlikely that these cause the observed deviations, and we believe they originate in the adopted flux scale. The model for NGC 7027 cannot improve on the absolute flux scale, but can be used to test for its consistency over the full frequency range.
Baars et al. (1977) gives uncertainties of 2 per cent for the measurements of Cas A at the frequency range discussed here, and %, or worse, for that of the secondary calibrators. The discrepancies we see are of order 1 per cent, and therefore consistent with their accuracy. Under the assumption that the correction factors represent real inaccuracies in the flux density scale, the bottom row of Table 2 gives the revised values for the flux densities of 3C 286.
NGC 7027 is a valuable source for establishing the flux density scale for two reasons. It is a bright, relatively compact source which is observable over a wide range of frequencies. Second, the frequency dependence and the temporal evolution of its emission are well understood. These make it possible to calculate the flux of NGC 7027 for any frequency within the range covered here (1.2–45 GHz), and for any time over which our linear evolutionary model remains valid. This makes NGC 7027 uniquely suitable for use in calibrating non-standard radio frequencies, such as the 30 GHz receivers which have recently come into operation.
| Band | Freq. [GHz] | Flux [mJy] | [mJy/yr] |
| (2000.0) | |||
| VLA | |||
| LL | 1.465 | 1542.8 | 4.00 |
| CC | 4.885 | 5521.5 | 3.88 |
| XX | 8.435 | 5929.4 | 7.12 |
| UU | 14.965 | 5812.5 | 7.99 |
| KK | 22.485 | 5604.8 | 7.95 |
| 43.315 | 5203.8 | 7.51 | |
| VLA | |||
| HH | 1.430 | 1470.5 | 3.89 |
| 18 | 1.665 | 1966.9 | 4.49 |
| VC | 4.985 | 5552.3 | 4.06 |
| VX | 8.465 | 5929.8 | 7.13 |
| VU | 15.315 | 5802.4 | 8.00 |
| VK | 22.235 | 5611.1 | 7.96 |
| VQ | 43.135 | 5206.4 | 7.51 |
| OCRA | 30 | 5433.8 | 7.79 |
| CBI | 31 | 5413.6 | 7.77 |
| VSA | 33 | 5375.0 | 7.72 |
To illustrate this, Table 5 lists the parameters for the radio flux of NGC 7027 for common frequency bands used at the VLA, as well for several new, 30 GHz experiments. These were calculated using the derived photo-ionization structure and the temporal evolution of optical depth and number of ionizing photons. Gaunt factors were calculated with high precision for each of these bands.
Using the same technique, Table 6 gives the full model radio spectrum of NGC 7027.
The linear extrapolation from epoch 2000.0 becomes invalid over very long time scales. Thus at 1.275 GHz, the slope changes from +2.87 mJy/yr in 1981.0 to +3.52 mJy/yr in 2010.0. Extrapolating a linear evolution from 1981.0 predicts a 2010.0 flux of 1094.7 mJy, versus an actual model flux of 1187.8 mJy, an error of almost 1%. At 5 GHz the error over 29 years is 3.5 mJy (0.06%), while at 9 GHz it is down to 1.3 mJy (0.02%).
The linear approximation to the flux changes therefore works well, but the errors become noticeable especially at the lowest frequencies.
| Freq. [GHz] | Flux [mJy] | [mJy/yr] |
|---|---|---|
| (2000.0) | ||
| 1.000000 | 692.40 | 2.043 |
| 1.995262 | 2662.17 | 4.554 |
| 3.019952 | 4303.79 | 1.423 |
| 3.981072 | 5120.87 | 1.796 |
| 5.011872 | 5560.25 | 4.112 |
| 6.025596 | 5773.05 | 5.519 |
| 7.079458 | 5879.05 | 6.427 |
| 8.128305 | 5923.46 | 6.996 |
| 9.120108 | 5934.69 | 7.347 |
| 10.000000 | 5930.05 | 7.561 |
| 15.135612 | 5807.58 | 7.998 |
| 20.417379 | 5658.59 | 7.989 |
| 30.199517 | 5429.71 | 7.787 |
| 40.738028 | 5242.74 | 7.561 |
| 50.118723 | 5110.67 | 7.387 |
8 Conclusions
We have presented the results of a 25-year monitoring program of NGC 7027 at radio wavelengths. These results provide conclusive evidence for on-going evolution of this object. At low frequencies, where the nebula is optically thick, the radio flux is increasing approximately linearly with time, at a rate of . This is shown to be directly caused by expansion of the nebula. From the observed increase and the known velocity field, we derive an expansion distance of pc. The distance includes several correction factors: the most important one of these is the difference between the velocity of the gas and the velocity of the ionization front. The uncertainties in these correction factors dominate the final result: improved measurements of the rate of expansion will therefore not a-priori yield better distances.
At higher frequencies, where the nebula is optically thin, the data shows a steady decline of the radio flux, at a rate of . We show that this can only be caused by evolution of the exciting star. The number of ionizing photons is dropping, due to an increase in stellar temperature and a decrease in stellar luminosity.
Evolutionary models of post-AGB stars are used to fit the observed decrease in ionizing photons. Using interpolated evolutionary tracks of Blöcker (1995), we find a well-constrained mass for the central star of NGC 7027, of . However, the alternative models of Vassiliadis & Wood (1994) evolve slower, and would indicate masses higher by about 0.04 M⊙. The discrepancy is related to a difference in the relation between envelope mass and effective temperature. For the Blöcker model, we find a temperature increase of , and a luminosity decrease of . The mass is consistent with those of white dwarfs in open clusters with initial masses around 3 M⊙, or slightly below.
The photoionization model of NGC 7027 reveals small residuals which are frequency-dependent but constant with time. Correcting for these gives a large improvement on the fit. We propose that they are caused by inaccuracies in the relative fluxes of 3C286, based on the Baars flux scale. If this is correct, it is possible to improve the internal consistency of the Baars scale. A set of revised flux densities is proposed for 3C 286 which takes this correction into account. Using the models for NGC 7027 developed in this paper, we calculate its time-dependent radio flux densities for the standard continuum bands used at the VLA, as well as some high frequency bands used by a number of new experiments.
Acknowledgements
PvH acknowledges support by the Belgian Science Policy Office under grant MO/33/017. The Very Large Array (VLA) is operated by the U.S. National Radio Astronomy Observatory, a facility of the National Science Foundation operated under cooperative agreement by Associated Universities, Inc. AAZ received support from an STFC rolling grant, and also gratefully acknowledges the hospitality of the SAAO where part of this work was carried out.
Facilities: VLA
References
- Baars et al. (1977) Baars J. W. M., Genzel R., Pauliny-Toth I. I. K., Witzel A., 1977, A&A, 61, 99
- Bains et al. (2003) Bains I., Bryce M., Mellema G., Redman M. P., Thomasson P., 2003, MNRAS, 340, 381
- Beintema et al. (1996) Beintema D. A., van Hoof P. A. M., Lahuis F., Pottasch S. R., Waters L. B. F. M., de Graauw T., Boxhoorn D. R., Feuchtgruber H., Morris P. W., 1996, A&A, 315, L253
- Bernard Salas et al. (2001) Bernard Salas J., Pottasch S. R., Beintema D. A., Wesselius P. R., 2001, A&A, 367, 949
- Blöcker (1995) Blöcker T., 1995, A&A, 299, 755
- Casassus et al. (2004) Casassus S., Readhead A. C. S., Pearson T. J., Nyman L.-Å., Shepherd M. C., Bronfman L., 2004, ApJ, 603, 599
- Christianto & Seaquist (1998) Christianto H., Seaquist E. R., 1998, AJ, 115, 2466
- Cox et al. (2002) Cox P., Huggins P. J., Maillard J.-P., Habart E., Morisset C., Bachiller R., Forveille T., 2002, A&A, 384, 603
- Draine & Lazarian (1998) Draine B. T., Lazarian A., 1998, ApJ, 508, 157
- Drew et al. (2005) Drew J. E., Greimel R., Irwin M. J., Aungwerojwit A., Barlow M. J. e. a., 2005, MNRAS, 362, 753
- Ershov & Berulis (1989) Ershov A. A., Berulis I. I., 1989, Soviet Astronomy Letters, 15, 178
- Ferrario et al. (2005) Ferrario, L., Wickramasinghe, D., Liebert, J., & Williams, K. A. 2005, MNRAS, 361, 1131
- Fong et al. (2006) Fong D., Meixner M., Sutton E. C., Zalucha A., Welch W. J., 2006, ApJ, 652, 1626
- Frankowski (2003) Frankowski A., 2003, A&A, 406, 265
- Gesicki et al. (2003) Gesicki K., Acker A., Zijlstra A. A., 2003, A&A, 400, 957
- Gesicki & Zijlstra (2000) Gesicki K., Zijlstra A. A., 2000, A&A, 358, 1058
- Gesicki & Zijlstra (2007) Gesicki K., Zijlstra A. A., 2007, A&A, 467, L29
- Hajian et al. (1993) Hajian A. R., Terzian Y., Bignell C., 1993, AJ, 106, 1965
- Hasegawa & Kwok (2001) Hasegawa T. I., Kwok S., 2001, ApJ, 562, 824
- Kawamura & Masson (1996) Kawamura J., Masson C., 1996, ApJ, 461, 282
- Mason et al. (1999) Mason B. S., Leitch E. M., Myers S. T., Cartwright J. K., Readhead A. C. S., 1999, AJ, 118, 2908
- Masson (1986) Masson C. R., 1986, ApJ, 302, L27
- Masson (1989) Masson C. R., 1989, ApJ, 336, 294
- Middlemass (1990) Middlemass D., 1990, MNRAS, 244, 294
- Palen et al. (2002) Palen S., Balick B., Hajian A. R., Terzian Y., Bond H. E., Panagia N., 2002, AJ, 123, 2666
- Perley & Butler (2008) Perley R. P., Butler B., 2008, in preparation
- Rauch (2003) Rauch T., 2003, A&A, 403, 709
- Roelfsema et al. (1991) Roelfsema P. R., Goss W. M., Zijlstra A., Pottasch S. R., 1991, A&A, 251, 611
- Sabin et al. (2007) Sabin L., Zijlstra A. A., Greaves J. S., 2007, MNRAS, 376, 378
- Schönberner et al. (2005) Schönberner D., Jacob R., Steffen M., 2005, A&A, 441, 573
- Seaquist (1991) Seaquist E. R., 1991, AJ, 101, 2141
- Terzian (1997) Terzian Y., 1997, in Habing H. J., Lamers H. J. G. L. M., eds, Planetary Nebulae, IAU Symp 180, p. 29
- Vassiliadis & Wood (1994) Vassiliadis, E., Wood, P. R. 1994, ApJS, 92, 125
- Walsh et al. (1997) Walsh J. R., Dudziak G., Walton N. A., 1997, in Habing H. J., Lamers H. J. G. L. M., eds, Planetary Nebulae, IAU Symp. 180, p. 286
- Williams (2007) Williams K. A., 2007, in Napiwotzki A., Burleigh M. R., eds, ASP Conf. Ser., 372, p.85
- Wolff et al. (2000) Wolff M. J., Code A. D., Groth E. J., 2000, AJ, 119, 302
- Zhang et al. (2005) Zhang Y., Liu X.-W., Luo S.-G., Péquignot D., Barlow M. J., 2005, A&A, 442, 249