Force networks and elasticity in granular silos
Abstract
We have made experimental observations of the force networks within a two-dimensional granular silo similar to the classical system of Janssen. Models like that of Janssen predict that pressure within a silo saturates with depth as the result of vertical forces being redirected to the walls of the silo where they can then be carried by friction. By averaging ensembles of experimentally-obtained force networks in different ways, we compare the observed behavior with various predictions for granular silos. We identify several differences between the mean behavior in our system and that predicted by Janssen-like models: We find that the redirection parameter describing how the force network transfers vertical forces to the walls varies with depth. We find that changes in the preparation of the material can cause the pressure within the silo to either saturate or to continue building with depth. Most strikingly, we observe a non-linear response to overloads applied to the top of the material in the silo. For larger overloads we observe the previously reported “giant overshoot” effect where overload pressure decays only after an initial increase [G. Ovarlez et al., Phys. Rev. E 67, 060302(R) (2003)]. For smaller overloads we find that additional pressure propagates to great depth. This effect depends on the particle stiffness, as given for instance by the Young’s modulus, , of the material from which the particles are made. Important measures include , the unscreened hydrostatic pressure, and the applied load. These experiments suggest that when the load and the particle weight are comparable, particle elasticity acts to stabilize the force network, allowing non-linear network effects to be seen in the mean behavior.
pacs:
45.70.-n,45.70.Cc,83.80.Fg,45.05.+xI Introduction
The physics of granular matter is of great interest both because of the enormous breadth of physical systems in the granular regime as well as the lack of a characterization of the granular state in fundamental terms. Although there has been some success understanding energetic granular gases in terms of kinematic models, dense granular materials continue to pose difficult problems. We consider dry granular matter at low humidity where there are no attractive forces between the constituent particles and the particles do not significantly interact with the interstitial fluid (air). Contact forces dominate dense granular materials in this regime, with each particle having several persistent contacts.
Coulomb’s law of friction is an inequality relating the magnitude of the friction force, to the normal force, , depending upon the mobilization of the friction. If is the static friction coefficient, then the mobilization is given by . For a non-moving contact the mobilization ranges from to and reflects both the direction in which the force of friction acts to resist motion and how close the forces acting on the contact are to causing motion in the opposite direction. Because the force of friction is dependent upon how the contact arose, the granular state is determined both by the positions of the particles and the history of how the particles came to be in these positions Vanel et al. (1999). Determining a statistical description of these contacts is at the core of understanding dense granular matter.
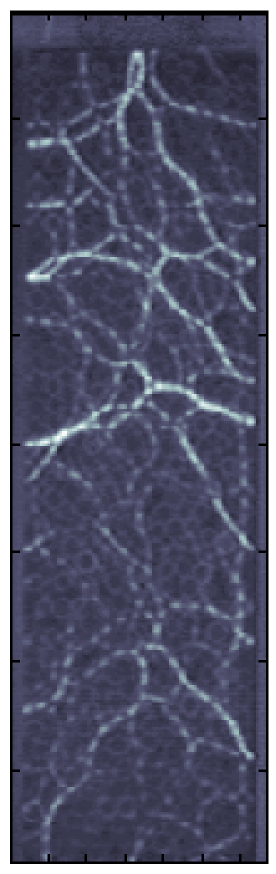
Grain-scale statistical descriptions are further complicated by the presence of force networks Vanel et al. (2000); Geng et al. (2003). An extraordinary feature of granular contact networks is that the distribution of forces on the contacts can be strongly inhomogeneous Mueth et al. (1998). Certain sequences of contacts carry forces with magnitude many times the mean for long distances along “force chains”. As shown in Fig. 1, force networks can develop to support the weight of the particles as well as any additional applied load.
Despite the difficulties inherent to understanding granular materials, phenomenological engineering models exist that describe the mean behavior well enough to allow for the design of granular storage facilities and handling processes. These models can provide useful tools for investigating granular materials. In particular, Janssen’s model of granular materials in vertical silos is interesting because it has been thoroughly tested, is realizable in the laboratory, and ultimately is viewed to be a working qualitative and even quantitative description of the mean behavior of granular matter Janssen (1895); Sperl (2006).
II The Janssen Model
Janssen treats the material in a silo as a continuum and considers horizontal slices, for which the difference of stress, the weight of the material in the slice, and the force of friction at the wall must be balanced vertically. Here we consider a quasi-two-dimensional silo, such as the one we use in the experiments reported below. Janssen assumes that the stress does not vary horizontally, allowing one to write for the case of a two-dimensional silo:
| (1) |
where and are the horizontal and vertical directions respectively, is an infinitesimal change in , is the stress tensor, is the density of material (mass per unit area), is the acceleration of gravity and is the width of the silo. The second term on the right-hand-side corresponds to the two frictional wall contacts — one at each side of the silo. Coulomb’s law of friction gives the shear stress at the wall in terms of the horizontal stress, for wall friction . Janssen further assumes that the vertical and horizontal normal stresses are linearly related to each other to write where represents both the mobilization of interparticle contact friction (with friction coefficient ) and the mobilization of friction at the walls. By considering the extremes of maximum upward and downward mobilization, it has been shown that Nedderman (1992).
Using Janssen’s relation for the shear stress in Eq. 1 allows us to rewrite it as a differential equation for :
| (2) |
If Janssen’s parameter is taken as a constant, then this equation permits exponential solutions of the form:
| (3) |
where is any load applied to the top of the system and
| (4) |
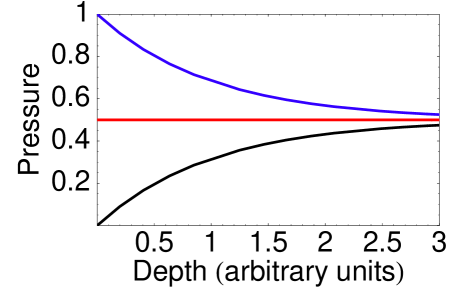
sets a length-scale for the evolution of stress with depth. As indicated by Fig. 2, the Janssen solution predicts that any overload will decay exponentially, and that the stress within the material will saturate with depth. This screening effect results from friction at the walls acting to carry the weight of the material and any overload. Although we have presented the two-dimensional version here, the Janssen model is qualitatively similar in three dimensions.
Janssen’s prediction of stress saturating with depth has been validated qualitatively in numerous three-dimensional experiments that examine the apparent weight of a confined granular pile. Though these experiments in effect only measured the forces at the bottom of the pile, by repeatedly varying the amount of material — and thus the height of the pile — a mean description of stress with depth was obtained Clément et al. (1997); Vanel and Clément (1999); Vanel et al. (2000); Ovarlez et al. (2003); Bertho et al. (2003, 2004). Large scale simulations of three-dimensional systems have also observed stress saturation Landry et al. (2003). In quasi-two-dimensional experimental systems that are similar to the analysis above, the saturation length scale has been found to scale with system size as predicted, Peralta-Fabi et al. (1997).
While qualitatively accurate, Janssen’s predictions have been shown to underestimate the actual value of saturated stress in a silo Vanel and Clément (1999). Careful analysis of stress profiles in experiments and simulations have shown that for small depths the profile is more linear than exponential Boutreux et al. (1997); Vanel and Clément (1999). These deviations from the Janssen model are not surprising, since key assumptions of the analysis can be shown to be incorrect.
For the Janssen model above we assumed that the redirection parameter was constant. For a cohesionless granular material, however, the ratio of the horizontal to vertical stress is constant only if the horizontal and vertical directions are the frame in which the stress tensor is diagonal Nedderman (1992). This is inconsistent, since Janssen assumes that there is a non-zero at the walls. If and are not the principal stresses, then we expect to vary horizontally and with depth.
Several factors contribute to variation in the redirection parameter with depth. In particular, it is difficult to achieve a uniform mobilization of friction at the walls. Experiments and simulations have shown that agreement with Janssen predictions can be obtained if the granular material is slowly lowered relative to the walls to make uniform the direction and extent of mobilization for all wall contacts Pitman (1998); Bertho et al. (2003); Landry and Grest (2004). The global packing fraction of the material has also been shown to alter the redirection parameter and it is reasonable to expect that local variations in packing fraction would produce variations with depth Ovarlez et al. (2003). Finally, experiments studying the stress within a silo of deformable beans, instead of the more rigid glass or metal balls typically used, have found that the redirection parameter varies with depth due to the elasticity of the particles Atewologun and Riskowski (1991).
More elaborate analysis of the Janssen model using stochastic differential equations to account for randomness in the mobilization of friction has shown that the Janssen model only correctly predicts the stress on the axis of the silo Pitman (1998). In general, the vertical stress at a given depth has been found to vary horizontally, further complicating the force balance analysis Nedderman (1992); Rusinek (2003). In three dimensions, attempts have been made to account for radial stress balance by using vertical force balance on concentric rings about the axis with the general result that force saturation due to screening by the walls is still expected, though the approach to the saturation value may not be exponential Lvin (1970).
Although screening-induced saturation has been validated, the behavior of overloads can be strikingly different from predictions. Instead of a monotonic, exponential decay to the saturated stress supported by the walls, a non-monotonic, “giant overshoot” has been observed experimentally Ovarlez et al. (2003); Ovarlez and Clément (2005). Even an overload equal to the saturated stress deep in the silo produces a local rise in the stress instead of the flat stress profile predicted by the Janssen model. This can in part be explained by local changes in the mobilization of friction and packing fraction of granular matter induced by placing an overload on the material.
To account for the overshoot effect and better fit experimentally observed stress profiles, a piece-wise model has been proposed that describes stress in a silo as hydrostatic - increasing linearly with depth - until a tunable depth where the stress then becomes exponential Boutreux et al. (1997); Vanel and Clément (1999). This piece-wise behavior arises out of the analysis for horizontally varying vertical stress and indicates the depth to which the stress at the top boundary penetrates Lvin (1970). Fitting experimental results to the piece-wise pressure profile corrects experiments that find unphysical values of the redirection parameter when the basic Janssen model is used Vanel and Clément (1999); Ovarlez et al. (2003).
In some experiments, a threshold for overloads has been observed that, when passed, causes the redirection parameter to increase Rusinek (2003). When the presence of force networks within granular silos is considered, the mechanism accounting for different overload profiles becomes clearer. Granular matter has been described as being in a “fragile” state. Along the directions in which there are pre-existing force chains, large loads can be supported. In other directions, only slight deformation of the interparticle contacts are allowed before the material must rearrange, forming new force chains Cates et al. (1998). To understand how a granular silo responds to overloads, we need to consider how the force network facilitates the redirection of stress to the walls, which is the goal of the present experiments.
Since the Janssen model is a continuum description that at least moderately successfully predicts stress saturation with depth, it is interesting to examine in what ways it gives an appropriate mean description of the forces within a granular material. It is equally interesting to determine how and why it fails Vanel et al. (1999); Ovarlez et al. (2001). For instance, various models of granular force propagation give different predictions of mean silo behavior Coppersmith et al. (1996); Socolar (1997); Vanel et al. (2000). Further experimental analysis of the silo system can serve to test these and future models of granular matter.
In our experiments, we use photoelastic particles to investigate how the preparation and properties of the granular material and the network of contact forces interact to redirect stress to the walls and determine the development of the stress profile with depth. We conduct experiments in a quasi-two-dimensional system that is described by the Janssen analysis above and has been shown to be similar to three dimensional systems in experiments and simulations Peralta-Fabi et al. (1997); Baxter (1997); Landry et al. (2004). Similar quasi-two-dimensional experiments have used photoelasticity in the past to examine the propagation of stress but did not test the Janssen model Baxter (1997); Geng et al. (2001, 2003). Rather than measure the apparent weight at the bottom of a three-dimensional pile, these photoelastic techniques allow us to examine the actual force network responsible for Janssen screening. We investigate the role of particle elasticity and force networks within silos by examining the mean response to overloads, by characterizing the properties of the force network, and by varying the elasticity of the particles.
III Methodology
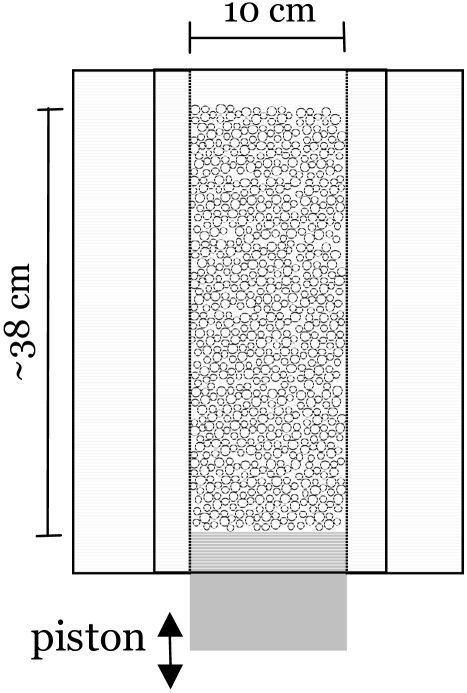
We study a quasi-two dimensional arrangement of photoelastic disks constrained vertically by two aluminum walls and on the faces by two transparent sheets to form a channel cm wide, as depicted in Fig. 3. To prevent ordering, we use a bi-disperse mixture of disks, with the larger disks approximately 20% larger. The silo is constructed so that there are movable pistons at the top and bottom of the silo. The pile rests upon the bottom piston, while loads can be applied to the top piston. A load applied to the top of the pile corresponds to a dyne/cm stress at the top. Both pistons can be pinned to prevent motion or unintended loading.
We measure the local disk-scale pressure, which we refer to as “stress” on our photoelastic disks using a technique similar to previous granular research from our group Geng et al. (2003). The bi-refringent disks display bright fringes in response to applied stress when illuminated between crossed polarizers. The density of fringes within a given disk is proportional to the stress within the disk. We determine the stress on a given disk by first calculating the gradient of an image of fringes. We take the square of the gradient averaged over multiple directions to be proportional to the number of fringes. We use an experimentally-obtained calibration to convert the squared gradient of the intensity into an equivalent load on a monolayer of disks and hence a single disk.
We performed experiments with two different silo/camera arrangements. In the first silo we use approximately disks — one quarter with diameter cm and the rest cm — resting upon a piston that is affixed to a stepper motor. A digital video camera is used to image the column at a rate of 30 frames/s while the piston supporting the pile is slowly lowered at a rate of hundredths of a grain diameter per second. We examine the sequence of images to find the first frame where an abrupt rearrangement of the force network is observed and take the frame before that as the moment that the friction of the grains at the walls is maximally mobilized upwards. We perform our analysis on this maximally mobilized frame. To prepare for each observation, a new force network is created by quickly forcing the lower piston upwards and then letting the entire pile rain downwards as the piston falls. Simulations have shown that granular piles created by ‘raining’ particles from above are independent of the rate at which grains are added Landry et al. (2003). To apply an overload we gently lower the upper piston onto the top of the pile before the pile is lowered by the stepper motor. The top layers of grains rearrange slightly as the overload is applied but the remainder of the particles maintain their relative positions.
In the second silo arrangement, approximately slightly smaller disks are used (an approximately 3:1 mixture of cm and cm disks). The lower piston rests upon a base that can be manually lowered a small distance. Without a fixed connection to a stepper motor, we are able to create new force networks by physically lifting the entire silo and flipping end-over-end. After the pile is lowered slightly to mobilize friction more uniformly, a high-resolution () digital still camera is used to take two pictures, one without polarization that can be used to find particle centers and one with polarization for obtaining force from photoelasticity. We can use this information to characterize the contact and force networks within the material. To investigate the influence of particle elasticity on these networks, we use disks made from two photoelastic polymers of different stiffness (Young’s modulus MPa for softer particles, MPa for harder particles). Both soft and hard disks are cm thick, and the material from which they are made has a density of .
For all figures, the standard error indicated by bars for mean quantities is determined using a ‘bootstrap’ algorithm where the mean of the quantity is calculated for each of randomized data sets constructed by selecting elements of the original data set at random with replacement Efron and Tibshirani (1991). The standard deviation of these means is taken to be the standard error.
IV Results
IV.1 Fixed Silo Method–Softer Particles
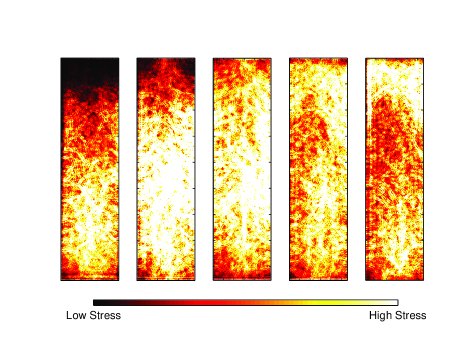
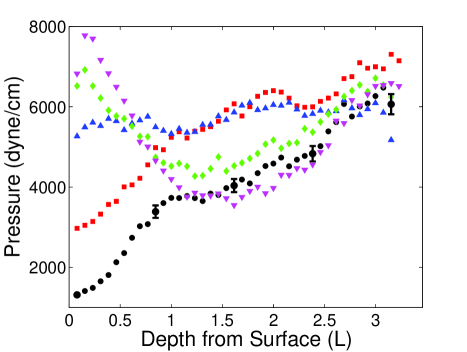
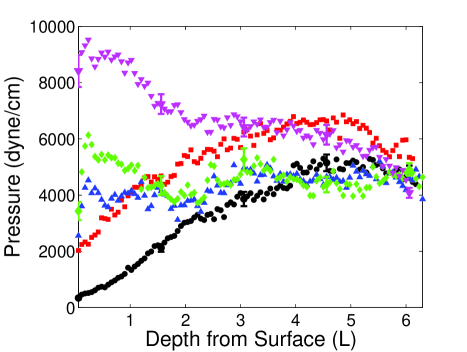
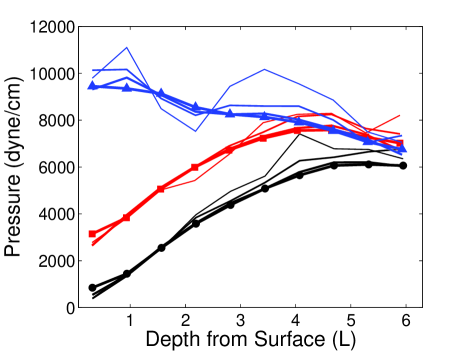
We first used the fixed silo and stepper-motor arrangement to observe unloaded force networks and networks each for four different overloads. Figure 4 shows the merged squared gradient images of these force networks, roughly depicting mean response. If we bin the responses across the width of the silo into horizontal slices the height of one particle, we can obtain a pressure profile with depth as in Fig. 5.
Considering first the case of the silo without an overload, we see distinctly non-Janssen behavior. Although the pressure initially seems to saturate with moderate depth, the pressure starts increasing again toward the bottom of the silo. This increase is also observed for all overloads applied to the top of the pile. This effect is at least partly due to the way that the preparation history affects the unloaded state. As seen in the left-most image of Figure 4, the mean stress is not constant across the layer at a given height, particularly near the bottom. This effect is presumably associated with the fact that when the piston pushes upwards, not all the particles are easily thrown upward, or that there is wall drag as the particles fall which affects their packing.
We next examined the response to four overloads in increments of roughly g (i.e. a two-dimensional stress of roughly dyne/cm). As shown in Fig. 5, for the two largest overloads a non-monotonic overshoot effect is observed. This behavior is similar to previous experiments Ovarlez et al. (2003); Ovarlez and Clément (2005) – after an initial increase in pressure at the top of the silo, the largest overloads are screened by arching and the pressure converges with the unloaded pressure profile with depth.
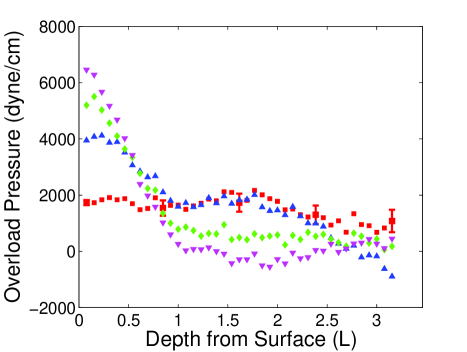
The behavior of the two smaller overloads is strikingly different from expected and previously-observed behavior. The additional pressure of small overloads persists with depth and is not screened by wall friction. The difference between large and small overloads is clear in Fig. 6, where the unloaded pressure profile has been subtracted from the four loaded pressure profiles. Deep within the pile, the additional pressure of two larger overloads decays to zero, while the pressure from the smaller two loads persists.
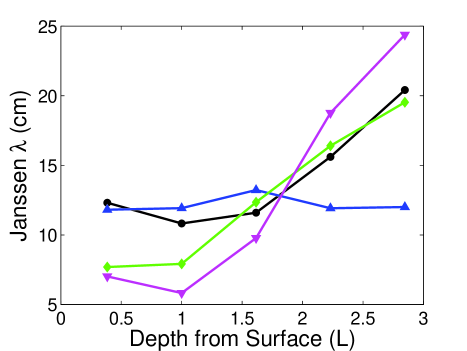
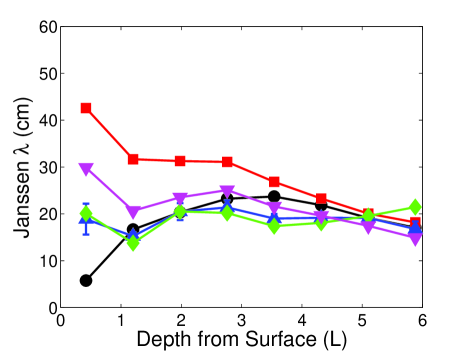
Given the non-monotonic, and sometimes non-saturating behavior of the observed pressure profiles, it is not surprising that the Janssen length-scale varies with depth, as indicated in Fig. 7. Using our data, we estimate numerically as:
| (5) |
where is the density of the photoelastic material, is the packing fraction in the silo, is the horizontally-binned pressure and is estimated numerically using local quadratic fits to . Since varies as the inverse of the redirection parameter , this result indicates that the assumption that is constant with depth within our system is incorrect. Though the scatter in the pressure profile for g introduces substantial noise into the calculation of , hence this data is omitted, we see that the variation of with depth is roughly similar for both unloaded and loaded silos. This indicates that the previously-observed load-induced variation in is not responsible for variation in load propagation Rusinek (2003).
Though Janssen’s varies with depth, we can still investigate if behaves as a depth-dependent redirection parameter might be expected to behave. In Fig. 8, we calculate as a function of depth for the ensemble of unloaded networks, and the ensembles for overloads just above and below the transition from deep-propagation to screening. We compare the network in the first image of our lowering sequence, corresponding to the initial network before the pile has been lowered to change mobilization, to the network in the subsequent image where we assume friction is maximally mobilized. Since varies as the inverse of the mobilization , the observed decrease in after lowering the pile indicates that we have increased the mobilization. The mobilization does not change significantly at the top of the pile, indicating that our lowering technique does not uniformly effect the pile. The difference between initial and mobilized frames is similar for both small, deep-propagating overloads and large, decaying overloads.
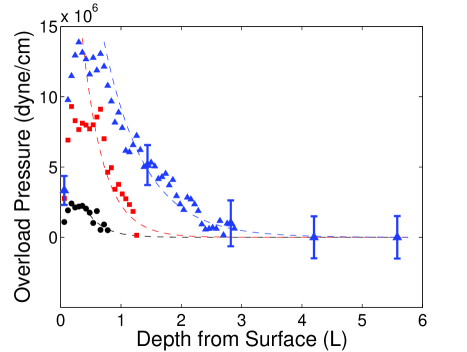
We note four important differences between the pressure profiles in Fig. 5 and those predicted by Janssen-like models, e.g. Fig. 2: , and hence , is not constant; pressure from larger overloads first increases with depth before decaying; overall pressure does not seem to saturate with depth; and most strikingly, pressure from small overloads does not decay. The first two differences have been observed previously and are not surprising, given the previously discussed drawbacks of Janssen’s analysis Atewologun and Riskowski (1991); Ovarlez et al. (2003); Ovarlez and Clément (2005). To better understand the lack of overall pressure saturation, we conducted experiments in our second apparatus that allowed the particles to be rained from above, rather than pushed from the bottom. As shown in Fig. 9 we found that the second preparation procedure did create pressure profiles that saturate with depth. The largest overload is observed to overshoot before decaying and the smallest load propagates to great depth.
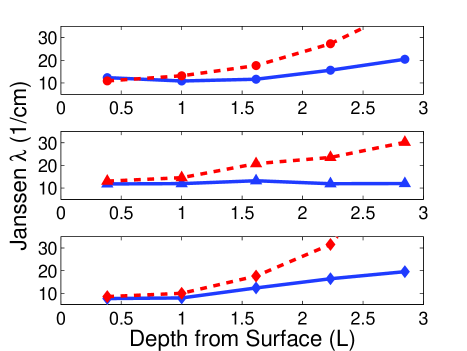
Numerically determining the Janssen screening-length for the saturating pressure profiles via Eq. 5 indicates that after an initial transient, the length-scale actually converges to a constant value of roughly cm with depth, as in Fig. 10. This implies a nominal value of . Interestingly, the for the moderate overloads are the flattest, while the screening length converges from a larger value for the larger overloads and from a smaller value for the silo with no overload and the smaller deep-penetrating g overload. The non-constant value for the unloaded case may be due to several causes. One may be an underestimation of the small forces at the top of our pile when using our gradient method to calibrate photoelastic fringes. Alternatively, the variation at the top of the pile may be explained as a combination of both preparation — the act of placing an overload at the top — and non-uniform response to lowering the pile with depth. These two factors may also account for the giant overshoot effect seen for the large overload.
IV.2 Silo Flipping Method–Softer and Harder Particles
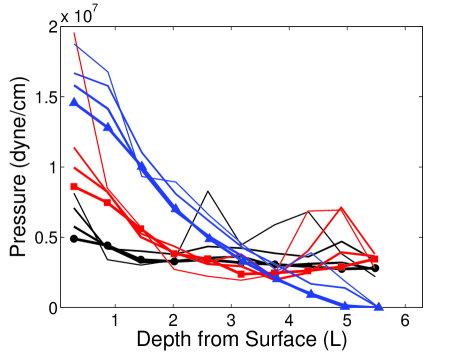
We then used the silo flipping preparation to examine both the effect of preparation and of changing the elasticity of the particles, from Young’s modulus MPa to MPa. For the harder photoelastic material, the sensitivity to applied stress was lower, with the result that the stress due to gravity was not visible even at great depth in the silo. In this case, any pressure profile is effectively an overload decay profile, since there is no unloaded profile to subtract. As shown in Fig. 11, the additional pressure due to the overloads decays with depth after overshooting for all three cases. For all three overloads, the mean pressure eventually drops below the range of observable sensitivity, though large fluctuations about the mean were still present. All three cases can be fit with exponentials if the initial overshoot is neglected. Since the non-decaying, deep-penetrating overloads for the softer particles were close to the saturation pressure, it is not possible to determine whether or not such effects are present in the harder particles using our method.
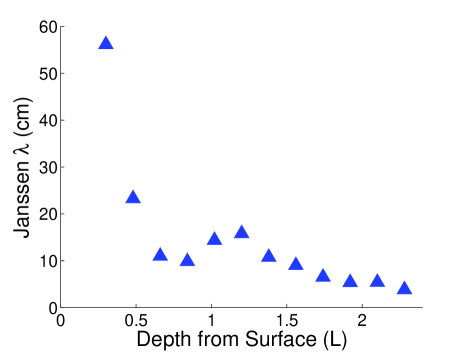
Determining the Janssen screening length-scale numerically for the hard particle overloads was problematic since the pressure profiles eventually decayed below the sensitivity of the hard photoelastic material. In Fig. 12, we show the calculated for the largest, g overload in the top third of the silo. What we see is qualitatively similar to the behavior of the largest overload in Fig. 10 — approaches a constant value from above. Surprisingly, although the system geometry is the same, the screening length is roughly half of what was found for the soft ( MPa) particles used to obtain the first two pressure profiles (Fig. 5 and Fig. 9).
The two sets of experiments nominally contrast soft and hard particles. However, there is another aspect which may be at least as important as granular elasticity. We note that the ratio of the applied loads to the Young’s modulus, , are comparable for the hard and the soft material. For the maximum load on the softer particles, , this ratio is and for the maximum load on the harder particles, , this ratio is . Thus, in appropriately scaled terms the loads are comparable in both cases, and hence on this basis, elasticity cannot explain the difference in the experimental observations. However, the ratio of the applied load to the weight of the material is significantly different in the two cases, namely about 0.5 for the soft particles, and 17 for the hard particles. Thus, we conclude that for the softer particles, the loads are not large enough to overcome the effects caused by gravitational loading, which necessarily reflects the preparation history.
IV.3 Horizontal Variations and Fluctuations
It is also interesting to investigate various other aspects of the force profiles which differ from the usual Janssen picture. In particular, we consider horizontal variability of the forces, and also force fluctuations. In this regard, we note model studies by Pitman which exhibited horizontal dependence on fluctuations and stress within granular silosPitman (1998) due to inhomogeneous mobilization of friction.
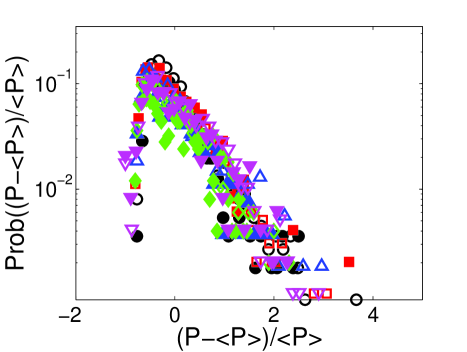
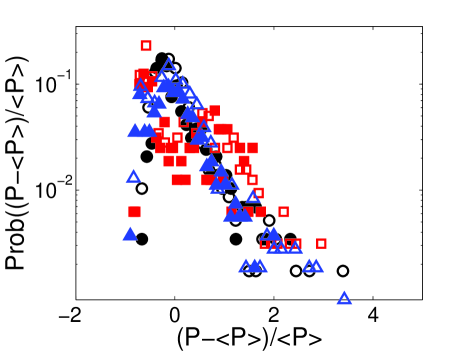
As shown in Fig. 13, we measured the local deviation from the mean pressure at a given height for both the center and sides of the silo for all overloads for both hard and soft particles. We did not see significant horizontal variation in the distributions, and for the soft particles the distributions were nearly identical for all cases and very reminiscent of force distributions observed for other granular systems Majmudar and Behringer (2005). Forces below the mean fall off quickly, while forces larger than the mean tail off slowly, and roughly follow an exponential.
Recent simulations for vertical granular matter with periodic boundary conditions (in the horizontal directions) have indicated that the averaging length-scale sufficient to determine the mean pressure is possibly as small as a grain diameter Goldenberg et al. (2006). Though our geometry has side walls, it is still worthwhile to determine the length over which we must average for the pressure profile to converge. To do this, we determine a grid of points within the silo and average the pressure within a tunable radius to assign a pressure to that point. In Fig. 14, we plot the pressure in the middle of the silo (on axis) with depth as determined by averaging over regions with radii of , , and small particle diameters. For the two larger averaging regions, the profiles converge to those observed using horizontal binning by depth in Fig. 9. This convergence indicates a correlation length-scale between and particle diameters — approximately the same as the Janssen screening length-scale obtained numerically. This is interesting since in this instance, the macroscopic scale of the Janssen parameter is comparable to the averaging scale, even though the Janssen model does not include particle size. As can be seen for the lower image in Fig. 14, the the effect of averaging length is roughly the same regardless of particle stiffness.
An additional aspect of interest is the geometric nature of the contacts. Relevant quantities include the packing fraction, , the number of contacts per particle, , and clustering coefficient, defined below.
With our second preparation procedure, we are able to obtain to obtain all of these quantities. We do this by capturing both polarized images showing the force network within the photoelastic disks and unpolarized images showing the locations of those particles. Particle centers can be identified using a convolution with separate kernels for the two particle sizes. We then use a numerical algorithm to reject overlapping particles and identify neighbor particles in contact with each particle based upon the geometric consideration that the distance between two particles must be equal to the sum of their radii. This allows us to determine a local packing fraction throughout the silo.
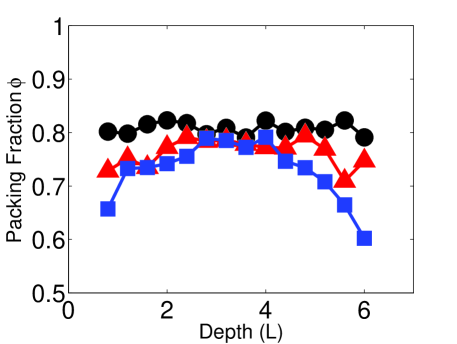
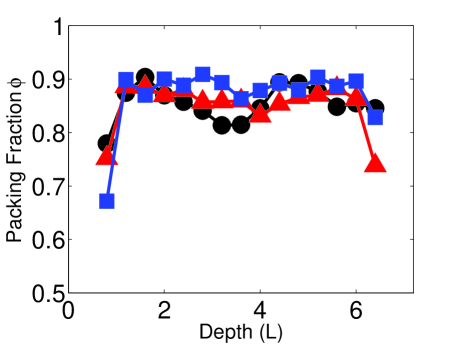
Since previous studies have shown that the packing fraction of a pile relates to the redirection parameter, we investigate depth-dependent variations of the packing fraction Ovarlez et al. (2003). Due to the dilation of the material, we find that the packing fraction is slightly lower for loaded silos for the depths available in the unloaded case. We do not find systematic correlation between the packing fraction and the screening length-scale.
The particle locations and contacts comprise a contact network for each pile. Analyzing these contact networks allows the determination of graph and network properties such as the average number of contacts per particle, . We can also determine the ‘clustering coefficient’, which gives a measure of how tightly interconnected is the network Watts and Strogatz (1998). For each particle we consider the neighboring particles with which that particle is in contact. There are possible neighbor-neighbor contacts for round particles in two dimensions, so we define the clustering coefficient as the ratio of the actual contacts present between those neighbors to the possible contacts, .
For each contact network, we can determine a subset of contacts for which the particle-scale pressure is greater than the mean for the whole silo. This subset of contacts can be thought of as roughly comprising a force network, for which the same graph and network properties as the contact network can also be calculated Wambaugh (2006).
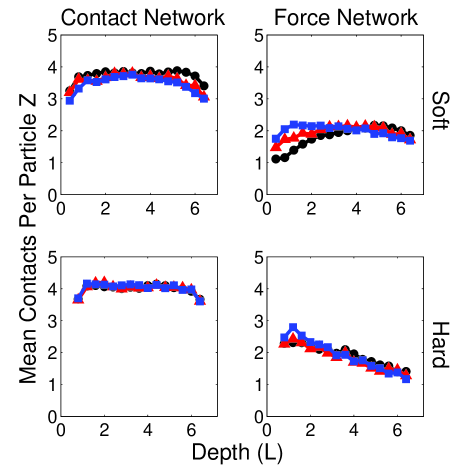
We first examine the dependence of the mean number of contacts per particle with depth for both the overall contact network and the force network. As shown in Fig. 16, we find that for the contact network, the number of contacts is nearly independent of overload and constant with depth at a value close to , the typically observed coordination number for a disordered granular material, although slightly lower due to the presence of the walls Roux and Hansen (1989). The average number of contacts in the force network is slightly less than to two, which is not surprising since many particles in a chain have only two contacts and, in our relative small silo, many particles make contact with the walls.
Significantly, for the force network within both the hard and soft particles, the average number of contacts at the top of the pile varies depending upon the overload, before converging with depth, unlike the contact network which does not vary with overload. This indicates that the force network is quantitatively different, depending upon the size of the applied overload. For the deep-penetrating overload on the soft particles, the mean number of contacts at the top is closest to the saturation value, perhaps indicating that the structure of the force network is made visible by the additional pressure, but is not disturbed as in the case of larger overloads.
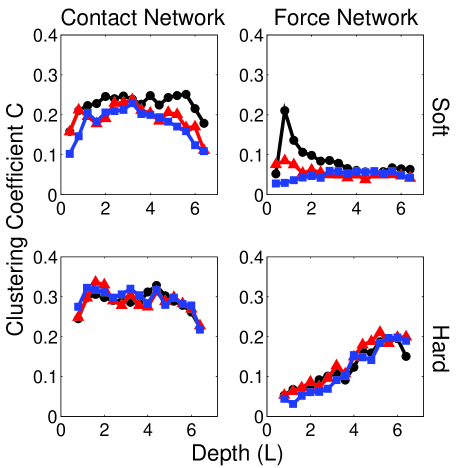
For the clustering coefficient, Fig. 17 shows the contact network to be better connected than the force network. As with the number of contacts, the clustering coefficient is roughly constant for the contact network but varies with depth for the force network. For hard particles, the overloads do not seem to alter the clustering coefficient of the contact or force network.
The differences between the contact and force networks may indicate an explanation for the deep propagation of small overloads. If the material within a silo can be characterized as fragile matter, then we expect that it will have the ability to support forces along the force chains that are present, but that the force network will have to rearrange to support forces along normal directions Cates et al. (1998) or to carry large loads. This is borne out for our softer particles which are more photoelastically sensitive. We observe deep-penetrating response for small loads for which there is only slight deformation of the network, while larger loads rearrange the force network, resulting in Janssen screening.
V Conclusion
For elastic particles in granular silos, we observe a non-linear response as we vary the size of overloads placed upon the material at the top of the silo. For sufficiently small overloads, the pre-existing contact network conveys additional pressure deep into the pile, contrary to the classical Janssen description. For larger overloads we find that the force network rearranges, creating frictional arches braced against the walls that act to screen the depths of the silo from the additional pressure. Though the Janssen model predicts monotonic saturation, we find that the pressure initially increases with depth before decaying — the giant overshoot phenomenon Ovarlez et al. (2003).
By numerically evaluating the Janssen length-scale we find that it is not constant, meaning that the simple integration typically used to derive pressure profile predictions from force balance is inadequate in our experiments, and therefore quite likely in general. We find that there is a different Janssen length-scale at the top of the pile, possibly corresponding to changes in mobilization resulting from placing the overload onto the material.
We find that the pressure profile is sensitive to preparation, and that this sensitivity depends on both loading and particle stiffness. The greatest dependence on history occurs when the magnitudes of gravitational loading and the applied loading are commensurate. This situation occurs for our softer particles, for which we apply a maximum load that corresponds to roughly half the weight of the particles. For our harder particles, which have weight comparable to our softer particles, all applied loads significantly exceed the particle weight. Such loads lead to particle deformations comparable to the soft case, but the observed non-linear behavior of the profiles is substantially less.
We find that distributions for the particle-scale pressure are similar to those observed for local force measures in other granular systems. Specifically, there is a roughly exponential decay of the distributions at large pressures. There is a peak in the distributions near the mean, and a rapid fall off below the mean. In general, we find that force networks exhibit fluctuations with a length-scale comparable to the width of the silo.
Acknowledgements
We appreciate work by Evelyne Kolb in the initial states of this research. Additionally, we thank Annie Thebprasith, Trush Majmudar, Brian Tighe, and Karen Daniels for help developing the instrumentation and many useful discussions. This research was funded by National Science Foundation grants DMR-0137119, DMR-0555431, DMS-0204677, and NASA grant NNC04GB08G.
References
- Vanel et al. (1999) L. Vanel, D. Howell, D. Clark, R. P. Behringer, and E. Clément, Physical Review E 60, R5040 (1999).
- Vanel et al. (2000) L. Vanel, P. Claudin, J.-P. Bouchaud, M. E. Cates, E. Clément, and J. P. Wittmer, Physical Review Letters 84, 1439 (2000).
- Geng et al. (2003) J. Geng, G. Reydellet, E. Clément, and R. P. Behringer, Physica D 182, 274 (2003).
- Mueth et al. (1998) D. M. Mueth, H. M. Jaeger, and S. R. Nagel, Physical Review E 57, 3164 (1998).
- Janssen (1895) H. A. Janssen, Zeitschr. d. Vereines deutscher Ingenieure 39, 1045 (1895).
- Sperl (2006) M. Sperl, Granular Matter 8, 59 (2006).
- Nedderman (1992) R. Nedderman, Statics and Kinematics of Granular Materials (Cambridge University Press, 1992).
- Ovarlez et al. (2003) G. Ovarlez, C. Fond, and E. Clément, Physical Review E 67, 060302(R) (2003).
- Bertho et al. (2003) Y. Bertho, F. Giorgiutti-Dauphiné, and J.-P. Hulin, Physical Review Letters 90, 144301 (2003).
- Vanel and Clément (1999) L. Vanel and E. Clément, European Physical Journal B 11, 525 (1999).
- Bertho et al. (2004) Y. Bertho, T. Brunet, F. Giorgiutti-Dauphiné, and J.-P. Hulin, Europhysics Letters 67, 955 (2004).
- Clément et al. (1997) E. Clément, Y. Serero, J. Lanuza, J. Rajchenbach, and J. Duran, in Powders and Grains, edited by R. P. Behringer and J. T. Jenkins (1997), pp. 349–351.
- Landry et al. (2003) J. W. Landry, G. S. Grest, L. E. Silbert, and S. J. Plimpton, Physical Review E 67, 041303 (2003).
- Peralta-Fabi et al. (1997) R. Peralta-Fabi, C. Málaga, and R. Rechtman, in Powders and Grains, edited by R. P. Behringer and J. T. Jenkins (1997), pp. 227–230.
- Boutreux et al. (1997) T. Boutreux, E. Raphaël, and P. G. de Gennes, Physical Review E. 55, 5759 (1997).
- Pitman (1998) E. B. Pitman, Physical Review E 57, 3170 (1998).
- Landry and Grest (2004) J. W. Landry and G. S. Grest, Physical Review E 69, 031303 (2004).
- Atewologun and Riskowski (1991) A. O. Atewologun and G. Riskowski, Transactions of the ASAE 34, 2193 (1991).
- Rusinek (2003) R. Rusinek, Research in Agricultural Engineering 49, 61 (2003).
- Lvin (1970) J. B. Lvin, Powder Technology 4, 280 (1970).
- Ovarlez and Clément (2005) G. Ovarlez and E. Clément, European Physical Journal E 16, 421 (2005).
- Cates et al. (1998) M. E. Cates, J. P. Wittmer, J.-P. Bouchaud, and P. Claudin, Physical Review Letters 81, 1841 (1998).
- Ovarlez et al. (2001) G. Ovarlez, E. Kolb, and E. Clément, Physical Review E 64, 060302(R) (2001).
- Coppersmith et al. (1996) S. N. Coppersmith, C.-h. Liu, S. Majumdar, O. Narayan, and T. A. Witten, Physical Review E 53, 4673 (1996).
- Socolar (1997) J. E. S. Socolar, Physical Review E 57, 3204 (1997).
- Baxter (1997) G. W. Baxter, in Powders and Grains, edited by R. P. Behringer and J. T. Jenkins (1997), pp. 345–348.
- Landry et al. (2004) J. W. Landry, G. S. Grest, and S. J. Plimpton, Powder Technology 139, 233 (2004).
- Geng et al. (2001) J. Geng, D. Howell, E. Longhi, R. P. Behringer, G. Reydellet, L. Vanel, E. Clément, and S. Luding, Physical Review Letters 87, 035506 (2001).
- Efron and Tibshirani (1991) B. Efron and R. Tibshirani, Science 253, 390 (1991).
- Majmudar and Behringer (2005) T. S. Majmudar and R. P. Behringer, Nature 435, 1079 (2005).
- Goldenberg et al. (2006) C. Goldenberg, A. P. F. Atman, P. Claudin, G. Combe, and I. Goldhirsch, Physical Review Letters 96 (2006).
- Watts and Strogatz (1998) D. J. Watts and S. H. Strogatz, Nature 393, 440 (1998).
- Wambaugh (2006) J. F. Wambaugh, cond-mat/0603314 (2006).
- Roux and Hansen (1989) S. Roux and A. Hansen, in Powders and Grains, edited by J. Biarez and R. Gourvés (1989), pp. 249–254.