PHASE STRUCTURE, CRITICAL POINTS,
AND SUSCEPTIBILITIES IN NAMBU-JONA-LASINIO TYPE MODELS
Abstract
We investigate the chiral phase transition at finite temperature and chemical potential within SU(2) and SU(3) Nambu-Jona-Lasinio type models. The behavior of the baryon number susceptibility and the specific heat, in the vicinity of the critical end point, is studied. The class of the critical points is analyzed by calculating critical exponents.
1 Introduction
Strongly interacting matter at non-zero temperature and chemical potential is an exciting topic for physicists coming from different areas, either theoretical or experimental. One of the main goals in the heavy-ion physics program nowadays is to study the effects of several macroscopic phenomena occurring under extreme conditions. The discussion about the existence of a tricritical point (TCP) or a critical end point (CEP) is also a topic of recent interest. As is well known, a TCP separates the first order transition at high chemical potentials from the second order transition at high temperatures. If the second order transition is replaced by a smooth crossover, a CEP which separates the two lines is found. At the CEP the phase transition is of second order and probably falls into the same universality class of the three-dimensional Ising model. The existence of the CEP in QCD was suggested at the end of the eighties[1], and its properties in the context of several models have been studied since then[2, 3, 4]. The most recent lattice results with staggered quarks of physical masses indicate the location of the CEP at and [5], however its exact location is not yet known.
This point of the phase diagram is the special focus of the present contribution. Nambu-Jona-Lasinio (NJL) type models are used and the main goal is to locate the critical end point and confront the results with universality arguments.
We remark that most of the work done in this area has been performed with non strange quarks only. We will discuss the class of the critical points by including the analyzes in the chiral limit of both SU(2) and SU(3) versions of the NJL model.
Using a standard hadronization procedure[8, 9], the baryonic thermodynamic potential, , is obtained directly from the effective action. The baryon number susceptibility and the specific heat describe, respectively, the response of the baryon density and the entropy with respect to the chemical potential and the temperature :
| (2) |
These physical quantities are relevant observables to be studied in the context of possible signatures for chiral symmetry restoration.
Our model of strong interacting matter can simulate regions of a hot and dense fireball created in a heavy-ion collision. Since electrons and positrons are not involved in the strong interaction, we impose the condition . So, we naturally get the chemical equilibrium condition that will be used.
After this presentation of the model, we discuss the phase diagrams in sec. 2. The behavior of the baryon number susceptibility and the specific heat in the plane around the CEP is studied in sec. 3, as well as the corresponding critical exponents. Finally, we conclude in sec. 4 with a brief summary of our results.
2 Phase diagrams in SU(2) and SU(3) NJL models
In this section we analyze the phase diagrams in different conditions in the plane. Depending on the number of quark flavors or , and on the masses of the quarks, different situations can occur and the transition from hadronic matter to QGP may be of first order, second order, or a crossover transition.
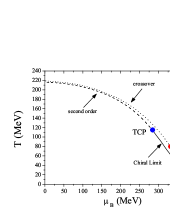
We start by analyzing the differences between the three-flavor NJL model and its simpler version in the SU(2) sector. The phase diagrams for both models are presented in fig. 1 as a function of and .
Concerning the SU(2) model, and using physical values of the quark masses, MeV, together with MeV and , we find that the CEP is localized at MeV and MeV. We verified that, in the chiral limit, the transition is of second order at and, as increases, the line of second order phase transition will end in a first order line at the TCP. The TCP is located at MeV and MeV.
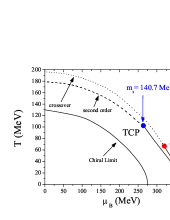
For the SU(3) NJL model, also in the chiral limit (), we verify that the phase diagram does not exhibit a TCP: chiral symmetry is restored via a first order transition for all baryonic chemical potentials and temperatures (see right panel of fig. 1). This pattern of chiral symmetry restoration remains for and . In our model we found MeV for [4]. When , at , the transition is second order and, as increases, the second order line will end in a first order line at the TCP. The TCP for MeV is located at MeV and MeV. If we choose , instead of second order transition we have a smooth crossover which critical line will end in the first order line at the CEP. Using the set of parameters[7, 9]: MeV, MeV, , and MeV, this point is localized at MeV and MeV.
We point out that both situations are in agreement with what is expected at [10]: the phase transition in the chiral limit is of second order for and first order for .
3 Susceptibilities and critical exponents in the vicinity of the CEP
The phenomenological relevance of fluctuations around the CEP/TCP of QCD has been recognized by several authors.
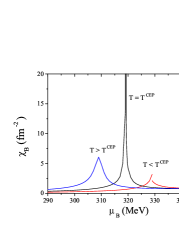
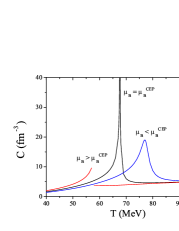
In the left panel of fig. 2, the baryon number susceptibility is plotted for three different temperatures around the CEP. For temperatures below the phase transition is first order and, consequently, has a discontinuity. For the susceptibility diverges at (the slope of the baryon number density tends to infinity). For temperatures above , in the crossover region, the discontinuity of disappears at the transition line. A similar behavior is found for the specific heat for three different chemical potentials around the CEP, as we can observe from the right panel of fig. 2. These calculations have been performed in the SU(3) NJL model, but the same qualitative behavior can be found in the SU(2) NJL version[4].
Summarizing, the baryon number susceptibility and the specific heat diverge at and , respectively.[2, 3, 4] In order to make this statement more precise, we will focus on the values of a set of indices, the so-called critical exponents, which describe the behavior near the critical point of various quantities of interest (in our case and are the critical exponents of and , respectively). If the critical region of the CEP is small, it is expected that most of the fluctuations associated with the CEP will come from the mean field region around the CEP[2].
To a better understanding of the critical behavior of the system, we also analyze what happens in the SU(2) NJL model.
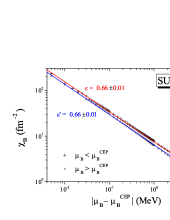
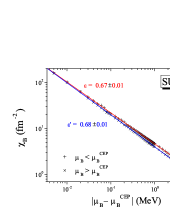
To obtain the critical exponent ) for the baryon number susceptibility, we will consider a path parallel to the -axis in the plane, from lower (higher) towards the critical , at fixed temperature . To this purpose we consider a linear logarithmic fit of the type , where the term is independent of .
The values presented in fig. 3 for these critical exponents, calculated in both SU(2) and SU(3) NJL models, are consistent with the mean field theory prediction . This means that the size of the region is approximately the same independently of the direction of the path parallel to the -axis.
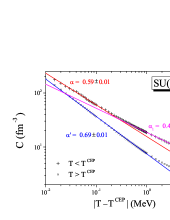
Paying now attention to the specific heat around the CEP, we have used a path parallel to the -axis in the plane from lower/higher towards at fixed . In fig. 4 we plot as a function of close to the CEP in a logarithmic scale for both SU(2) and SU(3) calculations. In this case we use a linear logarithmic fit, , where the term is independent of .
Starting with the SU(2) case, we observe (see left panel of fig. 4), for , that the slope of the fitting of data points changes for around MeV. So we have a change from the critical exponent to . As pointed out in[2], this change of the exponent can be interpreted as a crossover of different universality classes, with the CEP being affected by the TCP. It seems that the effect of the hidden TCP on the CEP is relevant for the specific heat contrarily to what happens to .
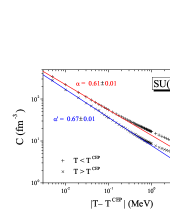
We also observe that there is no clear evidence of change of the slope of the fitting of data points in the three-flavor NJL model (see fig. 4, right panel). In fact, now we only obtain a critical exponent when the critical point is approached from below. When the critical point is approached from above the trivial exponent is obtained.
To justify the possible effect of the hidden TCP on the CEP, as suggested in[2, 3], we analyze the behavior of the specific heat around the TCP. We find nontrivial critical exponents and , for SU(2) and SU(3) cases, respectively. This result, in spite of being close, is not in agreement with the respective mean field value (). However, they can justify the crossing effect observed. We notice that the closest distance between the TCP and the CEP in the phase diagram occurs in the T-direction (), and is more clear in the SU(2) case.
4 Summary
We verified that our model calculation reproduces qualitative features of the QCD phase diagram at : for the chiral transition is second-order for and first-order for . Using realistic values for the current quark masses we find the location of the CEP in both SU(2) and SU(3) NJL models.
It was shown that the baryon number susceptibility and the specific heat diverge at the CEP. The critical exponents for around the CEP, in both and NJL models, are consistent with the mean field values . For the specific heat, the nontrivial values of () around the CEP can be interpreted as a crossover from a mean field tricritical exponent () to an Ising-like critical exponent ().
A better insight to the difficult task of the analysis of the phase diagram of QCD can be provided by an extension of the NJL model where quarks interact with the temporal gluon field represented by the Polyakov loop dynamics.
Acknowledgments
Work supported by grant SFRH/BPD/23252/2005 from F.C.T. (P. Costa), Centro de Física Teórica and FCT under project POCI 2010/FP/63945/2005.
References
- 1 . M. Asakawa et al, Nucl. Phys. A 504, 668 (1989).
- 2 . Y. Hatta et al, Phys. Rev. D 67, 014028 (2003).
- 3 . B.-J. Schaefer et al, Phys. Rev. D 75, 085015 (2007).
- 4 . P. Costa et al, Phys. Lett. B 647,431 (2007); P. Costa et al, arXiv:0801.3417v1 [hep-ph].
- 5 . Z. Fodor et al, J. High Energy Phys. 0204, 050 (2004).
- 6 . T. Hatsuda et al, Phys. Rept. 247, 221 (1994).
- 7 . P. Rehberg et al, Phys. Rev. C 53, 410 (1996).
- 8 . P. Costa et al, Phys. Rev. C 70, 025204 (2004).
- 9 . P. Costa et al, Phys. Rev. D 70, 116013 (2004); Phys. Rev. D 71, 116002 (2005); Phys. Lett. B 560, 171 (2003); Phys. Lett. B 577, 129 (2003).
- 10 . R.D. Pisarski et al, Phys. Rev. D 29, 338 (1984).