The Age of Cluster Galaxies from Continuum Colors
Abstract
We determine the age of 1,104 early-type galaxies in eight rich clusters ( to ) using a new continuum color technique. We find that galaxies in clusters divide into two populations, an old population with a mean age similar to the age of the Universe (12 Gyrs) and a younger population with a mean age of 9 Gyrs. The older population follows the expected relations for mass and metallicity that imply a classic monolithic collapse origin. Although total galaxy metallicity is correlated with galaxy mass, it is uncorrelated with age. It is impossible, with the current data, to distinguish between a later epoch of star formation, longer duration of star formation or late bursts of star formation to explain the difference between the old and young populations. However, the global properties of this younger population are correlated with cluster environmental factors, which implies secondary processes, post-formation epoch, operate on the internal stellar population of a significant fraction of cluster galaxies. In addition, the mean age of the oldest galaxies in a cluster are correlated with cluster velocity dispersion implying that galaxy formation in massive clusters begins at earlier epochs than less massive clusters.
1 INTRODUCTION
The age of the stars in a galaxy is a key parameter not only to cosmological models (i.e. the epoch of initial star formation being a lower limit to the age of the Universe), but also to our understanding of the star formation history of galaxies. The age of stellar populations in galaxies guides our understanding of likely formation scenarios, e.g. monolithic versus hierarchical models (Kauffmann, White & Guiderdoni 1993). However, even if a galaxy’s stellar population age is decoupled from the formation epoch, the history of star formation and chemical evolution are determined primarily by the age of the stars and this value still serves as one of the most important variables in understanding galaxy evolution (Tinsley 1980).
Of course, since Nature is cruel (de Sade 1797), by far the hardest parameter to extract from a galaxy’s spectral energy distribution is the age of the underlying stellar population. The reason is mostly technical, in that there is no single color or spectral index that uniquely measures age (as derived from the turnoff point for the stellar population). Thus, one is required to deduce a mean age based on a series of observables, such as the combined Fe versus index (Worthey 1994) or versus optical colors (Kaviraj et al. 2006), guided by synthetic models based on stellar physics. These models have only recently achieved a necessary level of success to transform from isochrone fits to synthetic colors, i.e. all the relevant stellar physics is correctly incorporated (Yi et al. 2003, Schiavon 2007).
Techniques to measure metallicity and age have divided into two paths, use of line indices (e.g. the Lick/IDS system, Gonzalez 1993, Trager et al. 2000) versus continuum colors (Rakos & Schombert 2005). These two techniques are, effectively, attempting to determine age and metallicity through slightly different astrophysical phenomenon. Line indices can trace the metallicity of a system by directly measuring the abundance of various element lines (although still influenced by the age of the system, Trager et al. 2000). Early work (Burstein et al. 1984) focused on easily measurable lines such as Mg2 and Ca and (Faber 1973). These individual lines contain a wealth of information on the chemical history of stellar populations and the process of nucleosynthesis (Pagel 2001). However, extracting the mean metallicity of a stellar population, as expressed by [Fe/H], can be problematic if the ratio of these elements to Fe varies. For example, Type Ia SN produce more Fe to elements than Type II, but require over 1 Gyr to evolve to the detonation stage such that the /Fe ratio decreases with time (Maraston et al. 2003). Thus, models which do not include these ratio variations risk incorrect estimates for color and line indice changes. Improved technology has meant that, for a large number of galaxies, the relevant metallicity value, e.g. [Fe/H], can be determined directly from Fe lines themselves (e.g. Fe4383 and Fe5015, Gonzalez 1993, Trager et al. 2000, Sánchez-Blázquez et al. 2006). As Fe is the primary source of electrons in stellar atmospheres, it is a trivial conversion from [Fe/H] to total metallicity, or [M/H].
Age is determined in line indice studies, primarily, through the index (see Schiavon 2007 for a detailed discussion). While this age determination is still model dependent, the separation in parameter space is clear (e.g. MgFe versus ). Notably, in contrast to our expectation of old stellar populations from interpretation of the color-magnitude relation (Faber 1973), line indices studies find a high fraction of early-type galaxies with young ages (less than 7 Gyrs) in agreement with certain CDM frameworks for galaxy formation (Kauffmann, White & Guiderdoni 1993) that predict extended star formation histories (Kuntschner & Davies 1998, Trager et al. 2000). Later re-analysis, with refined spectral energy distribution (SED) models, finds that only 25% of the galaxies in previous samples have ages less than 7 Gyrs (Schiavon 2007). However, even this fraction is unexpectedly high given the tightness of the color-magnitude relation and the expected increased scatter due to the influence of age on color (Bower et al. 1992).
Narrow band continuum colors, used in this work, approach the age and metallicity determination problem from a different direction. They measure the effects of metallicity, in composite stellar populations, by the change in color of the red giant branch (RGB) with [Fe/H]. Age effects are measured by color changes produced in the shifting of the turnoff point (Tinsley 1980). This type of data collection (i.e. imaging) has the advantage of being faster (therefore, requiring less observing time or capable of penetrating to fainter luminosities than spectroscopy) and provides spatial information. However, as with line indice work, this technique is also dependent on the use of SED models to interpret the resulting colors (see Steindling, Brosch & Rakos 2001 for an in-depth analysis of the technique). We have recently adopted a more reliable principal component (PC) technique that is tied to the galactic globular age and metallicity scale (Rakos & Schombert 2005) which has resulted in a higher degree of accuracy in age determination than our previous papers.
The goal of this paper is three-fold. First, we briefly review our technique, its strengths and weaknesses, our multi-metallicity models and, most importantly, where the key uncertainties lie. Second, we will present our most recent compendium of ages and metallicities for cluster galaxies based on recent observations of four new clusters combined with data from four clusters previously published in the literature, now re-analyzed with our new techniques. Third, using the age and [Fe/H] values extracted from our colors, we will explore the trends and correlations as constrained by the limitations of our technique. Throughout this paper we use the Benchmark cosmological parameters of , and .
2 OBSERVATIONS
2.1 Cluster Photometry
A total of eight clusters were used for this study. In order of increasing redshift, they are Fornax (), Coma (), A119 (), A400 (), A539 (), A779 (), A1185 () and A2218 (). Four clusters (Fornax, Coma, A1185 and A2218) were published in our earlier studies (Rakos, Schombert & Odell 2007, Rakos & Schombert 2005, Odell, Schombert & Rakos 2002, Rakos et al. 2001). The remaining four (A119, A400, A539, A779) were obtained in the last few observing seasons using the 2.3m Bok telescope of the Steward Observatory located at Kitt Peak Arizona. The image device was 90prime, a prime focus wide-field imager using a mosaic of four 4k by 4k CCDs resulting in a field of view of 1.16 by 1.16 degrees and a plate scale of 0.45”/pixel (Williams et al. 2004).
The filter system for this study is a modified Strömgren () system, the same as used in our distant cluster studies (Rakos & Schombert 1995). The modified Strömgren system (herein called ) is altered in the sense that the filters are slightly narrower (by 20Å) than the original Strömgren system and the filter is shifted 30Å to the red of its original central wavelength. The system we use herein is called the system to differentiate it from the original system due to our small changes plus our filters are specific to the rest frame of the cluster that is being studied (this avoids k-corrections and allows for photometric membership to eliminate foreground and background galaxies). The system covers three regions in the near-UV and blue portion of the spectrum that make it a powerful tool for the investigation of stellar populations in SSP’s (simple stellar population), such as star clusters, or composite systems, such as galaxies. The first region is longward of 4600Å, where the influence of absorption lines is small. This is characteristic of the and filters ( = 4675Å and 5500Å), which produce a temperature color index, . The second region is a band shortward of 4600Å, but above the Balmer discontinuity. This region is strongly influenced by metal absorption lines (i.e. Fe, CN) particularly for spectral classes F to M, which dominate the contribution of light in old stellar populations. This region is exploited by the filter (Å). The third region is a band shortward of the Balmer discontinuity or below the effective limit of crowding of the Balmer absorption lines. This region is explored by the filter (Å). All the filters are sufficiently narrow (FWHM = 200Å) to sample regions of the spectrum unique to the various physical processes of star formation and metallicity (see Rakos et al. 2001 for a fuller description of the color system and its behavior for varying populations).
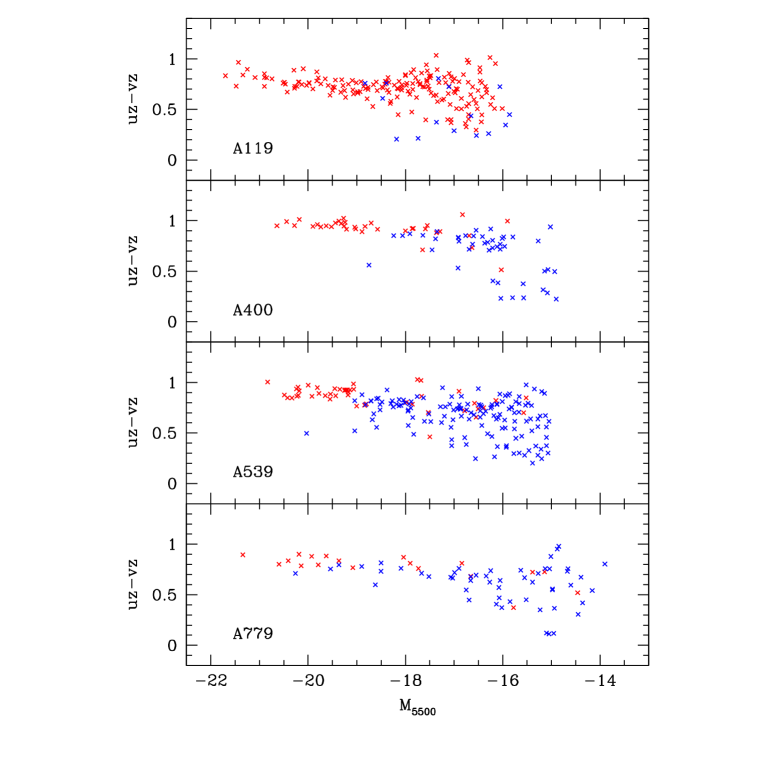
The reduction procedures have been published in Rakos, Maindl & Schombert (1996) and references therein. The photometric system is based on the theoretical transmission curves of filters (which can be obtained from the authors) and the spectra of spectrophotometric standard stars published in the literature (Massey & Gronwall, 1990). The convolution of the transmission curves and the spectra of the standard stars produces theoretical flux values for color indices of the standard stars corrected for all light losses in the equipment and the specific sensitivity of the CCD camera. Magnitudes were measured on the co-added images using standard IRAF procedures and are based for brighter objects on metric apertures set at 32 kpc for cosmological parameters of km s-1 Mpc-1 and the Benchmark cosmology (, ). For fainter objects, the apertures were adapted to deliver the best possible signal to noise ratio, but always using the same aperture for all four filters. Color indices are formed from the magnitudes: , , , and []. Galactic extinction was determined, and corrected for, in the standard fashion. Typical errors were 0.03 mag in at the bright end of the sample and 0.08 mag at the faint end. The color-magnitude diagrams for the four newest cluster are shown in Figure 1 for the filters. The characteristics and slopes of these diagrams are identical to previous color-magnitude diagrams.
2.2 Measuring Age in Galaxies
Determination of age by line indices focuses on the particular lines emitted by stars near the turnoff point, in this case Balmer lines from A (and hotter) stars. The strongest Balmer line, which is relatively free of contaminating emission from interstellar gas, is . The use of is well documented (Trager et al. 2000, Kuntschner et al. 2001, Poggianti et al. 2001, Gallazzi et al. 2005, Thomas et al. 2005, Sánchez-Blázquez et al. 2006, Schiavon 2007) and has the additional advantage that comparison to higher order Balmer lines allows for determination of not only mean age, but duration of star formation (Schiavon 2007, see also Prochaska et al. 2007 for problems with this technique).
Continuum colors determine age by measuring the turnoff point, in this case, the mean color of those stars in the near-blue region of the spectrum. Clearly, there is competition with the changes in color due to metallicity effects (the so-called age-metallicity degeneracy problem, Worthey 1999), but, this conflict can be resolved by either a longer baseline in color (e.g. near-UV for age, near-IR for metallicity as the turnoff stars have a stronger influence on blue colors than RGB stars) or by judicious choice of a narrow band continuum colors, as is the case in our work (Rakos et al. 2001).
While there are technical challenges for both line indice and continuum color measurements, both techniques have a primary difficulty in determining galaxy age in that, for a composite stellar population (one composed of stars with a range of ages), the age value measured is, in fact, a luminosity weighted mean age. Even if the underlying stars have a normal distribution in age, such that the mean age reflects the average, there still exists extremely relevant information contained in the spread of ages (i.e. the duration of initial star formation or later phases of star formation). And, galaxies must be composed of more than a simple stellar population (SSP, i.e. singular age and metallicity such as a globular cluster) for various reasons. Observationally, the existence of color gradients in ellipticals (see review by Kormendy & Djorgovski 1989) is perhaps the earliest evidence to this fact as all early-type galaxies have stellar population differences from their cores to halos. All indications are that this change in color is due to metallicity effects (Sánchez-Blázquez et al. 2007), but regardless of whether age or metallicity dominates, it is clear that galaxies are composed of stellar populations with a range of these values. HST imaging has resolved the stellar populations in several nearby ellipticals (Grebel 2003, Tosi 2007), all demonstrating the existence of a distribution of metallicities, but the question of a distribution of ages remains unresolved (Grebel 2005). Our own most recent work on a comparison of [Fe/H] estimates between line indice work and our continuum colors indicates that the distribution of metallicity in ellipticals must be broad and is similar to pre-enrichment infall models (Schombert & Rakos 2008).
Since galaxies are composed of multiple stellar populations, then the observed age, being an integrated value, can be arrived at by various paths of star formation. For example, for a calculated age that is a luminosity weighted mean age of 8 Gyrs can be obtained by a late epoch of star formation (5 Gyrs later than the oldest galaxies) or by an extended duration of star formation (i.e. going from 12 Gyrs ago up to 4 Gyrs from the current epoch to an average of 8 Gyrs). In addition to varying durations of star formation, an intermediate aged population might exist having its origin from a recent, weak burst of star formation (Serra & Trager 2007, Trager et al. 2005). Thus, a secondary clock, such as the ratio of elements to Fe (a measure of the contribution by Type Ia SN to the chemical enrichment on timescales of Gyrs) will be required to constrain various age distribution scenarios (see §3.4).
2.3 Continuum Color Method of Age Determination
Our technique to determine age and metallicity using narrow band continuum colors is outlined, in great detail, in Rakos & Schombert (2005). Our method differs from line studies by measuring the effects of varying age and metallicity on the shape of selected parts of a galaxy spectrum. The underlying phenomenon that we capture are 1) varying metallicity reflects into the position of the RGB (due to the stronger effect of line blanketing in evolved stars) and 2) age is reflected in the position of the turnoff point. The turnoff point changes in color slowly with age after 3 Gyrs (Schulz et al. 2002) and, for this reason, our technique fails for younger populations, although we do not expect this to be a problem for red early-type galaxies in rich clusters. In any case, star forming galaxies signal their young nature through several of our filters and, while we can not determine their exact ages, we can exclude them from our samples.
Our use of narrow band continuum colors (a modified Strömgren system) is motivated by three factors; 1) narrow filters select smaller regions of a galaxy’s spectrum, regions which show different sensitivities to changes in the RGB and turnoff point and, thus, facilitate the breaking of the age-metallicity degeneracy, 2) there exist improved population models (Schulz et al. 2002) which sample the region of age-metallicity parameter space useful for the analysis of old, red galaxies and 3) these models are now tied, accurately, to the globular cluster ages and metallicities resolving a long standing dilemma for stellar population studies. The Schulz et al. models are a significant improvement over past work with respect to our near-UV and blue colors as they 1) include the recent isochrones from the Padova group which have a stronger blue HB contribution (important for even a small old, metal-poor contribution to the galaxy light), 2) use more recent stellar atmosphere spectra which, again, are refined to better sample the blue region of a galaxy’s spectrum and 3) are in better agreement with globular cluster colors than previous work. Our use of the filters to determine age and metallicity culminated in Rakos & Schombert (2005) where we develop a principal component methodology for determining these two parameters in composite systems, such as galaxies.
Briefly, our principal component technique derives metallicity and age values using the observed narrow band colors and the knowledge of the behavior of the PC surface as mapped by the Schulz et al. SED models. A grid search method is used in an iterative fashion to locate the pair of age and metallicity that minimize the distance between calculated PC values with model PC values. This technique has the advantage of using the information from all four filters simultaneously while allowing flexible use of various SED models and yet is still tied to the globular cluster age/metallicity system.
This method of determining galaxy age based on continuum narrow band colors has several caveats. First, this measurement is the mean age of the underlying stellar population, not the time from galaxy formation. We will argue in a later section that, for the oldest galaxies in the sample, this stellar population age must coincide with the formation epoch. However, for galaxies with stellar population ages several Gyrs less than the age of the Universe, there is a broad window of time for the actual assembly time of the galaxy (stars plus dark matter).
Another limitations to our technique arises from the models themselves. For example, the models are restricted to [Fe/H] between 1.7 and 0.5 plus ages between 3 and 15 Gyrs and, thus, our extracted values are constrained by mild extrapolation of these limits. With respect to ages for cluster galaxies, this limitation will not impact our results as we can isolate galaxies with ongoing star formation, or have large fractions of young stars, by their extreme colors and/or strong emission lines. These galaxies are identified as their colors lie outside the color parameter space of the SED models and, thus, are not submitted for age/metallicity analysis. These objects consisted of less than 4% of our cluster sample. The remaining galaxies have colors which indicate they have been quiescent on timescales of Gyrs, and are ideal candidates for study by our technique. In addition, with respect to metallicity, there is a strong expectation, based on previous work, that cluster galaxies contain a majority of their stars with mean [Fe/H] values greater than globular clusters, removing any problems of fitting the low metallicity end of the models.
Our resulting ages and metallicities are thus based on the PC analysis of three narrow band colors (, , , Rakos & Schombert 1995). Our ages are deduced based on SSP values (i.e. we assume no spread in age within a galaxy’s stellar population) but we test that assumption in §3.4. We do adjust our metallicity values based our work comparing line indice [Fe/H] values to colors produced by a multi-metallicity model. This adjustment is linear and based on our ‘push’ model of chemical enrichment (discussed in Schombert & Rakos 2008). Briefly, the multi-metallicity models attempt to reproduce the galaxy colors using a real distribution of internal metallicities (i.e. a chemical evolution model) rather than singular SSP. This is done by taking the SSP’s for a range of metallicities (follow some model of the distribution of [Fe/H]) and summing the colors weighted by the luminosity per mass of the SSP’s. Since lower metallicity SSP’s contribute more blue light than higher metallicities, then the luminosity weighted value for [Fe/H] will tend to be lower than the [Fe/H] from a numerical average of the SSP’s. The ’push’ model is a simple closed box [Fe/H] distribution pushed at low [Fe/H] values to simulate the G-dwarf problem (i.e. initial enrichment). Due to the varying luminosity contributions by each bin of metallicity, the calculated value for [Fe/H] must be adjusted to produced the mass averaged value of metallicity, Fe/H. While this adjustment is negligible at low metallicities ([Fe/H] 1.5), there are increases in [Fe/H] by 0.1 dex at values greater than solar, and it is this metallicity that we use in our following discussions.
3 DISCUSSION
3.1 Galaxy Age from Narrow Band Colors
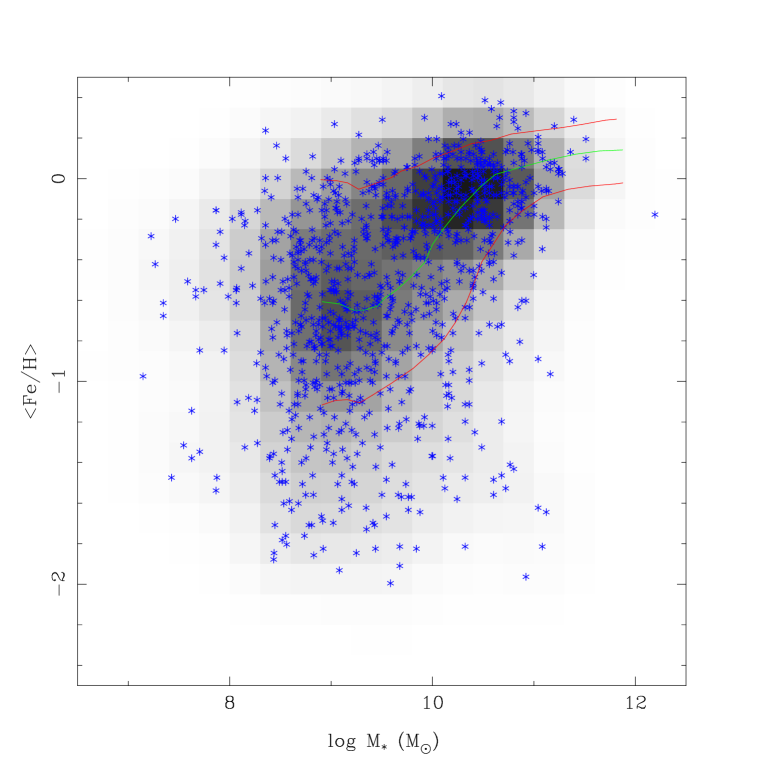
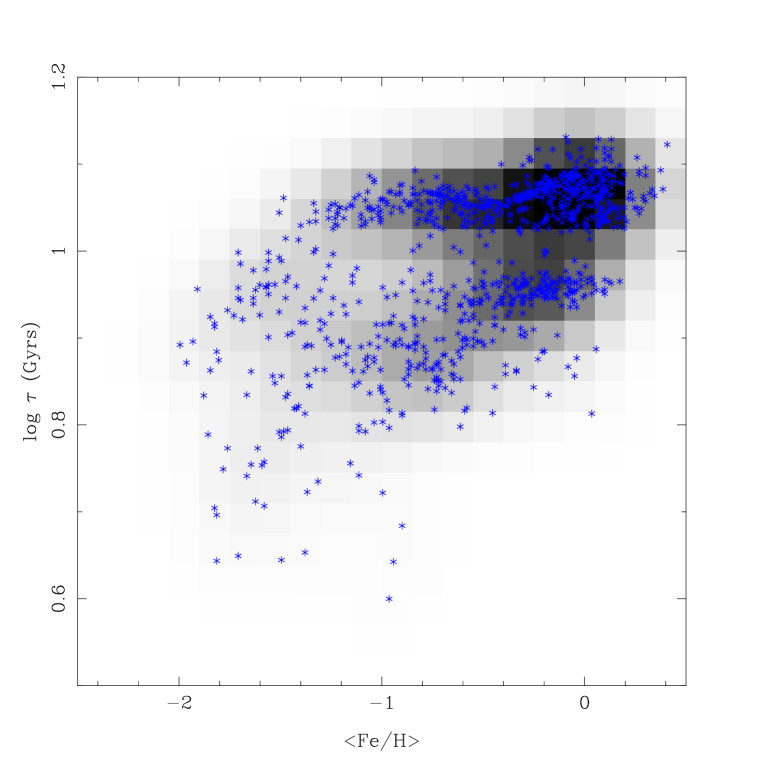
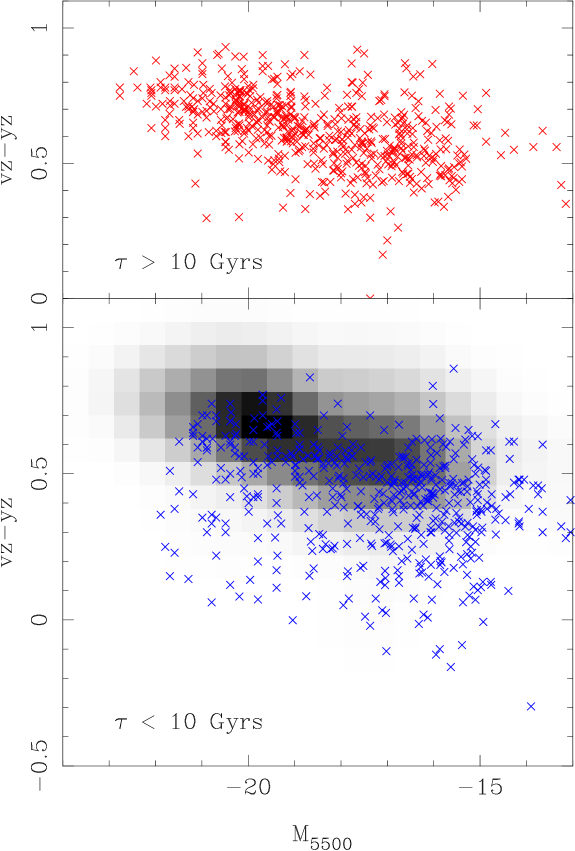
A graphical summary of our deduced mean ages and [Fe/H] for 1,104 galaxies in eight clusters (in order of increasing redshift: Fornax, A779, Coma, A400, A539, A1185, A119, A2218) is shown in Figures 2, 3 and 4, plots of log (Gyrs), [Fe/H] and stellar mass (log ). Distance is derived using the Benchmark cosmology and stellar mass is calculated from the luminosity assuming a M/L of 3 (Bender, Burstein & Faber 1992). Since our sample is composed primarily of early-type galaxies, the amount of gas is minimal and, therefore, the stellar mass reflects the total baryonic mass of the galaxy. Typical uncertainties, defined mostly by the SED models, are 0.5 Gyrs in age, 0.2 dex in [Fe/H] (although this will increase at lower luminosities due to a combination of higher errors in the observations and running against the limits of the SED models). The uncertainties are represented by the greyscale image in each plot where each data point is taken to be a 2D gaussian of width given by the errors above. Each datapoint’s contribution per bin is summed to produce the greyscale intensity, normalized to the total sample size.
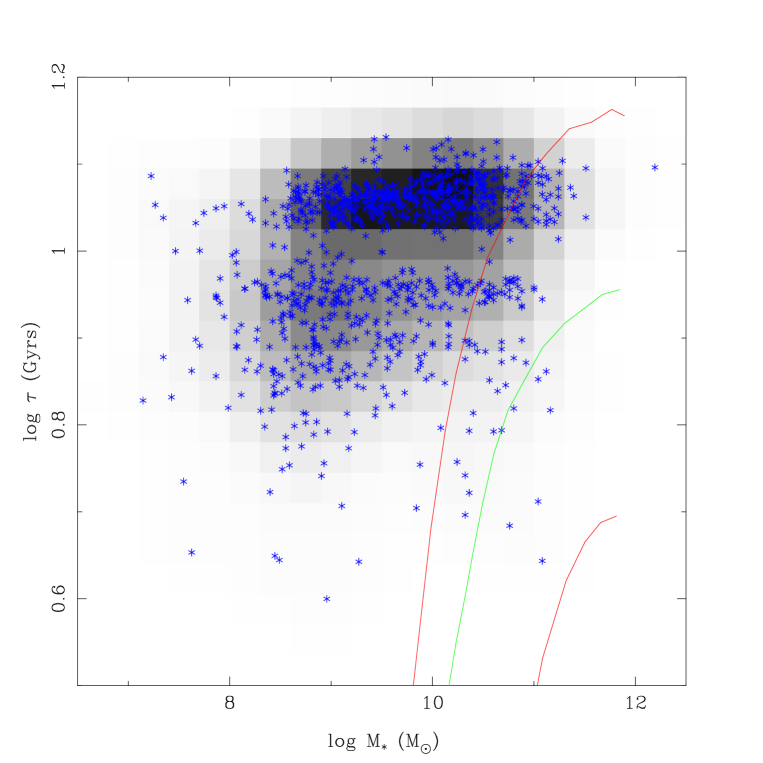
All the key features noted over the decades relating to galaxy evolution are visible. For example, the mass-metallicity relation is evident in Figure 3, although not the strictly linear relation as indicated by the color-magnitude diagram for galaxies (Bower et al. 1992, Vazdekis et al. 2001). There is some suggestion in this diagram of two populations, a high mass, solar metallicity population with a strong correlation between mass and Fe/H plus a lower mass population with lower metallicities and a much higher scatter. Age does not appear to be a factor in the trend found in Figure 3 as there are numerous old galaxies with [Fe/H] values around 1 and plenty of younger galaxies with [Fe/H] near solar (although see Figure 13 for the effect of age on the scatter in the color-magnitude relation). The only consistent trend with age is that all galaxies with Fe/H values less than 1.5 have ages less than 10 Gyrs. It would appear, since there is no evidence in Figures 3 or 4 that young galaxy age leads to high metallicity values, that the epoch of star formation, or its duration, is not a significant factor in determining the mean metallicity of a galaxy. Mass is the primary driver of metallicity as predicted by infall models of chemical evolution (Pipino & Matteucci 2004), although probabily not the sole variable (see §3.7).
Determination of the age of the stellar populations in galaxies is the primary goal of this paper and a comparison in the range of galaxy ages we find versus the range in ages by two recent line indice studies (Sánchez-Blázquez et al. 2006 and Thomas et al. 2005) is found in Figure 5. This comparison is key to our discussion as the Sánchez-Blázquez et al. and Thomas et al. studies use the Lick/IDS system of age determination (i.e. the model grid interpretation of the H versus Fe or MgFe index). As can be seen from Figure 5, the distribution of galaxy ages differs dramatically between the Lick/IDS technique and our method. Both the Sánchez-Blázquez et al. and Thomas et al. samples (only the high density sample is shown) find significant numbers of galaxies with ages less than 7 Gyrs.
Our technique is unable to calculate ages less than 3 Gyrs, however, those objects still signal their young ages with star forming colors and are rare in our cluster samples (Rakos, Maindl & Schombert 1996). We also note that our technique finds that a majority of cluster galaxies have ages greater than 10 Gyrs, but old galaxies are in the minority in the samples that determine age by the Lick/IDS system. For example, in Coma, we have three galaxies in common with the Thomas et al. sample, NGC 4839, 4874 and 4889. The Thomas et al. ages are 15.8, 2.4 and 2.8 Gyrs respectfully. Our continuum color ages are 11.6, 12.5 and 10.9 Gyrs for the same galaxies. Our ages are more in agreement with the expectations of stellar population evolution from intermediate redshift clusters (Rakos & Schombert 1995), where the Thomas et al. values would predict large numbers of bright cluster ellipticals with star-forming colors, which is not seen.
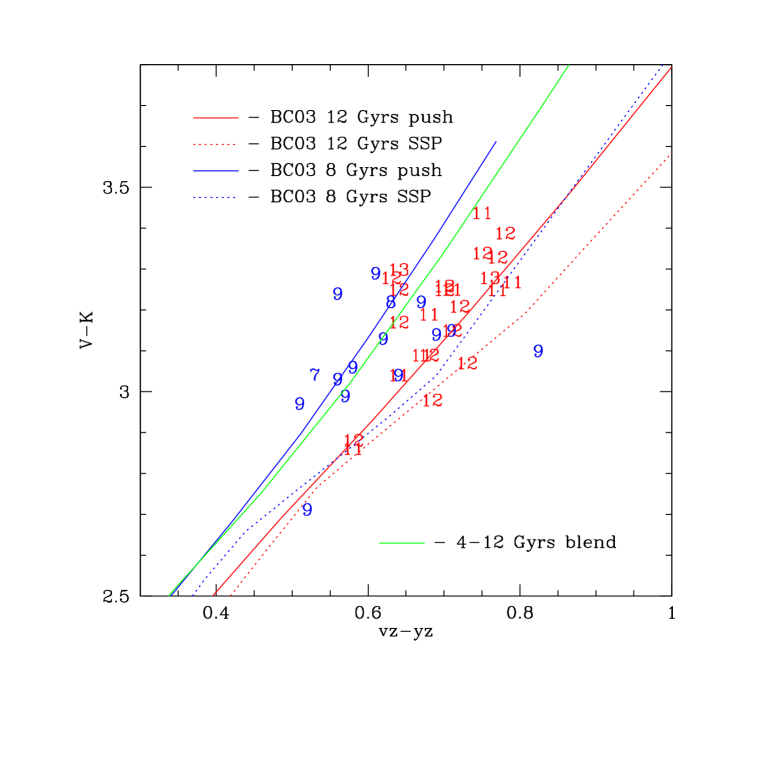
The differences between the Lick/IDS system method and other techniques of age determination has been noted before (e.g. Bregman, Temi & Bergman 2006). In order to confirm the legitimacy of our age values, we have turned to the third method mentioned in the Introduction, the use of longer baseline broadband filters to exploit the sensitivity of near-IR colors to the position of the RGB. In this case, we can combine our narrow band colors in the Coma cluster (Odell, Rakos & Schombert 2002) with recent band data (Eisenhardt et al. 2007). There are 16 galaxies in common with their sample and ours, for which our near-blue color is plotted against their near-IR color in Figure 6. We label each galaxy data point by its estimated age, using our technique, rounded to the nearest Gyr. In this Figure it is clear that galaxies with the oldest ages ( Gyrs) separate from the younger systems ( Gyrs). Thus, the Coma galaxies with near-IR colors separate nicely in this optical/near-IR color plane. There is some overlap in ages, but within our expected errors of 0.5 Gyrs.
This Figure also allows an opportunity to check various SED models tracks to our age estimates and the absolute value of our age estimates (as our technique is tied to the galactic globular cluster ages). In this case, we have chosen the most recent SED models from Bruzual & Charlot (2003, hereafter BC03). Figure 6 displays the model color tracks over a range of metallicities ([Fe/H] from 0.8 at to 0.3 at for all the models) for a population of 8 and 12 Gyrs. The dashed lines are the raw SSP models from BC03, which do not match the colors of the Coma sample. This is not unexpected as galaxies are not composed of a single metallicity population, as represented by the SSP’s. As discussed in Schombert & Rakos (2008), the color-magnitude relation and the line indice versus color relations are best matched by a multi-metallicity model that incorporates a modified infall model of chemical evolution. These models, referred to as the ‘push’ models in Schombert & Rakos (2008), are shown as solid lines in Figure 6 and are an excellent match to the relative age differences. Thus, we conclude that our absolute and relative age estimates conform to expectations from SED models.
3.2 Cluster Ellipticals Ages
There are several features to the age and metallicity distributions to our sample that are common to all the clusters and visible in Figures 2, 3 and 4. The first is that there clearly exist galaxies with old ages ( 12 Gyrs) in all clusters. This mean value is comparable to the age of the Universe (i.e. these are the oldest galaxies) and this population makes up the majority of cluster galaxies.
Second, the red cluster galaxies divided neatly into two populations based on age, with a distinct gap in age between the populations. The older population has a mean of 11.5 Gyrs, the younger population a mean age of 9.5 Gyrs. The gap is wider than our estimated error of 0.5 Gyrs, therefore, appears to be a real feature. This gap is not seen in studies that use the Lick/IDS, such as Thomas et al. (2005) or Sánchez-Blázquez et al. (2006), but this may be due to small number statistics. The transition in age with mass is sharp in the Gallazzi et al. (2005) work (see their Figure 9, also drawn in our Figure 2), which involves over 175,000 galaxies from the SDSS database, but does not take on a bimodality distribution as suggested by our data sample. We note that the SDSS sample includes all galaxy types, both field and cluster, whereas our sample is a strict, high density, cluster population. The inclusion of star-forming disk systems would clearly deviate the correlation of age and mass to younger ages.

Lastly, there are a couple trends (i.e. weak correlations) with age. In general, brighter luminosity (higher mass) systems tend to be older. Older galaxies also tend to be more metal-rich (as measured by [Fe/H]). However, neither of these trends is strong suggesting that the path that a galaxy evolves through to reach these global values of age and metallicity is influenced by several factors not directly related to its total mass. In addition, the lack of sharp correlations indicates that the global values we measure, such as luminosity-weighted age, may be composed of a more convoluted underlying stellar population. We will examine each of these features, and combine our results here with previous results, in an attempt to untangle our observations in the following sections.
3.3 The Oldest Galaxies
The oldest galaxies in our sample have mean ages between 11 and 12 Gyrs, which is consistent with the assumption of a primordial epoch of initial star formation and the age of the Universe under the Benchmark model (12.6 Gyrs). While there exist galaxies with calculated ages of 13 Gyrs (only 1% of the sample galaxies have ages greater than 13 Gyrs, none older than 13.5 Gyrs), they are consistent with the age of the Universe within the errors of the age determination method.
Extremely old stellar populations in galaxies are not unexpected under certain galaxy formation scenarios (e.g. monolithic collapse, Eggen, Lynden-Bell & Sandage 1962, Larson 1974, Arimoto & Yoshii 1987), it is somewhat surprising to find large numbers of purely old galaxies in our sample as star formation has been observed in ellipticals between redshifts of zero and 1 (Stanford et al. 2004). Later star formation would push our integrated age estimates to younger values (see §3.4).
Two possible scenarios can resolve this dilemma. The first is that the observed high redshift star formation events may involve a very small fraction of the total stellar population mass and, thus, their anomalous colors have since faded below detection, overwhelmed by the colors of an older stellar population. The second is that the number of galaxies undergoing these recent bursts have been overestimated. There certainly exist galaxies in our cluster samples with younger mean ages (see gap population discussion below) and they may be the ancestors of these higher redshift objects.
The existence of galaxies with ages nearly equal to the age of the Universe places a series of important constraints on scenarios for galaxy formation. While there are clearly evolutionary processes in play within rich clusters (i.e., mergers and tidal collisions which induce later star formation, Moore et al. 1996), it appears, from the properties of our reddest galaxies, that there must exist a sizable fraction of cluster ellipticals whose dominant stellar population dates back to the epoch of cluster formation itself. These are valuable inputs to our galaxy formation models as these ages allow for no room in the time budget for later epochs of star formation (which would lower the deduced mean age by our method) nor for a very long duration of initial star formation after the time of galaxy formation (which would also decrease the deduced mean age). We note that that Thomas, Maraston & Bender (2002) find that the oldest galaxies in their sample have the highest /Fe ratios, implying very short initial durations of star formation in agreement with their old ages. Short durations of star formation imply that the resulting chemical evolution is direct, in agreement with our determination that the internal metallicity distribution in ellipticals are bested described by simple infall models (Schombert & Rakos 2008).
At the very least, our oldest galaxies are a challenge to hierarchical models where galaxies are assumed to assemble gradually with time by mergers (Baugh, Cole & Frenk 1996). All the stars in these merging systems would be required to have the same ages and chemical history to explain the mass-metallicity relation (although perhaps the scatter in the mass-metallicity diagram is a signature of past stochastic mergers, see de Lucia et al. 2006 and Kaviraj et al. 2005), /Fe increases with mass and the age-mass relation (see §3.7). While it is plausible to have all the galaxy components with the same epoch of initial star formation, our models of chemical enrichment require a varying mass to produce varying metallicities. Thus, hierarchical formation is an inadequate explanation for these oldest cluster ellipticals.
3.4 Gap Population
Common to seven of our eight clusters is a second, younger population (the exception is A119). This second population is distinguished by a clear gap, varying in width of between one to two Gyrs, separating the younger population (which we will refer hereafter as the gap population) and the oldest galaxies. While this gap population is not as numerous as the oldest galaxies, it is significant. When we divide all galaxies with metallicities greater than [Fe/H]=-1.7 (the limit of our models) into three bins of greater than 10 Gyrs (591 galaxies, 53%), between 7 and 10 Gyrs (431 galaxies, 39%) and less than 7 Gyrs (88 galaxies, 8%), we see that the gap population constitutes about 1/3 of all cluster galaxies.
The oldest galaxies, having ages near the age of the Universe, must be objects with simple star formation histories, i.e. a short initial burst followed by a quiescent history. However the gap population, with a mean age between 8 and 9 Gyrs, can reach this stage through various paths. First, it must be remembered that the calculated age is a luminosity weighted mean value. For example, a mean age of 8 Gyrs can be obtained by a late epoch of star formation (5 Gyrs later than the oldest galaxies) or by an extended duration of star formation, i.e. going from 12 Gyrs ago up to 4 Gyrs from the current epoch to average as 8 Gyrs). A comparison of just those two exact scenarios is shown in Figure 6, where we linearly combine SED models from 4 to 12 Gyrs (assuming equal mass for each age, green line) and compare them to a single age 8 Gyr model. As can be seen in Figure 6, it is impossible, in practice, to distinguish these two paths of star formation history simply by colors.
A secondary clock to determine the duration of initial star formation in a galaxy can be estimated by the ratio of elements to Fe (Greggio & Renzini 1983, Thomas, Greggio & Bender 1998), since delayed enrichment by Type Ia supernova raises the abundance of Fe relative to elements (such as Mg and Ca). An increasing /Fe ratio with galaxy mass is found by Thomas, Maraston & Bender (2002), which is interpreted as increasing initial star formation duration with decreasing galaxy mass ranging from less than 0.5 Gyrs duration for the highest mass galaxies to 6 Gyrs in duration for galaxies around . These duration values would produce mean galaxy ages consistent with the gap population ages, although we note that while there is a slight decrease in age with lower mass for the gap population (Figure 4), this trend is not as strong as would be expected from the change in /Fe with mass (Gallazzi et al. 2006).
In addition to varying durations of star formation, an alternative explanation to the younger age for the gap population is to consider the effect of a more recent star formation event averaged with an old (12 Gyrs) stellar population. Recent burst models (referred to as frosting models, Trager et al. 2000) are parameterized by the fraction of the mass of the galaxy involved in the burst and when the burst occurred. Obviously, the effect of a star formation burst on the integrated color of a galaxy, will be less if the burst involves a small fraction of the galaxy mass and/or occurs farther in the past (the population having time to redden and blend in with the older stars). In order to constrain the magnitude of a frosting star formation event, we can ignore any burst that would still leave a signature of stars hotter than A type at the present day. For these stars, in sufficient numbers, would dominate the near-blue colors in early-type galaxies, which have been known for decades to have the continuum shape represented by K giants (O’Connell 1980). However, a population that is over one Gyr old has already taken on the colors close to a metal-rich, old population and is only identifiable when mixed with an older population using hyper accurate measurements, at least in the optical region of the spectrum (Rose et al. 1994).
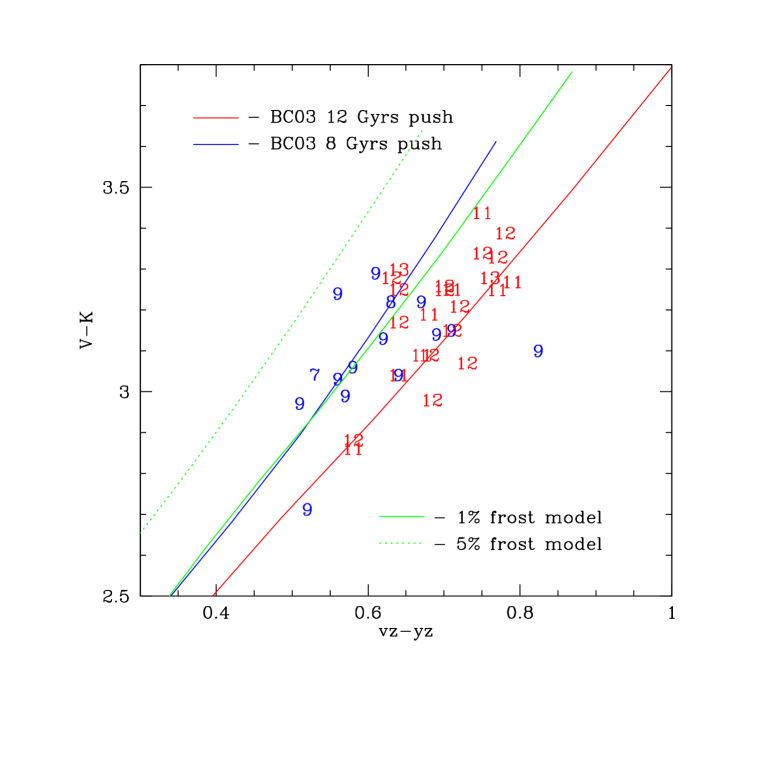
To test the effect of an old, weak burst on the measured mean age of our galaxies, we have mixed a 1 Gyr population of varying fractions to an old 12 Gyr population using the BC03 models. Returning to the optical/near-IR diagram we used in Figure 6, we have plotted a 1% burst (involving 1% the mass of a galaxy) and a 5% burst for a range of mean metallicities (again using a metallicity distribution calculation as given by Schombert & Rakos 2008). These tracks are shown in Figure 7, again along with our Coma data. From these tracks, it is clear to see that even a small burst of 1% of the mass of the galaxy, after 1 Gyr, has produced a trend of color which closely resembles a composite 8 Gyrs population. Stronger bursts, of up to 5%, can be ruled out by the and narrow band colors (as seen by the dotted line in Figure 7). We conclude it is impossible to distinguish between a small (less than 1%), recent bursts or a composite 8 Gyrs model for the gap population.
3.5 Age-Density Relation
A sharp separation in age for cluster early-type galaxies suggests either a formation process which delays or extends star formation for a subset of galaxies (i.e. a nurture scenario) versus one where some environmental process has operated on a subset of galaxies after the formation epoch to induce later star formation (i.e. a nature scenario). Environmental processes are typically tested by looking for correlations with galaxy density, on the assumption that the operating process is tied to the dynamical interactions either with the cluster tidal field (galaxy harassment, Moore et al. 1996) or by galaxy interactions.
While this environmental effect may be recent, as suggested by the frosting models, this may also be a remnant of a primordial event. For example, one of the key predictions for hierarchical galaxy formation models is a difference between field and cluster galaxy ages (where cluster systems form first and, therefore, have older stellar populations). Our sample is strictly a sample of rich cluster galaxies, however, we can test for any correlation with local density or with cluster radius, a crude measure of local density. Just such a test is found in Figure 8, a plot of galaxy density as a function of cluster radius in kpc.

To produce this plot, we have binned all the clusters into one geography (i.e. no correction for cluster size). The cluster center is determined as either as the position of the brightest cluster member, or the geometric center of the cluster weighted by galaxy mass. A119 was excluded in the calculations as it does not contain a gap population and A1185 was excluded since its irregular structure made the determination of the cluster center problematic. The resulting sample of 652 galaxies were binned in 100 kpc radii and the number of galaxies per annulus area were summed for galaxies with ages greater than 10 Grys (above the gap), between 7 and 10 Gyrs (below the gap) and less than 7 Gyrs.
Immediately obvious from Figure 8 is that galaxies with younger mean age avoid the denser regions of the clusters and the older galaxies are more concentrated. It is not surprising to find the very youngest galaxies located on the cluster outskirts as these objects are structurally similar to disk galaxies (see §3.6) and have similar properties to the Butcher-Oemler population. However, even the intermediate aged galaxies are less concentrated than the oldest cluster members. This effect, that younger galaxies avoid the cluster core, is slightly correlated with cluster type, the more evolved cluster types display a stronger separation by age than clusters that are dynamically young (as expressed by the BM and RS types), leading to the obvious conclusion that dynamical processes influence a galaxy’s star formation history. It is also notable that the highest redshift cluster in our sample (A2218) displays this separation to the greatest effect suggesting a process that has evolved recently in lookback time.
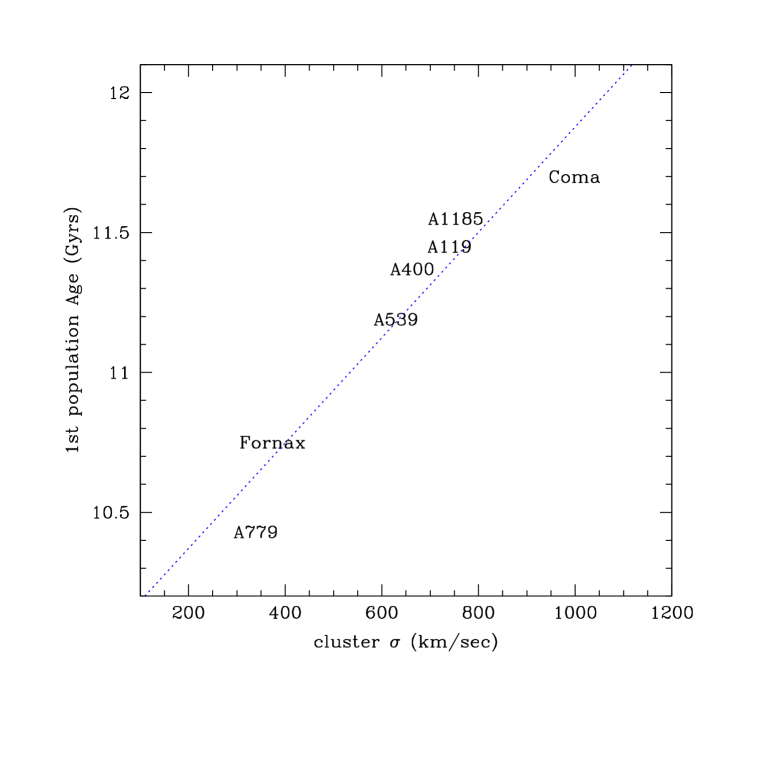
Environmental effects are not limited to the gap population. Figure 9 displays the average age of the oldest galaxies (the 1st population) as a function of cluster velocity dispersion. Although the sample size is small, there is a clear correlation between the mean age of the oldest galaxies and dynamical state of the cluster as represented by velocity dispersion. The correlation here is such that high mass, high velocity dispersion clusters have the oldest 1st populations, implying that these clusters started galaxy formation (and the initial epoch of star formation) before their lower mass counterparts by approximately 1 Gyr.
3.6 Age-Morphology Relation
A correlation between galaxy age and local density would imply a correlation between galaxy type (morphology) and age by way of the cluster density-morphology relationship (Ball et al. 2006). To test this hypothesis we extracted morphological types and structural parameters for the Coma sample (see Odell, Rakos & Schombert 2002). Visual morphology was divided into four types, objects (ellipticals), objects with distinct bulge and disk components (S0’s), objects with spiral or irregular structure (Sp/Irr) and objects with lenticular or dwarf appearance (dE’s). Structural morphology was based on surface photometric fits to objects brighter than 18. These fits are divided into three types, bulge objects (), bulge+disk objects (S0’s) and exponential disks (lenticulars).
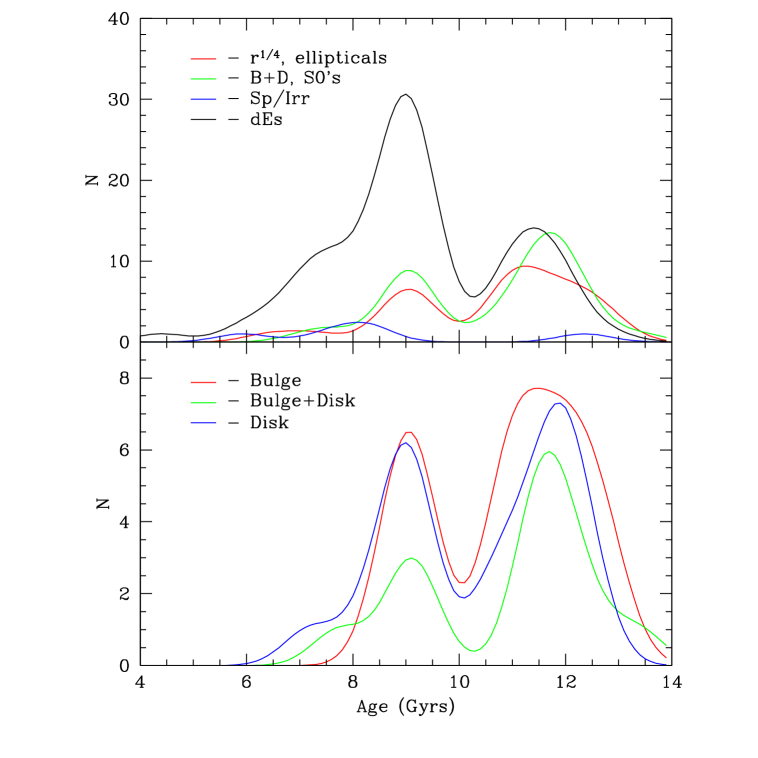
Histograms of both visual and structural morphology are shown in Figure 10. Surprisingly, there is no clear trend in morphology with age, such that the percentage of galaxies classed E:S0:dE:S/Irr less than 10 Gyrs in age is 12%:14%:65%:9% versus greater than 10 Gyrs of 29%:34%:34%:3%. Elliptical and S0 type galaxies have the same distribution in age, a majority being old ( = 12 Gyrs), but also form a significant fraction in the gap population. Star forming spirals and irregulars tend to be young, but a majority of the young galaxies in Coma are in the lenticular or dwarf category. These morphological types are simply low luminosity ellipticals with exponential shapes characteristic of ellipticals less than 18 (Schombert 1987). Their young age reflects the age-mass relation discussed in §3.1.
In terms of structure, the fraction of young to old galaxies are similar for galaxies with bulges (ellipticals), bulge+disks (S0’s) or pure disk systems (lenticulars). The fractions B:B+D:D with ages less than 10 Gyrs is 37%:21%:42% versus the fraction for galaxies with ages greater than 10 Gyrs of 44%:24%:32%, i.e. slightly more r1/4 objects over pure disk systems for older galaxies. Since the structural sample is composed solely of the brightest galaxies in Coma, this histogram reflects the lack of any morphological distinction in age for the top of the cluster luminosity function. Whatever processes determines a galaxy’s age is decoupled from its morphological evolution (outside of current star formation).
The lack of an age difference between ellipticals and S0’s (or bulge objects versus disk lenticulars) is surprising as there is an expectation that S0 disks are only recently quenched (i.e. stripped of their gas) and should display a younger age (Bedregal et al. 2006, Burstein et al. 2005). Although we note that the largest B/D S0’s are the oldest such that even the oldest S0’s may have young disks buried in the light of their dominant bulges.
3.7 Age Correlations with Mass and Metallicity
The existence of correlations between a galaxy’s stellar population age and mass or mean metallicity has been debated in the literature (Conselice 2007), but several recent large studies have converged on a consistent picture (Thomas et al. 2005, Gallazzi et al. 2006, Jimenez et al. 2006, Annibali et al. 2007). While differing in the details, all these studies find that galaxy age increased with stellar mass (luminosity) and metallicity ([Fe/H]), although the deduced correlations contain a large amount of uncertainty. And, common to all these studies, the scatter in the correlations exceed the observational errors, implying secondary processes are significant.
For this study, noting again that we measure age and metallicity based on a different technique than line indices, we find the same general correlations between stellar mass (luminosity) and metallicity as previous work (Figures 2, 3 and 4). While the correlation between stellar mass and metallicity (Fe/H) is evident, the scatter, like the line indices studies, is clearly greater than the observational uncertainties and, therefore, the depth of the gravitation well of a galaxy is not the sole parameter that drives the chemical evolution of a galaxy (as predicted by galactic wind infall models, Pipino & Matteucci 2006). Dividing the sample by age (for example, considering the mass-metallicity relation solely for galaxies with ages greater than 10 Gyrs), we find that the oldest systems display a tighter mass-metallicity relation, however continue to display scatter larger than observational errors.
In terms of age, there is a distinct separation by mass between the old galaxies and the gap population. For galaxies brighter than , the breakdown between the old galaxies and the gap population is 68% to 32%. For fainter galaxies, this division reduces to 49% to 51%. But while there is a tendency to find the youngest galaxies to be of the lowest masses, there is no clear linear correlation. This is due, primarily, to the fact that the division into two populations is so distinct that each population should be analyzed separately.
Considering the oldest galaxies first, this population has a mean age of 11.5 Gyrs. To within the uncertainties, the slope of the old population with respect to stellar mass is very shallow with a change of less than 1 Gyr over the full range in mass. For the younger gap population, there are larger numbers of young galaxies at low masses (). This agrees with the shape and scatter of the color-magnitude relation (Odell, Rakos & Schombert 2002), however, some of these galaxies probably represent the low mass Butcher-Oemler objects (Rakos et al. 1996) with traces of recent star formation (see Figure 13). Likewise, the small number of high mass galaxies () with ages less than 8 Gyrs could easily represent cluster galaxies which have undergone recent mergers of disk galaxies with younger stellar populations or induced star formation.
The age versus metallicity diagram (Figure 4) displays a wealth of buried information. The old population of galaxies shows a slight trend for an increase in Fe/H with age, certainly the oldest galaxies ( 12 Gyrs) all display greater than solar metallicities. But the trend is weak and galaxies with an age of 11 Gyrs have a range of [Fe/H] from 1.2 to 0.3. The implies that the age of the stellar population does not have a large influence on chemical evolution and that the final metallicity of a galaxy is dominated by its mass.
The situation differs for the younger gap population. Here we find a fairly good correlation between age and metallicity such that the older gap galaxies ( Gyrs) have the highest metallicities (near solar). The younger gap galaxies ( Gyrs) have lower metallicities, near [Fe/H]. We note that this trend of age and metallicity for the gap population is opposite to the correlation of age and metallicity (i.e. younger galaxies having higher metallicities) demonstrated by Trager et al. (1998), Jorgensen (1999), Ferreras et al. (1999), Terlevich & Forbes (2002) and Sánchez-Blázquez et al. (2006). However, an extensive study of the correlated errors by Sánchez-Blázquez et al. finds no such relationship in high density regions. As our cluster sample is extracted from the very highest density regions in the Universe, it is no surprise that our oldest galaxies display no correlation between age and metallicity.
Our gap population displays the opposite correlation as in found for field galaxies by the Sánchez-Blázquez et al. work, which we interpret to mean that the measured age from these galaxies is determined by post formation processes unique to the cluster environment. If the younger age of these galaxies is due to longer durations of initial star formation, then we would expect the opposite correlation as more star formation pushes towards higher metallicities. Instead, the effect we find would support a frosting scenario such that younger age correlates with mass (smaller galaxies being more susceptible to a burst event), but that chemical evolution is primordial and independent of measured age.
3.8 Age Gradients
One of the most common criticisms of the Lick/IDS technique is that it finds a high fraction of galaxies with line indice determined ages of less than 7 Gyrs, yet very red optical to near-IR colors. This is inconsistent with other observations of ellipticals from the Fundamental Plane and at intermediate redshifts (Rakos & Schombert 1995). A re-analysis of the Trager et al. dataset by Schiavon (2007) finds that the number of young ellipticals ( 7 Gyrs) had been overestimated. Using an improved set of model tracks, Schiavon finds 3/4’s of the Trager et al. sample to have mean ages greater than 7 Gyrs and only 1/4 younger. This study finds only 7% of cluster galaxies younger than 7 Gyrs, so even the re-calibrated Lick/IDS method still finds a higher fraction of young systems. However, the Trager et al. sample covers a range of galaxy environments, whereas our data is strictly a cluster sample. There are many studies suggesting an age difference between the field and cluster environments (Thomas et al. 2005, Sánchez-Blázquez et al. 2006, Annibali et al. 2007) in the direction of younger ages in their field samples. But even considering only their high density samples, we still do not find the wide range of ages suggested by studies using the Lick/IDS system.
Another comparison to the age and metallicity values extracted for the Lick/IDS system, with respect to our continuum color technique, can be made by examining the SDSS averaged spectra produced by Eisenstein et al. (2003). These spectra consist of thousands of SDSS spectra selected by color and morphology. These averaged spectra are divided into four luminosity bins and, for our comparison, we use the spectra taken over the full range of environmental densities. Eisenstein et al. publish their Lick/IDS values (which can be converted into age and metallicity through the MgFe and H indices using BC03 models) and their spectra were re-reduced by Schiavon (2007) using a different technique to derive the same Lick/IDS indices. Figure 11 displays the age-metallicity-stellar mass plane for our sample and the Eisenstein SDSS spectra. Our data are averaged in galaxy mass bins of 0.5, shown by the black symbols in Figure 11. Each data point is the average of the bin, the error bars display the dispersion within each bin (i.e. not uncertainties). Note that the separation into two galaxy populations by age is blurred by this type of analysis, but does reproduce many of the correlations seen in line indices study (e.g. increasing age with galaxy mass). The blue diamonds display the original Eisenstein et al. Lick/IDS values converted into age and metallicity. The red diamonds are the re-analysis values by Schiavon. The green diamonds are the spectra convolved through our narrow band filters and converted into age and metallicity by comparison to our galaxy sample (the filter is estimated from extrapolation of the near-UV portion of the SDSS spectra).

Figure 11 displays some of the more common problems with the interpretation of Lick/IDS values. For example, the raw Eisenstein et al. values are in fair agreement with our age values as a function of mass (blue diamonds), but metal poorer than our average [Fe/H] values. The Schiavon re-analysis recovers metallicity, but now the calculated ages are several Gyrs younger than our mean ages. This is the same behavior discovered by Monte Carlo simulations of correlated errors between age and metallicity by Thomas et al. (2005).
When we reduce the Eisenstein spectra through our continuum color scheme we recover the mean ages and metallicities of our cluster sample (although slightly younger and more metal poor due to the mixture of field and cluster spectra in the sample). While the claim is made that the Lick/IDS H index is age sensitive independent of abundance changes, the comparison in Figure 11 appears to indicate otherwise. The source of the difference between the Eisenstein et al. Lick/IDS values and the Schiavon analysis is the amount of in-fill corrections made to the spectra. Schiavon himself notes that, without these corrections, the H ages would be approximately 14 Gyrs, closer to our values. Secondary age estimates from the Lick/IDS system (such as the H index) produce even younger mean ages, however, these indices have serious technical difficulties in their application (Prochaska et al. 2007).
In section §3.4 we showed that it is impossible to distinguish, using our colors, between a galaxy with a mean age of 8 Gyrs and one with an old population (13 Gyrs) mixed with a 1% 1 Gyr burst. However, the former scenario would produce ages from the Lick/IDS system in concordance with our values and the frosting scenario would be an obvious candidate to explain the discrepancies between our age estimates and ones produced by the Lick/IDS technique (Tantalo & Chiosi 2004, James et al. 2005). Schiavon demonstrates that Eisenstein et al. values could be reproduced by assuming a 0.5 to 1% burst with a 1 Gyr population, and exact match to the effects of a mild burst on our continuum colors (see Figure 7). To see how a frosting scenario would resolve age discrepancy, consider the primary differences between the results derived from spectroscopy (i.e. the Lick/IDS system) and our continuum color technique: 1) spectroscopic values for [Fe/H] tend to higher than our values and 2) spectroscopic ages tend to be younger than our calculated ages (see red versus green diamonds for [Fe/H] in Figure 11 and the age histograms in Figure 5). In our most recent study of the metallicity values for ellipticals (Schombert & Rakos 2008), we performed a detailed study of the differences in mean [Fe/H] as determined by the Lick/IDS system (i.e. a direct measure of Fe lines) versus our technique (which determines [Fe/H] by model interpretation of the colors as driven by the position of the RGB). The correspondence between the two metallicities derived by spectroscopy and colors was good, however, the Lick/IDS values were consistently higher than our estimates by approximately 0.2 dex.
Examination into how the Lick/IDS measurements are made revealed the source of the difference in our two metallicities. Being a spectroscopic technique, the Lick/IDS values are extracted by slit observations of typically round galaxies. This means the light observed by spectroscopic methods is light extracted from a slice through the galaxy’s core. For galaxies in the redshift range of the Trager et al. study (between 1,000 and 5,000 km/sec), this means that the light through the slit represents only 1/10 to 1/3 the light of a galaxy as compared to our total luminosities or aperture colors (for standard slit widths of between 2 to 5 arcsecs). In addition, the light obtained by spectroscopy is highly weighted by core luminosity. In the typical galaxy observed at the distance of Coma, 70% of the luminosity measured by slit spectroscopy is due to stars within 1 kpc of the center (versus only 20% for imaging). For fiber studies, this effect is magnified as the data will only encompass the core of a galaxy with no halo component. When combining this bias with typical color gradients, Schombert & Rakos (2008) estimated that the resulting Lick/IDS metallicity values would be approximately 0.2 dex higher than values deduced from all the galaxy light (using a simple model of internal metallicity distribution), exactly in agreement with the color deduced values.
Whether the difference in age measurements made by the Lick/IDS system, versus our continuum color technique, is due primarily to an aperture effect will depend on the degree in which age gradients are found in ellipticals. Color gradient work finds that the measured gradients in ellipticals are fully explained by changes in metallicity from galaxy core to halo (Thomas et al. 2005). This is also supported by a study of color gradients as a function of redshift (Tamura et al. 2000) which found no evidence for changes in color gradients due to lookback time out to a redshift of 1. On the other hand, several line indice studies have detected significant age gradients in the H index (Tantalo et al. 1998, Sánchez-Blázquez et al. 2006b). Both these studies found younger stellar populations in their sample galaxy’s cores, as well as finding the cores to be more more metal rich and enhanced in elements (which would imply star formation from a simple burst rather than a prolonged event).
Thus, the discrepancy between ages determined by our continuum colors, which measure the integrated light from a galaxy, can be resolved if one considers a burst model. As bursts of star formation are concentrated in galaxy cores (Thomas 1999), then this will produce mean ages from spectroscopy skewed towards the burst mean age. In addition, the burst population, being formed later in a galaxy’s life, will be enriched in metallicity (agreeing with metallicity gradients).
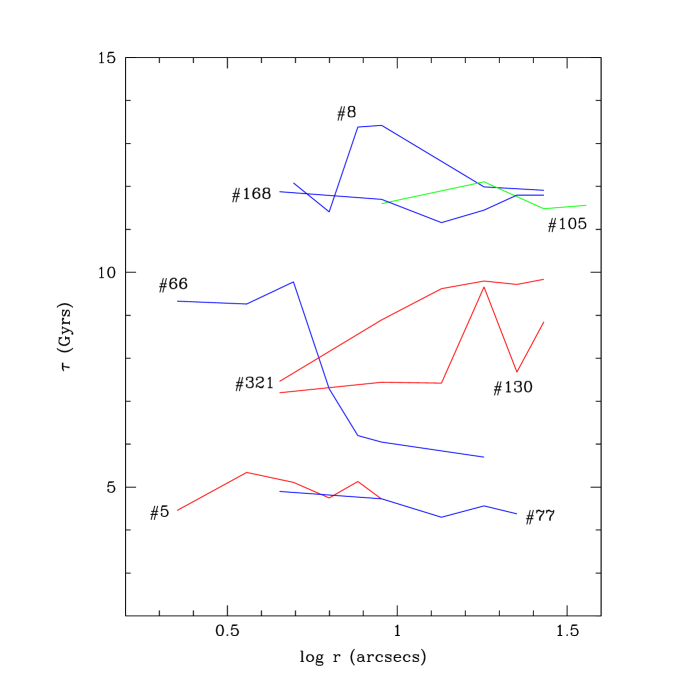
To consider age gradients in our own continuum color sample, we examined the change in age with radius for a sub-sample of galaxies in A1185. These age values are displayed in Figure 12, where the aperture radius is used and the calculated age values are deduced from the integrated colors of each aperture (versus a differential color). The observed gradient are small, typically only a few Gyrs. There are equal number of positive and negative gradients in Figure 12 and certainly nothing to indicate that spectroscopic studies are being influenced by an extremely young core population. However, as discussed in §3.4, our intermediate ages may be the combination of a young (less than 1 Gyr population) and an old, 12 Gyr population. Spectroscopic signatures of a burst population (i.e. the Balmer lines) may dominate the our continuum colors (Serra & Trager 2007). If true, then this would mean that the Lick/IDS technique is a powerful method of detecting small, medium aged bursts, but 1) produces an age measurement for the entire galaxy stellar population that is biased towards young values, 2) overestimates the metallicity of the galaxy (instead it measures the core [Fe/H] which should be a maximal value for the galaxy) and 3) deduces trends in /Fe which reflect the chemical evolution of the burst population, not the global values for the galaxy as a whole. All consistent with the differences we observe between color and line indice estimates of age and metallicity.
Lastly, the age differences between colors and line indices may also be due to other hot star contributions to a galaxy’s color and spectrum. For example, metal-poor horizontal branch (HB) stars display spectral features similar to new star formation signatures, particularly to the index and near-blue colors. However, in our examination of the internal metallicity distribution for ellipticals (Schombert & Rakos 2008), we estimated the contribution from an old, metal-poor component with a multi-metallicity model and measured its effect on our colors. We found that, while metallicity estimates must take an old population into account, the metallicity distribution derived is similar to that proposed by infall models of chemical evolution and that the calculated mean age is insensitive to the metal-poor components (Schombert & Rakos 2008). This is a recent change to our calculations due to the fact that the newest SED models (Schulz et al. 2002) use isochrone tracks and properly fit the advanced stages of stellar evolution (i.e. HB populations). This result is also in agreement with a similar analysis by Trager et al. (2005) where they find that the high H values for Coma galaxies has a small component from old, metal-poor HB stars, but that a younger burst population must be mixed with an older, primordial population to account for the variation in metallicity and age indices.
4 SUMMARY
We have presented a compendium of age and metallicity values determined using a narrow band color system. This method differs from age and metallicity determination by spectroscopic methods (e.g. the Lick/IDS system) by using a principle component analysis technique tied to SED models and calibrated by galactic globular age and [Fe/H] values. In addition, we have confirmed our age values by comparison to near-IR colors and varying SED models. Degeneracy constrains the range of age and metallicity of our method to objects greater than 3 Gyrs and more metal-rich than [Fe/H]=1.8, acceptable limits for the study of red cluster galaxies. Objects with current or very recent star formation can be identified by their colors, but their age and metallicity are not determined by our technique.
Our results can be summarized as the following:
-
•
We find that cluster early-type galaxies divide into two distinct populations. An old population with mean ages similar to the age of the Universe (i.e. primordial formation times). A second younger population, separated by a gap in age of about 2 Gyrs from the oldest galaxies. The age of the gap population is confirmed by their near-IR colors. This distribution differs compared to age distributions from SDSS studies (e.g. Gallazzi et al. 2006), in that we find very few cluster galaxies with ages less than 7 Gyrs and the gap is distinct in all our clusters. In addition, the lack of a smooth transition in age between the galaxy populations suggests that a secondary process influences the measured age of galaxies independent of the formation process. The large number of old galaxies will be a challenge to hierarchical models as the seed systems under those formation scenarios will require identical ages and metallicities.
-
•
We cannot distinguish, using SED models, between star formation history scenarios where the younger gap population is composed of a young age due to 1) later formation redshift, 2) longer initial star formation duration or 3) a later burst of star formation (a ’frosting event’, Trager et al. 2000). However, if the gap population is responsible for the high fraction of very young ages ( 7 Gyrs) found by many Lick/IDS studies, then this would argue for a frosting model as the spectroscopic studies are more sensitive to a younger population (Serra & Trager 2007), which would also explain the changes in /Fe with galaxy mass, a secondary clock to measure star formation duration.
-
•
While the oldest galaxies display very little correlation between age and metallicity, the gap population has a weak positive correlation between mean age and Fe/H. Since the youngest galaxies have the lowest metallicities, then this implies that late star formation does not contribute to the global metallicity of a galaxy.
-
•
A clear environmental imprint is found on the younger gap population as its cluster distribution is less concentrated than the older galaxies. While a later epoch of formation would explain this distribution (core galaxies forming a few Gyrs before the infalling population), the clustering properties of the younger galaxies are similar to the higher redshift Butcher-Oemler galaxies. We interpret this correlation to imply a dynamical evolutionary effect that induces late bursts of star formation.
-
•
The age of the oldest galaxies in a cluster is correlated with the cluster’s velocity dispersion (i.e. mass) which implies that galaxy and star formation in the more massive clusters begins earlier than in less massive clusters.
-
•
Surprisingly, there is no correlation between mean stellar population age and galaxy morphology or structure. Despite a large number of S0 galaxies in our sample, there is no evidence that they have younger mean ages as one would expected if their disks had been quenched in the last few Gyrs.
-
•
Age gradients were examined for a sub-sample of galaxies in A1185. Positive and negative age gradients were found with magnitudes of less than a few Gyrs from core to halo.
A clearer picture begins to emerge concerning the ages of galaxies when we combine the results from narrow band colors, near-IR colors, line indices and high redshift work. The correlations (and lack thereof) found herein, between age, metallicity and galaxy mass, support previous conclusions from the color-magnitude relation and galaxy velocity dispersion-metallicity relations. We also clarify the fact that the scatter in these relations exceeds the expected uncertainties from observational error. This is demonstrated in Figure 13, the color-magnitude for our color divided between the old population and the younger gap galaxies. The scatter is reduced dramatically when only the oldest galaxies are considered, even though the effect of age on is negligible over the range of 8 to 12 Gyrs. This implies the path that a particular galaxies takes through star formation and chemical evolution can vary, particular within varying environments and the oldest galaxies truly represent a standard monolithic collapse origin with a simple history of chemical evolution.
A comparison between age and metallicity values determined by the Lick/IDS system and our color scheme argues that the higher metallicities and lower galaxy ages measured by line indices are real absolute values that reflect different sensitives to age dependent features (see Serra & Trager 2007). Our technique finds a global value for age and metallicity that tends to be less metal-rich and older in luminosity weighted age. This would suggest strong age gradients in early-type galaxies such that values from line indice work are heavily weighted towards the core burst populations values; however, none are detected in our sample and their varying effect on age measurement techniques may disguise their presence.
In conclusion, the study of age in galaxies suffers from the dual nature of cluster galaxies in that they are are both young and old. A majority of cluster galaxies have primordial stellar populations, dating back to the era of galaxy formation plus for all cluster galaxies, a majority of their internal stellar populations are primordial. However, a significant fraction of cluster galaxies have a younger component that represents between 1% and 5% of the galaxy mass. The study of this burst population illuminates recent environmental processes in clusters and provides the connection to observed star formation at higher redshifts.
References
- Annibali et al. (2007) Annibali, F., Bressan, A., Rampazzo, R., Zeilinger, W. W., & Danese, L. 2007, A&A, 463, 455
- Arimoto & Yoshii (1987) Arimoto, N., & Yoshii, Y. 1987, A&A, 173, 23
- Ball et al. (2006) Ball, N. M., Loveday, J., & Brunner, R. J. 2006, ArXiv Astrophysics e-prints, arXiv:astro-ph/0610171
- Baugh et al. (1996) Baugh, C. M., Cole, S., & Frenk, C. S. 1996, MNRAS, 283, 1361
- Bedregal et al. (2006) Bedregal, A. G., Aragón-Salamanca, A., & Merrifield, M. R. 2006, MNRAS, 373, 1125
- Bender et al. (1992) Bender, R., Burstein, D. & Faber, S. 1992, ApJ, 399, 462
- Bower et al. (1992) Bower, R. G., Lucey, J. R., & Ellis, R. S. 1992, MNRAS, 254, 601
- Bregman et al. (2006) Bregman, J. N., Temi, P., & Bregman, J. D. 2006, ApJ, 647, 265
- Bruzual & Charlot (2003) Bruzual, G., & Charlot, S. 2003, MNRAS, 344, 1000
- Burstein et al. (1984) Burstein, D., Faber, S. M., Gaskell, C. M., & Krumm, N. 1984, ApJ, 287, 586
- Burstein et al. (2005) Burstein, D., Ho, L. C., Huchra, J. P., & Macri, L. M. 2005, ApJ, 621, 246
- Conselice (2007) Conselice, C. J. 2007, IAU Symposium, 235, 381
- Eggen et al. (1962) Eggen, O. J., Lynden-Bell, D., & Sandage, A. R. 1962, ApJ, 136, 748
- Eisenhardt et al. (2007) Eisenhardt, P. R., De Propris, R., Gonzalez, A. H., Stanford, S. A., Wang, M., & Dickinson, M. 2007, ApJS, 169, 225
- Eisenstein et al. (2003) Eisenstein, D. J., et al. 2003, ApJ, 585, 694
- Faber (1973) Faber, S. M. 1973, ApJ, 179, 731
- Ferreras et al. (1999) Ferreras, I., Charlot, S., & Silk, J. 1999, ApJ, 521, 81
- Gallazzi et al. (2005) Gallazzi, A., Charlot, S., Brinchmann, J., White, S. D. M., & Tremonti, C. A. 2005, MNRAS, 362, 41
- Gallazzi et al. (2006) Gallazzi, A., Charlot, S., Brinchmann, J., & White, S. D. M. 2006, MNRAS, 370, 1106
- Gonzalez et al. (1993) Gonzalez, J. J., Faber, S. M., & Worthey, G. 1993, Bulletin of the American Astronomical Society, 25, 1355
- Grebel (2003) Grebel, E. K. 2003, Hubble’s Science Legacy: Future Optical/Ultraviolet Astronomy from Space, 291, 140
- Grebel (2005) Grebel, E. K. 2005, Stellar Astrophysics with the World’s Largest Telescopes, 752, 161
- Greggio & Renzini (1983) Greggio, L., & Renzini, A. 1983, A&A, 118, 217
- James et al. (2006) James, P. A., Salaris, M., Davies, J. I., Phillipps, S., & Cassisi, S. 2006, MNRAS, 367, 339
- Jimenez et al. (2006) Jimenez, R., Bernardi, M., Haiman, Z., Panter, B., & Heavens, A. F. 2006, ArXiv Astrophysics e-prints, arXiv:astro-ph/0610724
- Jørgensen (1999) Jørgensen, I. 1999, MNRAS, 306, 607
- Kauffmann et al. (1993) Kauffmann, G., White, S. D. M., & Guiderdoni, B. 1993, MNRAS, 264, 201
- Kaviraj et al. (2006) Kaviraj, S., Rey, S. -., Rich, R. M., Lee, Y. -., Yoon, S. -., & Yi, S. K. 2006, ArXiv Astrophysics e-prints, arXiv:astro-ph/0601050
- Kaviraj et al. (2005) Kaviraj, S., Devriendt, J. E. G., Ferreras, I., & Yi, S. K. 2005, MNRAS, 360, 60
- Kormendy & Djorgovski (1989) Kormendy, J., & Djorgovski, S. 1989, ARA&A, 27, 235
- Kuntschner & Davies (1998) Kuntschner, H., & Davies, R. L. 1998, MNRAS, 295, L29
- Kuntschner et al. (2001) Kuntschner, H., Lucey, J. R., Smith, R. J., Hudson, M. J., & Davies, R. L. 2001, MNRAS, 323, 615
- Larson (1974) Larson, R. B. 1974, MNRAS, 166, 585
- De Lucia et al. (2006) De Lucia, G., Springel, V., White, S. D. M., Croton, D., & Kauffmann, G. 2006, MNRAS, 366, 499
- Maraston et al. (2003) Maraston, C., Greggio, L., Renzini, A., Ortolani, S., Saglia, R. P., Puzia, T. H., & Kissler-Patig, M. 2003, A&A, 400, 823
- Moore et al. (1996) Moore, B., Katz, N., Lake, G., Dressler, A., & Oemler, A. 1996, Nature, 379, 613
- Oconnell (1980) Oconnell, R. W. 1980, ApJ, 236, 430
- Odell et al. (2002) Odell, A. P., Schombert, J., & Rakos, K. 2002, AJ, 124, 3061
- Pagel (2001) Pagel, B. E. J. 2001, PASP, 113, 137
- Pipino & Matteucci (2004) Pipino, A., & Matteucci, F. 2004, MNRAS, 347, 968
- Pipino & Matteucci (2006) Pipino, A., & Matteucci, F. 2006, MNRAS, 365, 1114
- Poggianti et al. (2001) Poggianti, B. M., et al. 2001, ApJ, 562, 689
- Prochaska et al. (2007) Prochaska, L. C., Rose, J. A., Caldwell, N., Castilho, B. V., Concannon, K., Harding, P., Morrison, H., & Schiavon, R. P. 2007, AJ, 134, 401
- Rakos & Schombert (2005) Rakos, K., & Schombert, J. 2005, PASP, 117, 245
- Rakos et al. (1996) Rakos, K. D., Maindl, T. I., & Schombert, J. M. 1996, ApJ, 466, 122
- Rakos et al. (2001) Rakos, K., Schombert, J., Maitzen, H. M., Prugovecki, S., & Odell, A. 2001, AJ, 121, 1974
- Rose et al. (1994) Rose, J. A., Bower, R. G., Caldwell, N., Ellis, R. S., Sharples, R. M., & Teague, P. 1994, AJ, 108, 2054
- Sade (1797) de Sade, M. 1797, Juliette
- Sánchez-Blázquez et al. (2006) Sánchez-Blázquez, P., Gorgas, J., Cardiel, N., & González, J. J. 2006, A&A, 457, 809
- Schiavon (2007) Schiavon, R. P. 2007, ApJS, 171, 146
- Schombert (1987) Schombert, J. M. 1987, ApJS, 64, 643
- Schombert & Rakos (2008) Schombert, J. & Rakos, K. 2007, in preparation
- Schulz et al. (2002) Schulz, J., Fritze-v. Alvensleben, U., Möller, C. S., & Fricke, K. J. 2002, A&A, 392, 1
- Serra & Trager (2007) Serra, P., & Trager, S. C. 2007, MNRAS, 374, 769
- Stanford et al. (2004) Stanford, S. A., Eisenhardt, P. R., Rosati, P., & Holden, B. 2004, Bulletin of the American Astronomical Society, 36, 726
- Steindling et al. (2001) Steindling, S., Brosch, N., & Rakos, K. D. 2001, ApJS, 132, 19
- Tamura & Ohta (2000) Tamura, N., & Ohta, K. 2000, AJ, 120, 533
- Tantalo et al. (1998) Tantalo, R., Chiosi, C., Bressan, A., Marigo, P., & Portinari, L. 1998, A&A, 335, 823
- Tantalo & Chiosi (2004) Tantalo, R., & Chiosi, C. 2004, MNRAS, 353, 917
- Terlevich & Forbes (2002) Terlevich, A. I., & Forbes, D. A. 2002, MNRAS, 330, 547
- Thomas (1999) Thomas, D. 1999, MNRAS, 306, 655
- Thomas et al. (1998) Thomas, D., Greggio, L., & Bender, R. 1998, MNRAS, 296, 119
- Thomas et al. (2002) Thomas, D., Maraston, C., & Bender, R. 2002, Ap&SS, 281, 371
- Thomas et al. (2005) Thomas, D., Maraston, C., Bender, R., & Mendes de Oliveira, C. 2005, ApJ, 621, 673
- Tinsley (1980) Tinsley, B. M. 1980, Physical Cosmology, 161
- Tosi (2007) Tosi, M. 2007, ArXiv Astrophysics e-prints, arXiv:astro-ph/0701138
- Trager et al. (1998) Trager, S. C., Worthey, G., Faber, S. M., Burstein, D., & Gonzalez, J. J. 1998, ApJS, 116, 1
- Trager et al. (2000) Trager, S. C., Faber, S. M., Worthey, G., & González, J. J. 2000, AJ, 120, 165
- Trager et al. (2005) Trager, S. C., Worthey, G., Faber, S. M., & Dressler, A. 2005, MNRAS, 362, 2
- Vazdekis et al. (2001) Vazdekis, A., Kuntschner, H., Davies, R. L., Arimoto, N., Nakamura, O., & Peletier, R. 2001, ApJ, 551, L127
- Worthey (1994) Worthey, G. 1994, ApJS, 95, 107
- Worthey (1999) Worthey, G. 1999, Spectrophotometric Dating of Stars and Galaxies, 192, 283
- Yi (2003) Yi, S. K. 2003, ApJ, 582, 202