The young star cluster system of the Antennae galaxies
Abstract
The study of young star cluster (YSC) systems, preferentially in starburst and merging galaxies, has seen great interest in the recent past, as it provides important input to models of star formation. However, even some basic properties (like the luminosity function [LF]) of YSC systems are still under debate. Here we study the photometric properties of the YSC system in the nearest major merger system, the Antennae galaxies. We find evidence for the existence of a statistically significant turnover in the LF.
Keywords star clusters:general – galaxies: NGC 4038/39 – methods: data analysis
1 Introduction
Star clusters (SCs) form nearly instantaneously through the collapse of giant molecular gas clouds. Hence, all stars within a SC are approximately coeval, share the same chemical composition, and therefore represent a simple stellar population. A small number of parameters, in particular their initial chemical composition and initial stellar mass function, are enough to describe their colour and luminosity evolution on the basis of a given set of stellar evolutionary tracks or isochrones (e.g. Leitherer et al. 1999; Anders and Fritze-v. Alvensleben 2003; Bruzual and Charlot 2003). Therefore, observed spectrophotometric properties of SCs are relatively easy and straightforward to interpret.
SC formation is a major mode of all star formation, and possibly even the dominant mode in strong starbursts triggered in gas-rich galaxy mergers (e.g., Meurer 1995; de Grijs et al. 2003a). In addition, as SCs inherit and conserve the chemical abundances at the place and time of their birth up to old ages, they are excellent tracers of their parent galaxy’s properties in terms of star formation and chemical enrichment history.
One of the most basic and commonly used diagnostics to explore the properties of entire SC systems is their LF. While for old globular cluster systems the Gaussian shape of their LFs (and indeed mass functions) is well established (see e.g. Ashman and Zepf 1998; Harris 1991), the situation for young SCs is still under discussion. While mainly LFs consistent with a power-law, resembling the MF of nearby molecular cloud cores, are quoted for YSC systems ranging from Galactic open cluster to YSCs in major mergers (e.g. van den Bergh and Lafontaine 1984; Hunter et al. 2003; Schweizer and Seitzer 1998; Whitmore et al. 1999, see de Grijs et al. 2003b for a recent compilation), some studies find deviations from a power-law or direct evidence for Gaussian distributions (de Grijs and Anders 2006; Fritze-v. Alvensleben 1999; Goudfrooij et al. 2004).
To contribute to our understanding of this astrophysical question, which ties directly to the fundamental physical conditions of star formation in general, we performed an analysis of the young ( Myr) SC system formed during the, still ongoing, merging process in the nearest major merger of two giant gas-rich spiral galaxies, the Antennae galaxies, i.e. NGC 4038/39.
2 Photometry
We reanalysed the most homogeneous broad-band dataset including the U band of the Antennae galaxies available (providing photometry in ), obtained using HST/WFPC2 as part of programme GO-5962 (PI B. Whitmore).
We select our clusters based on:
-
•
a flux threshold compared to its surrounding
-
•
cross-correlation between filters (i.e. a cluster must be detected in several bands)
-
•
photometric errors 0.2 mag in each band
-
•
size measurements using BAOlab (Larsen 1999)
Selecting only clusters in the (PSF-corrected) size range to 25 pc (to avoid contamination by single stars and cluster complexes, respectively) yields a sample of 365 clusters, satisfying all selection criteria. Utilising the cluster sizes we apply size-dependent aperture corrections, as described in Anders et al. (2006).
3 Completeness
In this study we are primarily interested in the LF of the young star clusters. A consistent and reliable determination of the completeness fraction as function of cluster magnitude and all other relevant selection criteria/effects is therefore of prime importance.
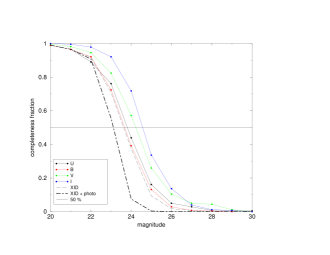
We investigated the completeness for a number of restrictions, taking successively more cluster selection criteria into account. Some of these results for artificial clusters with FWHM = 10 pc in a cluster-rich region in NGC 4038 are shown in Fig. 1.
First, we determined the completeness in each band independently (labelled ”U”,”B”, ”V” and ”I” in Fig. 1). Taking the cross-correlation into account (labelled ”XID”) reduced the completeness to slightly below the most limiting single-band completeness. By applying the photometric uncertainties restriction (labelled ”XID + photo”) the 50% completeness magnitude is decreased by about mag.
Using stars instead of extended objects as test sources artificially increases the 50% completeness magnitude by mag.
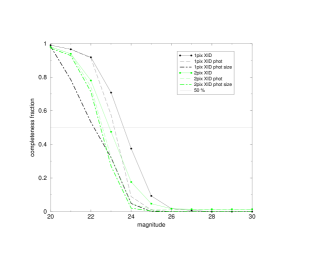
Computing completeness functions for 2 regions (characterised by different background and cluster density levels) and 2 sizes (characteristic for our observed cluster sample) and imposing the size restriction onto the artificial clusters (labelled ”XID photo size”) allowed us to attribute realistic completeness fractions to each individual cluster, strengthening the subsequent analysis of the LFs. Imposing the size restrictions decrease the completeness by up to mag, while different cluster sizes and regions within the galaxies contribute completeness changes of and mag, respectively. This very complex dependence of the completeness fractions on a number of input parameters clearly shows the necessity to model the completeness functions as realistically as possible, taking into account all cluster selection criteria. For the same region as in Fig. 1, results for different cluster sizes and selection criteria are shown in Fig. 2.
For additional details of the completeness determination, see Anders et al. (2007).
4 The model to analyse the luminosity functions
In collaboration with statisticians from the University of Göttingen we developed a suite of statistical tools. This allows to fit the LFs of our young star clusters with either a Gaussian distribution or a power-law, access the accuracy of the fits and the fitted parameters, and establish the statistical significance of differences in the goodness-of-fit between the two fitted test distributions.
The fitting of a observed LF takes the photometric error and appropriate completeness fraction of each individual cluster into account, and independently fits either a Gaussian distribution or a power-law to the LF, yielding a set of parameters characterising the best-fitting model and a likelihood parameter for either test distribution.
We find a strong superiority (measured by the ratio of the likelihoods for Gaussian and power-law fits) of the Gaussian fit compared to the power-law fit (see Sect. 5). To validate this result, we have to test its statistical significance, i.e. to determine the probability to achieve such strong superiority of the Gaussian distribution if the true underlying LF is a power-law, distorted by the error distribution and the completeness function. In a Monte-Carlo approach we draw artificial observations from the best-fitting power-law, use our statistics tools to fit them again with Gaussian and power-law distribution, and determine the likelihood ratio for these artificial observations. The likelihood ratio of the observed distribution compared to the distribution of likelihood ratios from our artificial tests then yields the probability that the determined superiority of the Gaussian fits is consistent with an underlying power-law distribution.
The uncertainties of the best-fitting model parameters are estimated by bootstrapping.
For additional details of the statistical model, see Anders et al. (2007).
5 Results
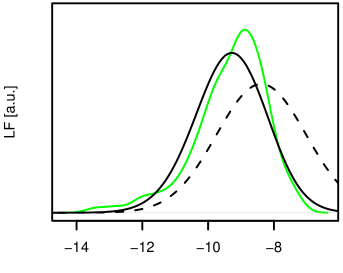
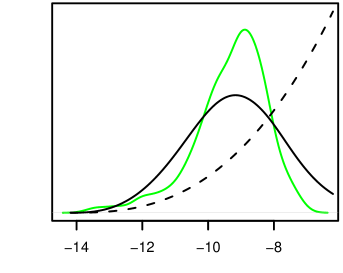
As example, the LF in the V band for our YSC sample in the Antennae galaxies is shown in Fig. 3. From visual inspection, the best fit with an underlying Gaussian distribution appears to represent the data better than the best fit with an underlying power-law distribution.
To quantify this, we perform our likelihood ratio test and the Monte-Carlo analysis. For the observed distributions we find a likelihood ratio value of 23.1 (where larger values are equivalent to a stronger superiority of the Gaussian fit when compared to the power-law fit). The Monte-Carlo analysis with 1000 test realisations drawn from the best-fitting power-law distribution results in a maximum likelihood ratio of 11.4, hence none of the test distributions can reproduce a superiority of the Gaussian distribution as strong as observed. Utilising the properties of Bernoulli-distributed variables, this corresponds to a probability 0.5% that the underlying distribution is still consistent with a power-law.
This result is valid also for the other bands (except the I band, for which the observations are significantly shallower), and for several age and size subsamples. For more details, see Anders et al. (2007).
Acknowledgements We would like to thank Nicolai Bissantz and Leif Boysen for their constant help and development of the statistics tools.
References
- Anders et al. (2007) Anders, P., Bissantz, N., Boysen, L., de Grijs, R., Fritze-v. Alvensleben, U.: Mon. Not. R. Astron. Soc. 377, 91 (2007)
- Anders and Fritze-v. Alvensleben (2003) Anders, P., Fritze-v. Alvensleben, U.: Astron. Astrophys. 401, 1063 (2003)
- Anders et al. (2006) Anders, P., Gieles, M., de Grijs, R.: Astron. Astrophys. 451, 375 (2006)
- Ashman and Zepf (1998) Ashman, K.M., Zepf, S.E.: Globular Cluster Systems. Cambridge astrophysics series ; 30. Cambridge University Press, Cambridge, U. K. ; New York (1998)
- Bruzual and Charlot (2003) Bruzual, G., Charlot, S.: Mon. Not. R. Astron. Soc. 344, 1000 (2003)
- de Grijs and Anders (2006) de Grijs, R., Anders, P.: Mon. Not. R. Astron. Soc. 366, 295 (2006)
- de Grijs et al. (2003b) de Grijs, R., Anders, P., Bastian, N., Lynds, R., Lamers, H.J.G.L.M., O’Neil, E.J.: Mon. Not. R. Astron. Soc. 343, 1285 (2003b)
- de Grijs et al. (2003a) de Grijs, R., Lee, J.T., Clemencia Mora Herrera, M., Fritze-v. Alvensleben, U., Anders, P.: New Astronomy 8, 155 (2003a)
- Fritze-v. Alvensleben (1999) Fritze-v. Alvensleben, U.: Astron. Astrophys. 342, L25 (1999)
- Goudfrooij et al. (2004) Goudfrooij, P., Gilmore, D., Whitmore, B.C., Schweizer, F.: Astrophys. J. Lett. 613, L121 (2004)
- Harris (1991) Harris, W.E.: Annu. Rev. Astron. Astrophys. 29, 543 (1991)
- Hunter et al. (2003) Hunter, D.A., Elmegreen, B.G., Dupuy, T.J., Mortonson, M.: Astron. J. 126, 1836 (2003)
- Larsen (1999) Larsen, S.S.: Astron. Astrophys. Suppl. Ser. 139, 393 (1999)
- Leitherer et al. (1999) Leitherer, C., Schaerer, D., Goldader, J.D., Delgado, R.M.G., Robert, C., Kune, D.F., de Mello, D.F., Devost, D., Heckman, T.M.: Astrophys. J. Suppl. Ser. 123, 3 (1999)
- Meurer (1995) Meurer, G.R.: Nature 375, 742 (1995)
- Schweizer and Seitzer (1998) Schweizer, F., Seitzer, P.: Astron. J. 116, 2206 (1998)
- van den Bergh and Lafontaine (1984) van den Bergh, S., Lafontaine, A.: Astron. J. 89, 1822 (1984)
- Whitmore et al. (1999) Whitmore, B.C., Zhang, Q., Leitherer, C., Fall, S.M., Schweizer, F., Miller, B.W.: Astron. J. 118, 1551 (1999)