The case for OH suppression at near-infrared wavelengths
Abstract
We calculate the advances in near-infrared astronomy made possible through the use of fibre Bragg gratings to selectively remove hydroxyl emission lines from the night sky spectrum. Fibre Bragg gratings should remove OH lines at high resolution (), with high suppression (30dB) whilst maintaining high throughput ( per cent) between the lines. Devices currently under construction should remove 150 lines in each of the and bands, effectively making the night sky surface brightness magnitudes fainter. This background reduction is greater than the improvement adapative optics makes over natural seeing; photonic OH suppression is at least as important as adaptive optics for the future of cosmology.
We present a model of the NIR sky spectrum, and show that the interline continuum is very faint ( photons s-1 m-2 arcsec-2 m-1 on the ecliptic plane). We show that OH suppression by high dispersion, i.e. ‘resolving out’ the skylines, cannot obtain the required level of sensitivity to reach the interline continuum due to scattering of light. The OH lines must be suppressed prior to dispersion.
We have simulated observations employing fibre Bragg gratings of first light objects, high redshift galaxies and cool, low-mass stars. The simulations are of complete end-to-end systems from object to detector. The results demonstrate that fibre Bragg grating OH suppression will significantly advance our knowledge in many areas of astrophysics, and in particular will enable rest-frame ultra-violet observations of the Universe at the time of first light and reionisation.
keywords:
infrared:general–instrumentation:miscellaneous–atmospheric effects–cosmology:early Universe1 Introduction
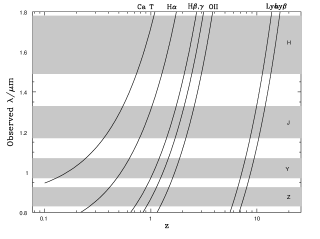
The future of cosmology is dependent in part on the ability to achieve deep observations at near-infrared (NIR) wavelengths. As we strive to observe the early Universe, our observations must be performed at increasingly longer wavelengths, as the diagnostic optical spectroscopic features become more redshifted. At very high redshifts, observations in the optical become futile due to the redshifted Lyman limit. Figure 1 shows the observed wavelengths of several useful spectroscopic lines as a function of redshift, illustrating the requirement for NIR observations.
The need for NIR observations is well documented. Over the last few years there have been several major reviews of the current status of our knowledge of the Universe, and in particular of gaps in our understanding, serving as a starting point for strategic plans for future observations (e.g. the Australian Decadal Plan for Astronomy 2006-2015111http://www.atnf.csiro.au/nca/DecadalPlan_web.pdf, the UK PPARC roadmap222http://www.so.stfc.ac.uk/roadmap/rmQuestionsHome.aspx, the US National Research Council’s ‘Astronomy and Astrophysics in the New Millennium’ NRC 2001 and ‘Connecting Quarks to the Cosmos’ Committee On The Physics Of The Universe et al. 2003).
These reviews provide similar lists of the ‘big questions’ for the future of astronomy, showing a consensus of opinion at an international level. Some of the key issues they identify are: What is the nature of dark energy and dark matter? How and when do the first stars form? How and when did the Universe reionise? How and when do galaxies assemble, and how do they evolve? What is the relationship between super-massive black-holes and galaxies? How do stars and planetary systems form? How common are planetary systems capable of supporting life?
The success of answering the questions above is reliant on NIR observations. The first half of the list depends upon the ability to observe the high redshift Universe, whilst the problems concerning planetary systems will also benefit from dust-penetrating NIR observations, especially since planetary sized bodies emit most of their radiation at NIR wavelengths.
Observations of high redshift galaxies carried out in the NIR offer significant advantages over optical observations: extinction due to local dust is smaller in the NIR; -corrections are smaller, and therefore less critical; adaptive optics is easier to achieve in the NIR. However, there are also significant disadvantages in NIR astronomy, the chief concern being the high background level. Table 1 lists typical surface-brightnesses for a good observing site, as used in the ESO ELT exposure time calculator333http://www.eso.org/observing/etc/bin/ut3/conica/script/eltsimu.
| Surface brightness/ mag arcsec-2 | ||
| Band | Natural | No OH emission |
| U | 21.5 | – |
| B | 22.4 | – |
| V | 21.7 | – |
| R | 20.8 | 21.7 |
| I | 19.9 | 21.7 |
| J | 16.0 | 22.1 |
| H | 14.0 | 22.2 |
At wavelengths longer than the band, thermal emission from the telescope and surroundings dominate the background emission. Therefore the detector and camera must be designed to operate at cryogenic temperatures – a significant technical challenge. At shorter wavelengths the thermal background is less problematic but instead there is the supplementary frustration of very bright hydroxyl emission (Meinel 1950; Dufay 1951), resulting from the vibrational decay of an excited OH-radical, formed from the combination of a hydrogen atom with an ozone molecule. Furthermore the intensity of the OH emission is highly variable (see section 2.1.2 below), making accurate sky subtraction very difficult (e.g. Davies 2007).
The intensity and variability of the NIR background have traditionally restricted the depth of NIR observations compared to optical observations. However, two attributes of the NIR background spectrum suggest that in principle it should be possible to obtain very deep observations in the NIR. Firstly the OH spectrum comprises nearly all ( per cent from our model, see § 2) of the and band background. The interline continuum, due mainly to zodiacal scattered light, is expected to be very faint, e.g. the models of Kelsall et al. (1998) give a flux density of only photons s-1 m-2 arcsec-2 m-1 on the ecliptic plane. Secondly, the OH lines are intrinsically very narrow (Turnbull & Lowe 1983), meaning that large sections of the NIR sky spectrum will be very dark if the OH lines can be efficiently removed, thus enabling deep observations.
There are several methods which can, in principle, exploit the dark interline continuum for deep NIR observations, including narrow-band filters which allow observations of a very short bandpass between lines (e.g. DAzLE; Horton et al. 2004), or space-based telescopes (e.g. JWST; Gardner et al. 2006). Here we discuss ground-based OH suppression, by which we mean the selective removal (by means of low transmission, reflection etc.) of very narrow regions of the spectrum corresponding to the OH lines, whilst maintaining high throughput in the interline regions. There have been several methods proposed to achieve OH suppression, including spectroscopic masking at high dispersion (e.g. Maihara & Iwamuro 2000), rugate filters (Offer & Bland-Hawthorn 1998) and multi-notch holographic filters (Blais-Ouellette et al. 2004). We discuss these methods in section 5.1; each offers potential improvements over natural conditions, but in practice there are problems in achieving efficient OH suppression by any of these means. By efficient we mean achieving high suppression of the lines whilst maintaining high interline throughput, for a large number of lines (). In this paper we make the case for using fibre Bragg gratings (FBGs, see Bland-Hawthorn et al. 2004) to achieve OH suppression (§ 5.2); FBGs do not suffer from any of the drawbacks that have prevented successful application of the methods mentioned above. There is now a real case for believing that highly efficient OH suppression is close to being demonstrated.
Before discussing methods of OH suppression, we first review the background sources contributing to the NIR in section 2. We then address the scattering properties of dispersive optics (§ 3), the proper understanding of which is essential to achieve efficient OH suppression. The study of scattering shows that the OH lines must be suppressed prior to dispersion; the combination of the extremely bright OH lines and the strong scattering wings, that are an unavoidable consequence of any diffraction system, make attempts to remove or ‘resolve out’ the OH skylines after dispersion futile. We then make the case for OH suppression, i.e. selectively removing the OH lines prior to dispersion (§ 4), including a review of previously proposed methods (§ 5.1), and their limitations. We then show that fibre Bragg gratings offer the prospect of cleanly and efficiently removing OH lines photonically (§ 5.2). We calculate the required level of suppression and spectral resolution to achieve scientifically useful observations. We summarise our case in section 5.4, and conclude with some remarks on the future in section 6.
2 The NIR background
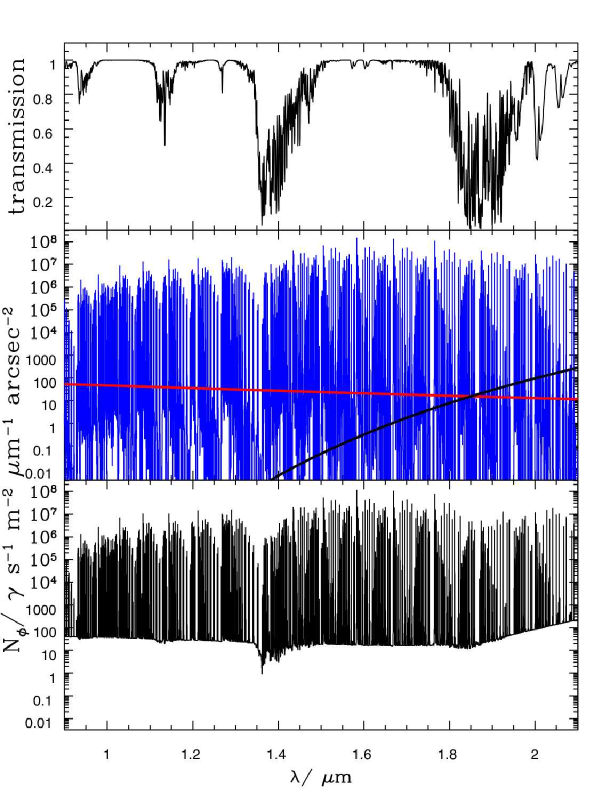
We now consider the various elements that contribute to the NIR background, focussing on the wavelength range 0.9–2.0m, as the region in which OH suppression will be most effective. Following Tokunaga in chapter 7 of Cox (2000), we divide the NIR background into the following components: the OH airglow; the thermal emission from the ground based telescope; the atmospheric thermal emission; the zodiacal scattered light; zodiacal emission; galactic dust emission; the cosmic microwave background radiation. Each of these will be discussed in turn. Our final model of the NIR background spectrum is shown in Figure 9.
2.1 Hydroxyl emission lines
2.1.1 Emission mechanism
The OH emission (Meinel 1950; Dufay 1951) is by far the largest component of the NIR background at m. At longer wavelengths the background is dominated by thermal emission, from the telescope and dome etc. The exact wavelength where the thermal emission becomes dominant depends on the temperature of the environment, as illustrated in Figure 2, which shows the wavelength at which the blackbody spectrum from the telescope exceeds the blackbody spectrum of the zodiacal scattered light, i.e. a lower limit to the wavelength at which OH emission dominates the background. Thus for very cold sites, such as Dome C in Antarctica with an average year round temperature of (see Burton et al. 2005) OH suppression would be effective at wavelengths .

The OH emission arises mainly from the combination of hydrogen and ozone from a layer about 9km thick at an altitude of around 87km. This reaction leaves a rotationally and vibrationally excited OH molecule (and an oxygen molecule) with a radiative lifetime of a few milliseconds (Content 1996, and references therein). The emission then results from the vibrational decay of the molecule, i.e.,
| (1) |
The intrinsic width of the lines is determined from the Doppler shift due to the thermal motions of the molecules, from pressure broadening, and from natural broadening. The former effect dominates the inner width of the line and has a Gaussian form, whereas the latter has a Lorentzian profile, giving the lines broad wings, albeit very faint ones.
The Doppler width can be estimated from the following argument. For a gas in thermal equilibrium the gas particles will have a distribution of speeds, but the most probable speed will be when the kinetic energy, is equal to the thermal energy . Thus the light emitted from the gas particle will be Doppler shifted by an amount . Thus,
| (2) |
where is the mass of the particles, and is the gas temperature. Thus for OH molecules at a temperature of K (Rousselot et al. 2000), m.
Pressure broadening is the result of interactions or collisions with neighbouring particles in the gas. The effect can be estimated by considering the average time between collisions or encounters, , which is approximately equal to the mean free path divided by the average speed of the particles, i.e.
| (3) |
where is the collisional cross section and is the number density. It is assumed that the shape of the line is Lorentzian, which is the result of an emitting atom undergoing simple harmonic motion. Substituting equation 3 into equation 7 yields,
| (4) |
We adopt m, an upper limit based on the difference in wavenumber of cm-1 quoted by Turnbull & Lowe (1983).
Natural broadening is due to the Heisenberg uncertainty in the particles energy,
| (5) |
where is the duration of the change in energy, such that,
| (6) |
The full calculation shows that the FWHM is in fact twice this value,
| (7) |
Thus for a vibrationally excited state lasting a few milliseconds, the natural broadening is m at m.
From the above estimates the Doppler broadening is by far the most dominant contribution to the intrinsic width of the line. However, due to the much broader wings of the Lorentzian pressure broadening, this mechanism is not negligible, as it will contribute much more to the region between the line peaks. The natural broadening can be safely neglected. Therefore in modelling the OH emission line spectrum we include both the Doppler broadening and the Lorentzian profile, i.e. we use a Voigt profile,
| (8) |
where and is the full-width at half maximum of the Doppler broadened line given by equation 2, and is the half-width at half maximum of the pressure broadened line given by in equation 4.
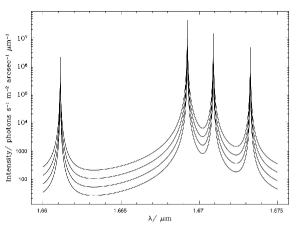
In our models we assume a temperature at 87km of 200K and m. The resulting Voigt profile is shown over a range of m in Figure 3 for the brightest doublets in the band (which are not resolved). The plot is logged to emphasise the Lorentzian wings which are significant out to m either side of the line centre (c.f. zodiacal scattered light described below). However in practice the interline continuum is dominated by instrumental scatter. We include this effect in our model, but in practice line widths are dominated by the instrumental profile (see § 3) and doublet separations.

Note that although the intrinsic width of any individual line is extremely narrow, as shown in Figure 3, the OH spectrum is actually composed of close doublets. The doublets are of equal intensity (Osterbrock et al. 1996) and arise due to -type doubling (see Herzberg 1939) from the interaction between the rotation of the O and H nuclei and the orbital angular momentum of the electron. The practical line width is determined by the separation of these doublets. Using the models of Rousselot et al. (2000), we have determined the doublet separation for all lines in the wavelength range , shown in Figure 4. The distribution is strongly peaked at separations of 0.1–0.2 Å, which gives a practical limit to the line widths. Note though, that we model the OH spectrum by treating each line individually.

2.1.2 Variability
The OH emission is not only extremely bright, but it is also highly variable in the spatial and temporal domain. This has significant consequences for the removal of the night sky background from observations. Despite its strong variability a few trends with time and space are known. The intensity of the lines increases with zenith distance due to the longer path length through the emitting layer of the atmosphere. The intensity changes as,
| (9) |
where is the zenith angle, is the intensity at , is the radius of the Earth and is the altitude of the emitting layer above the ground (Content 1996).
The temporal variation is due to two main causes: diurnal variation in temperature, and density waves in the upper atmosphere.
The diurnal variation has been modelled by Shimazaki & Laird (1970), taking into account reactions between 14 molecular species and diffusion. We show their model in Figure 5, and summarise their description of the variations. The features result from two emission layers, a broad layer at 45km altitude and a narrow layer at 80km. The height of the lower layer rises in the afternoon, and partially disappears around sunset, causing a dip in the OH emission. About twenty minutes after sunset, both layers rise and the intensity of the emission is greatly enhanced due to an increase in the ozone content at sunset; this causes the sudden rise in the models. After sunset the lower layer disappears completely because of the removal of hydrogen, and the upper layer decreases slowly due to the decrease of O3. There is also a rapid dimming and brightening around sunrise. This model is consistent with observations, which show a decrease by a factor in the OH emission throughout the night (Ramsay et al. 1992; Content 1996). The model is well approximated by the function , where is the time in hours, as shown in Figure 5. We assume that a typical nights observing lasts for 8hrs, so for observations longer than than this we reset the OH brightness every 8hrs.

Aside from this long term decline in OH line strength throughout the night, there is also short term variability caused by density waves (Ramsay et al. 1992; Frey et al. 2000). These are typical periodic variations of length 5 – 15 minutes, with an amplitude of about a tenth of the flux.
We assume that all OH lines vary in unison for our simulations. In fact the real situation is more complicated; lines within the same transition will be correlated, but separate transitions will not. However, to a reasonable approximation, lines from a particular transition all lie within the same region of the spectrum, with very little contribution from other transitions (Davies 2007). Hence the assumption of unison will be true for sections of spectrum m long.
2.1.3 Line list
Rousselot et al. (2000) have modelled the emission spectrum of the night-sky OH lines, giving accurate wavelengths for 4732 lines, and approximate relative intensities. In order to use this atlas we have normalised the theoretical relative intensities to the fluxes measured by Maihara et al. (1993b) (after first removing the O2 lines). The lines were measured with a resolving power of and remained unresolved. Since the OH lines are close doublets we combine all theoretical lines which have a separation of , before comparing the theoretical and observed line strengths. Figure 6 shows the correlation between the theoretical line strengths and the measured line strengths. There is a significant difference between the J and H band data, and the H band data shows a stronger correlation. This is indicative of the transient nature of the OH lines. We have used the geometric mean of the J and H band correlations to calibrate the Rousselot data.

2.2 Other lines
There are a number of O2 and N2 lines in the J band that are not included in the models of Rousselot et al. (2000). These lines are self-absorbing and dim rapidly after sunset (Content 1996). We have included line strengths for these taken directly from Maihara et al. (1993b). For simplicity, we have assumed they are broadened according to exactly the same prescription as the OH lines.
2.3 Thermal emission from the telescope
There will be significant thermal emission from the telescope and the instrument employed. The instrument design can be optimised to cool as many parts as possible thereby minimising its contribution to the background, but some parts, e.g. optical fibres may be external to the main instrument dewar and therefore unable to be cooled. Even so, the main contribution will come from the much larger telescope, and we model the emission as a black-body spectrum at K, with an emissivity of (chapter 7, Cox 2000), i.e.,
| (10) |
which can be expressed as a surface brightness,
| (11) | |||||
in units of .
2.4 Zodiacal scattered light
Zodical light is emission from sunlight scattered by interplanetary dust. As such it has a solar spectrum, multiplied by the scattering efficiency as a function of wavelength. Individual measurements in the optical (e.g. Levasseur-Regourd & Dumont 1980) and the NIR (e.g. Noda et al. 1992; Matsumoto et al. 1996) seem to show a solar spectrum when considered individually, but have different normalisations when compared, with the NIR zodiacal spectrum being twice as bright due to the increased scattering efficiency off larger dust particles at longer wavelengths (Matsumoto et al. 1996).
The brightness of the zodiacal light obviously decreases as a function of ecliptic latitude. Kelsall et al. (1998) have modelled the zodiacal light in detail in order to remove this component when analysing data from the COBE Diffuse Infrared Background Experiment (DIRBE). We approximate the Kelsall model with a Lorentzian function, which enables a faster calculation whilst maintaining most of the accuracy. In Figure 7 we show their model’s dependence on ecliptic latitude, , for 1.25m emission and our fit to it given by,
| (12) |
where is in radians.

For the majority of astronomical applications of FBGs we anticipate a preference for high galactic latitudes, and therefore a wide range of ecliptic latitudes depending on the galactic longitude, which could change the zodiacal brightness by a factor of .
For the purposes of the model we normalise a solar spectrum (using equation 11 with and K) to the Kelsall et al. (1998) model value for the ecliptic plane. Several measurements and models of the zodiacal scattered light exist in the literature. These are compiled in Table 2. Note that while the models predict the zodiacal scattered light should be fainter at longer wavelengths (since it has the form of a K black-body) the measured data disagree with this. Note too, that the ground based measurements are rather higher than the models. In section 3 we suggest that for the ground based measurements scattering of OH light may have a significant contribution to these values.
| Source | Measurment or | Flux/ s-1 m-2 arcsec-2 | Ecliptic Latitude/ | |
|---|---|---|---|---|
| model | J | H | degrees | |
| Maihara et al. (1993b) | Measurement | – | 590 | – |
| Cuby et al. (2000) | Measurement | 1200 | 2300 | – |
| Thompson et al. (2007) (NICMOS) | Measurement | 72 | 150 | -45 (HUDF) |
| Thompson et al. (2007) (NICMOS) | Measurement | 74 | 220a | 57 (HDF-N) |
| Thompson et al. (2007) (IRTS NIRS) | Measurement | — | 110 | – |
| Kelsall et al. (1998) | Modelb | 43 | – | 46 (Lockman Hole) |
| Kelsall et al. (1998) | Model | 99 | – | 0 |
| NICMOS handbookc | Model | 130 | 77 | 0 |
| NICMOS handbook | Model | 50 | 31 | 45 |
| Stockman et al. (1998) JWST | Model | – | 3 | 1AU orbit |
2.5 Moonlight
Moonlight is known to be an insignificant source of background with conventional NIR observations. This is because the OH skylines dominate over scattered moonlight and also because Rayleigh and Mie scattering are both less efficient at longer wavelengths; Rayleigh scattering has a dependence and Mie scattering has a dependence. However in the regime of OH-suppressed observations these assumptions need to be re-evaluated.
Krisciunas & Schaefer (1991) present a model of the brightness of scattered moonlight that is accurate to 23 per cent. However, this model is only appropriate for observations in the band. Therefore we have adopted the procedure described in the CFHT Redeye Manual444See http://www.cfht.hawaii.edu/Instruments/Detectors/IR/Redeye/Manual/chapter7.html to adapt the model to NIR wavelengths. The principal changes are allowing for the change in colour assuming a solar spectrum, and allowing for the wavelength dependence of the scattering function. We show the results of the model in Figure 8. Comparing to estimates of the zodiacal scattered light shows that for observation at a full, or nearly full, moon, then scattered lunar light would be significant out to degrees from the moon. OH suppressed observations should therefore not be performed around the full moon, though ‘grey nights’ should be acceptable. We note that the effect of scattered moonlight could have had an effect on previous attempts to measure the interline continuum, if these were performed in bright time and the contribution due to moonlight was not taken into account.


2.6 Other components
There are a number of other components that make important contributions to the IR background at longer wavelengths (m), but are negligible in the regime considered here. These are: the thermal contribution from the atmosphere, zodiacal emission from interplanetary dust at the ecliptic pole, Galactic emission from from interstellar dust, the cosmic background radiation.
It is possible that there is also a faint continuum or pseudo-continuum composed of line emission from NO2 or other atmospheric models (Content 1996). Such emission could perhaps explain some of the discrepancy between measurements of the zodiacal scattered light and the ground based measurements of the interline continuum. However there are no reliable measurements of this continuum, since previous estimates do not take into account the instrumental scattering profile (§ 3), therefore we do not include any such continuum in our model.
2.7 Atmospheric transmission
The dominant absorption features of NIR light are those due to water, carbon dioxide, nitrous oxide, methane and ozone in the atmosphere, which define the J, H and K band photometric windows. We have used the model transmission profile at Mauna Kea assuming an airmass of 1.0 and a Water vapour column of 1.6mm in our default sky background model (Lord 1992, obtained from Gemini Observatories555http://www.gemini.edu/sciops/ObsProcess/obsConstraints/ocTransSpectra.html). See Figure 9.
3 Scattering of dispersive optics
Because the OH lines are so bright compared to the interline continuum (see Figure 9) they cannot be cleanly removed through high dispersion spectroscopy. This is because even a small amount of scattered OH light will swamp the true interline continuum. To see this, consider the example of a ruled diffraction grating. The theoretical normalised intensity distribution of a grating with lines is given by,
| (13) |
where,
| (14) | |||
| (15) |
and is the wavenumber, is the slit width, is the slit separation, and is the angle through which the light is diffracted.
Woods et al. (1994) show that equation 13 may be represented as a Lorentzian plus a constant background,
| (16) |
where is the ratio of intensity at wavelength to intensity at , is a constant background term due to Rayleigh scattering and
| (17) |
and it is assumed that and . Equation 16 is normalised by a factor 1/(), where is the groove spacing.
The most important factor in determining the line contribution is the number of effective lines. In theory the number of effective lines should be the number of lines illuminated. However, Woods et al. (1994) find that is always measured to be much lower than this theoretical limit. In practice can be taken to be the smallest number of consecutive grating grooves with no imperfections. Woods et al. (1994) report values that are typically 0.25–0.5 the theoretical upper limit, but occasionally as low as 0.16. Further from the line centre the constant background also becomes important.
Woods et al. (1994) fit profiles to 10 different types of gratings including holographically and mechanically ruled gratings and find the scattered light is indeed well fit by a Lorentzian plus constant. Our own measurements with IRIS2 (a grism spectrometer) and AAOmega (a VPH spectrometer) arc spectrum confirm this; we find that the spectral line profile can be fit by a function,
| (18) |
which is simply a Gaussian plus a Lorentzian, with a contribution of factor from the Gaussian and from the Lorentzian, and the Lorentzian has FWHM times larger than that of the Gaussian. We find typical values of –6 and –0.97. In Figure 10 we show a fit to the IRS2 and AAOmega arc spectra.


We now show the effects of these scattering wings on the OH spectrum, and in doing so we address the large discrepancy between the ground-based observations of the interline continuum listed in Table 2 and the model values. We show the effect of scattering on the OH lines around m, where Maihara et al. (1993b) measured the interline continuum.
We have modelled the scattering from the University of Hawaii 2.2m Coudé spectrograph, with the 600 lines/mm grating, and m used for the H band observations by Maihara et al. (1993b). We have assumed , the value for the Bausch & Lomb grating used by Woods et al. (1994).
We use equation 16 to model the scattering profile as it can be normalised exactly. Note that this will provide a slightly conservative estimate of the scattering far from the line centres, as the wings in equation 16 drop off faster than in the full equation.
In Figure 11 we show the scattered light from all H band lines reported in Maihara et al. (1993b) in the window 1.660–1.675 (c.f. their figure 2) whence the continuum emission was measured. It is unclear what the theoretical value of should be, i.e. the number of illuminated lines, but it will be much less than (e.g. Woods et al. 1994). The real value of , i.e. the smallest number of consecutive lines without imperfections will be smaller again. Therefore we show plots for four different values of : for cm lines mm-1, i.e. the absolute maximum number of lines, and for values of , 30,000 and 15,000. The scattered wings are higher for fewer lines. These estimates give a scattered light intensity of between 35 and 280 photons s-1 m-2 arcsec-2 m-1 at 1.665m. Thus it is possible that scattered light could account for a significant part of the difference between our predicted value of the continuum at m and that measured by Maihara et al. (1993b), if the number of imperfections in the grating is high.
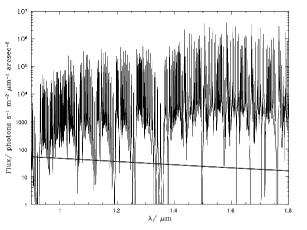
The scattering behaviour of dispersive optics thus prevents observations reaching the level of the interline continuum regardless of instrument background or spectral resolution. For example in Figure 12 we show the relative strengths of the OH spectrum with a resolution of (using a scattering profile of the form equation 18 with and ) and the interline continuum at an ecliptic latitude degrees over the range m. The interline continuum is reached for only 11 per cent of the spectrum between m, and 3 per cent between m.
4 The case for OH suppression
By OH suppression we mean the selective removal of OH lines from the incident light whilst allowing light either side of the deleted line to pass through with high efficiency (as opposed to OH avoidance by narrow band filters e.g. Horton et al. 2004, which selects light between OH lines, and is therefore restricted to narrow bandpasses). We discuss how this may be achieved using fibre Bragg gratings below (§ 5.2). First however, we address the desired performance of a general OH suppression system.
The OH spectrum contains hundreds of bright lines (Rousselot et al. 2000; see § 2). An OH suppression system must remove a section of finite wavelength, , from the incident spectrum for each line to be suppressed. After suppression, these regions will be unsuitable for any scientific analysis. Therefore OH suppression comes with the penalty of reducing the useful bandpass of the spectrum, which will vary with the number of lines suppressed and the size of the ‘notches’, . In practice the regions around bright OH lines are not usually suitable for scientific analysis in any case, since the variation of the OH emission hampers the success of sky-subtraction and residual sky lines are usually observed.
In designing an OH suppression system it is thus necessary to choose how many lines to remove and at what resolution in order to maximise the efficiency of the system. We now address this issue for notches fixed at 1Å, 3Å and 10Å (, 3000 and 1000), for varying numbers of lines. The lines are suppressed in order of their relative brightness, with the brightest lines removed first. We measure the efficiency of the system by the fraction of useable spectrum remaining and the brightness of the faintest line suppressed (as an estimate of the expected sensitivity of the observations). Note that in practice many OH lines are very close doublets, and therefore these can be removed with a single 1Å notch.
Figure 13 shows the results for up to 200 notches across the and bands. Even with 200 lines of width 1Å, suppressing down to a level of photons s-1 m-2 arcsec-2 m-1 (far fainter than would practically be necessary), only 8 per cent of the band has been removed, and only 7 per cent for 200 lines in the band. Thus, by virtue of the intrinsic slenderness of the OH-emission lines, suppression at high resolution is a highly desirable objective, maintaining a large fraction of scientifically useful wavelength range, whilst vastly increasing signal to noise.


5 Methods of OH suppression
There are several methods which have been proposed, and in some cases employed, to achieve OH suppression. However, to date no instruments exist which can suppress OH light at high efficiency whilst maintaining good interline throughput. In the next section we will review proposed methods of OH suppression and address their limitations. This will be followed by a discussion of FBGs, in which we will argue that there is now a real case for believing that highly efficient OH suppression will finally be acheived.
5.1 Previous methods of OH suppression
5.1.1 High dispersion masking
Maihara et al. (1993a) present a method of OH suppression using high dispersion and a ruled mirror. The basic idea is to disperse the light at high resolution, whereupon it is reflected from a mirror-mask, which has a series of black lines coincident with the position of the OH lines, which are therefore not reflected. The reflected light, with the OH lines removed, then proceeds back through the camera and grating system in the opposite direction to its initial journey, and hence is recombined into a ‘white-light’ beam. This final beam may then be dispersed at low resolution as required.
This method of mechanically removing the OH light and recombining is preferable to using software to achieve the same result, e.g. by removing the OH lines, then rebinning the spectrum, because the read-noise becomes much more significant for a highly dispersed spectrum (Iwamuro et al. 1994).
Spectrographs employing this technique have been built and used on the Subaru telescope, e.g. OHS+CISCO (Iwamuro et al. 2001; Motohara et al. 2002), and on the University of Hawaii 2.2m (Iwamuro et al. 1994). These instruments succeeded in reducing the cores of the OH lines to per cent of their original strength. However, it is the reduction in the background between the lines that is important in assessing the merit of an OH suppression system, since this is where scientific measurements will be made. Thus the fundamental limit to the performance of OHS-style suppressors is the scattering of the OH light. This process was described in detail in section 3. Figure 11 illustrates the problem: the Lorentzian scattering wings prevent the interline continuum ever being reached. This is true even at high resolution as shown in Figure 12. Furthermore, in a mirror-mask system the problem of scattered light is compounded, since scattering will occur for each pass through the grating system, and from diffraction from the mirror-mask itself. The scattered wings of the OH line remain in the spectrum since only the core of the line is suppressed with the mirror mask; between the lines the gains will be much less. To realise efficient OH suppression this scattering problem must be avoided; the OH light must be removed prior to dispersion.
The same principle of a mirror-mask design is being used in FMOS (fibre multi-object spectrograph; Maihara et al. 2000), which should begin use on the Subaru telscope in 2008. The performance of the OH suppressing part of the FMOS instrument is expected to be similar to OHS, but with the advantage of multiplexed observations and improved spectrographs.
5.1.2 Rugate filters
Rugate filters have been proposed by Offer & Bland-Hawthorn (1998) as a method of OH suppression applicable to imaging. Rugate filters consist of a transparent substrate onto which is deposited a thin film of dielectric material. By varying the composition of the film as it is deposited the refractive index can be made to vary throughout the coating. By controlling the refractive index variation any arbitrary transmittance profile may be designed, e.g. by combining various sinusoids using Fourier theory.
The chief obstacle in realising OH suppression with rugate filters has been the difficulty of manufacture. Deposition of each layer of the film requires very tight tolerances in the thickness of the layer, which must be uniform over the entire area of the substrate. These difficulties have so far made manufacture of satisfactory filters impracticable. A further problem is that even should the tolerances of each layer be met, thousands of layers are required which leads to a coating which is tens of microns thick. The stresses in each layer of so many coatings ultimately makes each layer unstable (Ennos 1966).
5.1.3 Holographic filters
Blais-Ouellette et al. (2004) suggest the use of volume phase holographic filters (Barden et al. 2000) as a method of OH suppression. These filters use holographic recording techniques to record a grating consisting of fringes of varying refractive index in a volume of transparent material, typically dichromated gelatin. If the fringes are arranged to be parallel to the surface of the filter, no dispersion occurs, and the grating acts as a notch filter. By controlling the fringe pattern, several notch filters may be multiplexed within a single filter. Blais-Ouellette et al. (2004) demonstrate a filter capable of suppressing 10 lines (or close doublets) at 10dB, with a notch width of 1Å and an interline throughput of 85 per cent.
These filters have the advantage as a viable method of OH suppression in that they are currently available for purchase from Photon Etc. However, there are some difficulties in their use in a practical situation. The wavelength response of the filter profile shifts as a function of off-axis angle, which restricts the use of the filters to slow beams. In order to use the filters in slow beams, the notch width must be made larger to accommodate the shifting filter profile, reducing their efficiency. Another issue is that a single filter is made up from several glass substrates which are cemented together such that the layers between each substrate aligns with the optical axis. To avoid scattering between the layers the boundaries must be blackened, which therefore divides the beam before it enters the VPH.
A comparison of VPH filters with FBGs strongly favours the latter. The relatively small number of lines per filter compared with FBGs, coupled with the lower interline throughput is disadvantageous. FBGs are able to suppress 150 lines across a 400nm window with a interline throughput of 88 per cent. The same 150 lines would require 15 of the filters demonstrated by Blais-Ouellette et al. (2004), or 5 of the 30 line filters advertised by Photon Etc. This would result in a throughput of 9–44 per cent.
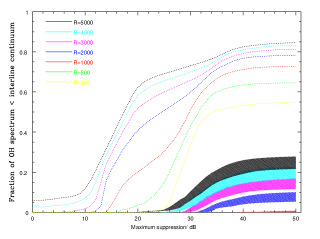
FBGs can suppress the OH lines at 30dB, whereas the VPH filters suppress filters at 10dB. This makes a significant difference in the performance of the two devices. In the next section we show how the suppression factor strongly influences the performance of FBGs (Figure 14). If the OH lines are not suppressed strongly enough, the residual lines will still dominate the background signal due to the scattering effects described above.
5.2 Fibre Bragg gratings
Bland-Hawthorn et al. (2004) present a radical new approach to OH suppression employing fibre Bragg gratings. Fibre Bragg gratings (FBGs) are optical fibres with a slowly varying refractive index in the core. As light propagates down the fibre it suffers Fresnel reflections due to the varying refractive index. By properly controlling the index variation it is possible to produce strong reflections at specific wavelengths. Bland-Hawthorn et al. (2004) showed it was possible to produce a low loss filter defined by a series of irregularly spaced, narrow notches with suppression depths as high as 30 dB, whist maintaining high throughput outside of the notches (losses per 100nm wavelength coverage). Their design corrects for 18 OH lines in the H band.
Two steps are required in order for this technology to be useful for astronomical observations: the ability to suppress many lines, and the ability to work with multi-mode fibres. These two requirements are not easily compatible. When one considers the huge complexity of suppressing up to 150 OH lines within the H band, the amplitude and phase structure of the grating demands that this is printed into a single-mode fibre so that the cycles are available to produce the filter response along one propagation axis (Bland-Hawthorn et al. 2008). In a multimode fibre, a much larger number of cycles is required to achieve the same grating response to each mode, thereby greatly increasing the complexity of the FBG. Thus FBGs achieve peak performance within a single-mode fibre (10 micron core), whereas astronomical fibres, with their larger core diameters, are highly multi-moded. Therefore a successful implementation of photonic OH suppression requires that the many modes of the input fibre be transformed into the same number of single modes acting in parallel.
To this end, we developed the photonic lantern (Leon-Saval et al. 2005, Bland-Hawthorn 2005) which decomposes the spatial modes of the input fibre into a parallel degenerate array of single-mode fibres. Identical gratings are printed into each of the fibres. Once the filtered light exits the fibre array, these are recombined by an identical taper back to a multimode output fibre. Horton & Bland-Hawthorn (2007) have demonstrated that fibres with as few as 5 modes can have high coupling efficiency, paving the way for AO fed FBGs in the near future.
The combination of these two innovative technologies means that the development of FBGs for astronomical purposes is now at a stage that is compatible with astronomical requirements. FBGs are now being developed to remove lines in each of the and bands. The brightest lines are suppressed at 30dB, and fainter lines are suppressed by an amount proportionally less. Photonic lanterns are being developed with 37 fibre tapers. The resulting multimode FBG will be a complex device, and expensive to manufacture, at least in the current incarnation. Initially, only tens to hundreds of fibres are envisaged, but ultimately, the technology will undergo further development to bring down the unit cost.
In light of the discussion in section 3, an important advantage of FBGs is that they can be incorporated into a spectrograph before the dispersive elements, thus the OH light is strongly rejected with very little scattering, offering for the first time the capability to achieve extremely deep NIR observations without the requirement to put a telescope and instrument into space.
The ultimate goal of OH suppression is to reach the interline continuum over a significant fraction of the and bands. The level of suppression required to achieve this depends on the spectral resolving power of the instrument. Figure 14 shows the fraction of the –m window in which the OH spectrum falls below the zodiacal scattered light as a function of suppression and spectral resolution. A maximum suppression of 40dB yields significant gains, and thereafter the improvements flatten off. This is true of both the high interline continuum of Maihara et al. (1993b) and the models.
5.3 Simulations
In order to assess the expected performance of FBGs we have thoroughly modelled an entire observing system from astronomical source to the detector, incorporating an instrument employing FBGs. Three different source types were chosen to illustrate the power of OH suppression with FBGs, a QSO, a galaxy and a faint T dwarf.
5.3.1 System model
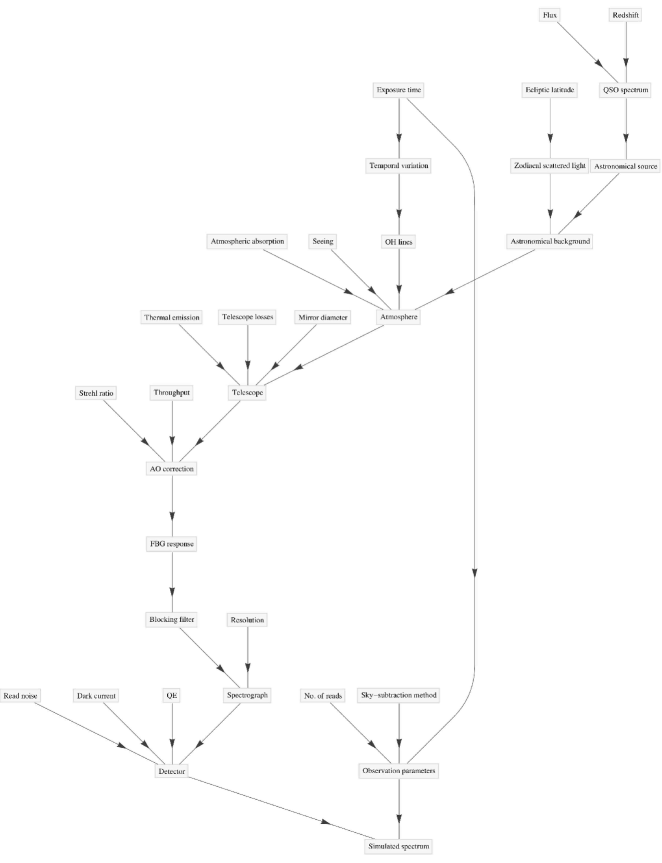
The simulations work by starting with a fluxed 1d object spectrum and modifying it according to background contributions and losses for each component of the system. A simplified schematic overview of a typical simulation is shown in Figure 15, showing the sources of emission and losses we have modelled. Many of the components shown are optional, for example, we can also model galaxy, and stellar spectra, amongst other sources. It should also be noted that most of the components shown are fully adjustable, e.g. OH line strengths, zodiacal scattered light etc. can all be adjusted according to meaningful parameters. The observation parameters and mode of observation are then applied to generate the final spectrum.
The details of the simulations were as follows. The zodiacal background is described above (§ 2.4), and we modelled observations at degrees. The OH line spectrum was used as described in section 2.1, including temporal variation. The atmospheric absorption is described in section 2.7. We assumed an 8m telescope with obstruction losses of 5 per cent was employed in Cassegrain focus with a reflectivity of 97 per cent off both mirror surfaces. We modelled the thermal emission from the telescope as a K blackbody with an emissivity of 3 per cent.
The FBGs are modelled as 150 line gratings of 1Å width. The fibres are taken to have a core size of 25m, i.e. few mode fibres, corresponding to an angular diameter of 0.2 arcseconds at f/5. The fibre coupling losses are for a few mode fibre of this size (Horton & Bland-Hawthorn 2007). These are fed with a generic AO system, achieving a Strehl ratio of 0.3, with a throughput of 0.9. The fibre aperture losses are thus, per cent, due to lost light, assuming that the PSF can be modelled as a diffraction limited PSF plus a Gaussian seeing disc with FWHM 0.5 arcsec, where the two components are normalised such that the diffraction limited part contains a power equal to the Strehl ratio.
The spectrograph is assumed to have a throughput of 35 per cent, and an adjustable resolution. The sampling is assumed to be 3 spatial by 3 spectral pixels. A systematic wavelength calibration error of a tenth of a pixel FWHM has been included. We assume a blocking filter is used at the entrance to the spectrograph and apply the corresponding transmission. The detector is taken to have an effective read noise of 4e- when up-the-ramp sampling is employed, and a dark current of two thousandths of an electron per pixel per second, typical of Rockwell Hawaii-2RG HgCdTe arrays (Smith et al. 2006). Observations are composed of 30 minute reads, with sky-subtraction performed by cross-beam switching between pairs of fibres.
5.3.2 General results
The system described above results in a reduction of the total background by a factor of of 42 and 17 in the and bands respectively, corresponding to 4 and 3 magnitudes. It is important to realise that this reduction applies across the entire spectrum including the interline regions. For example at m (where Maihara et al. 1993b measured the interline continuum) the background would be dominated by scattered OH light in the absence of FBGs. However, because FBGs suppress the OH lines before scattering, the interline background is also reduced by a factor of 40. We emphasise that it is the magnitude of the interline reduction that is scientifically important, and that the advantage of FBGs over other methods of OH suppression is their ability to suppress the OH light before the light enters the spectrograph, and therefore before any significant scattering surfaces are encountered. Methods to remove OH light after dispersion may achieve a good overall reduction in the overall background due to the removal of the cores of the bright emission lines (as could also be achieved through software suppression), but between the lines, where the science will be done, the reduction will not be as good due to the scattered light.
We compare the reduction in background resulting from OH suppression to that resulting from AO correction in Figure 16. Changing from a 0.5 arcsec aperture for natural seeing to a 0.2 arcsec aperture for AO correction results in a reduction of the background by a factor 6.25. Applying OH suppression then results in a further reduction of a factor of 42 in or 17 in as described above. Given that diffraction limited observations would severely over-sample a high redshift galaxy of size 1 arcsecond, we argue that the main advantage from AO for cosmology is the reduction in background light. Consequently we argue that OH suppression is at least as important for cosmology as AO, since it produces a greater level of background suppression. Of course both technologies must proceed together, but given the significant advances promised by OH suppression we argue that the development of FBGs should be given a very high priority for future instruments on existing telescopes and on the ELTs of the future.
5.3.3 QSO simulation
The typical surface brightness of sources responsible for reionisation is AB=27–29 mag arcsec2, achievable by a source of 26 AB mag per square arcminute if the number density is –10 arcmin-2 (Stiavelli et al. 2004). This source density is reasonable considering the number counts of Yan & Windhorst (2004) for galaxies, which have galaxies per square arcmin at AB=26 mag in approximately the same waveband. We have therefore assumed an unabsorbed magnitude of AB=26 mag, or Vega mag (using the conversion given by Tokunaga & Vacca 2005).
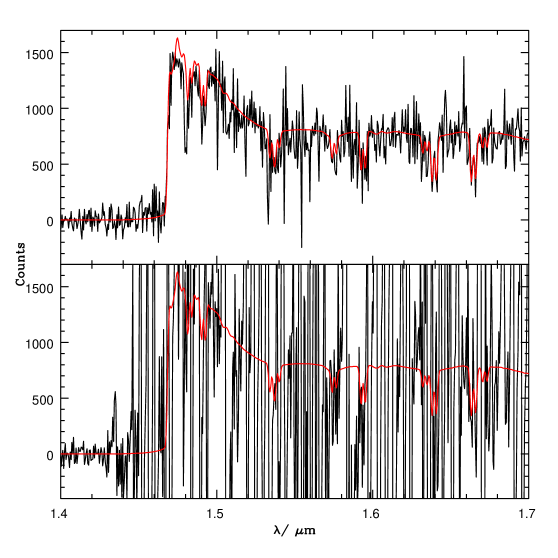
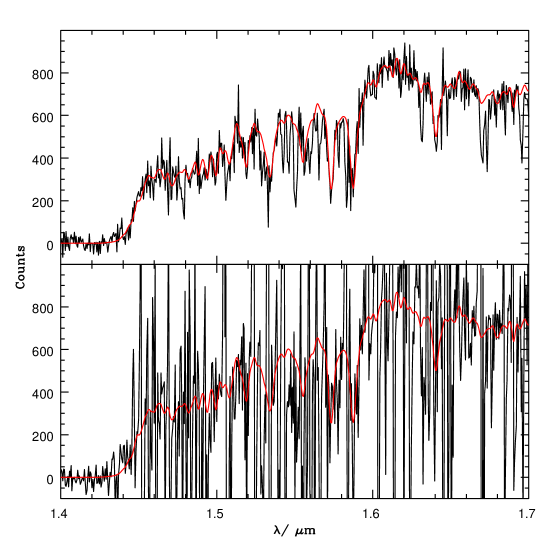
We used a simulated , mag spectrum (provided by Richard MacMahon, private communication), which includes Gunn & Peterson (1965) absorption and metal line absorption. We then redshifted this to (assuming no further absorption due to neutral hydrogen), and normalised the band flux to 24.6 mag. Figure 17 shows a simulation of a 70hr exposure at . The bottom panel shows the results of an identical system without FBGs, and is dominated by residual sky lines. The use of FBGs results in a remarkable improvement in the quality of the resulting spectrum. The Gunn & Peterson (1965) absorption trough is clearly visible when FBGs are used, whereas without FBGs the spectrum is completely dominated by noise and residual sky lines. FBGs offer the chance to accurately measure the redshifts of extremely faint objects during the epoch of reoinisation. This will be discussed further in the summary.
5.3.4 Redshift 3 galaxy simulation
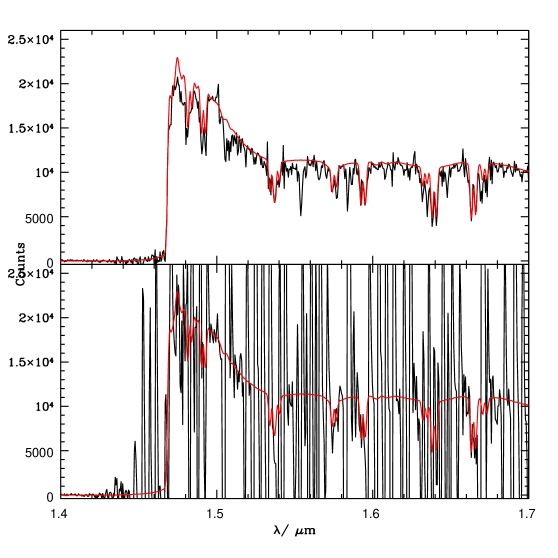
We have simulated an observation of an Vega mag galaxy at . The exposure time was 8hrs and the resolution was . The galaxy spectrum is from the synthetic spectral libraries of Bruzual & Charlot (2003), and assumes an instantaneous burst of star-formation, an age of 1Gyr and solar metallicity. Figure 18 shows the resulting spectrum as observed through a system with FBGs and a system without FBGs. The FBGs result in a high quality spectrum with Ca H and Ca K absorption lines clearly visible. Thus FBGs offer the chance to obtain precise measurements of galaxies when the Universe was only a fifth of its present age, allowing a detailed study of evolution over almost the entire history of galaxies.
5.3.5 T dwarf simulation
Cool stars emit most of their radiation in the NIR and are identified by molecular absorption features. The faintest T dwarf to date has a magnitude of Vega mag (Zapatero Osorio et al. 2002; see Adam Burgasser’s T dwarf page666http://web.mit.edu/ajb/www/tdwarf/), however most known T dwarfs have magnitudes around –16 Vega mag, and are located within a few tens of parsecs from the Sun.
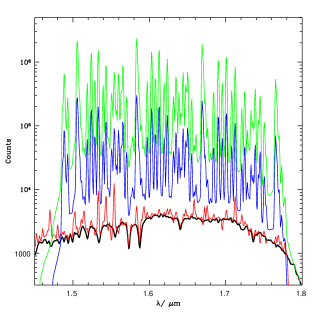
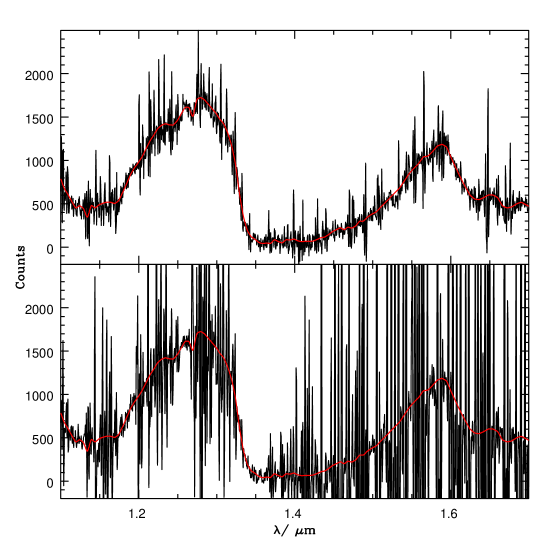
Figure 19 shows a simulated spectrum of a Vega mag T dwarf observed at , in J and H simulataneously, for 8hrs. The spectrum is that of a T5 dwarf, 2MASS0559-1404 (McLean et al. 2003777http://www.astro.ucla.edu/mclean/BDSSarchive/) scaled to . The FBG spectrum is of much superior quality to the spectrum employing ordinary fibres. FBGs offer the opportunity to identify much fainter cool stars than ever before.
5.4 Summary
We have demonstrated the possibility to achieve extremely deep near-infrared observations using fibre Bragg gratings. Hitherto, attempts to obtain deep NIR observations have been frustrated by the extremely bright and variable OH emission from the atmosphere. We have shown that in order to efficiently remove OH lines from astronomical spectra the OH lines must be suppressed prior to the light entering the camera. Scattering from dispersive optics results in Lorentzian line profiles, the wings of which are much brighter than the true interline continuum, and in most cases are brighter than the sources being observed. The variability of the OH lines makes it extremely difficult to subtract cleanly.
FBGs can suppress OH lines at high resolution, , high suppression (30dB) and with high throughput out of the suppression regions ( per cent). Suppressing 150 lines in the or band, with a maximum suppression of 30dB, decreases the sky background by a factor of , or 4 magnitudes. Achieving this will have the potential to extend NIR observation to objects orders of magnitude fainter than currently possible. The resulting observations will have a great impact on many areas of astronomy, and we highlight a few now.
5.4.1 First light and reionisation
FBGs offer the opportunity to study the rest-frame UV light from objects at the time of reionisation. Figure 17 shows a simulated spectrum of a QSO with a clearly visible Gunn & Peterson (1965) absorption trough. Spectroscopy with FBGs would therefore be ideally suited to identifying first light sources, performing follow-up spectroscopy from surveys of Lyman- emission (e.g. Taniguchi et al. 2005), continuum drop-out due to the Lyman-break (e.g. Stanway et al. 2004) and ultra-narrow band surveys (e.g. Horton et al. 2004). A spectrum of a complete Gunn-Peterson trough would confirm the redshift of the source, which would allow estimates of the luminosity function and number-magnitude relations of the first sources of light in the Universe. If the sources are bright enough, then it may be possible to also measure the line profile of Lyman- which is expected to be distinctively asymmetrical due to resonant scattering bluewards of the line-centre. The intrinsic width of the line itself will depend upon the type of source; quasars will have broad Lyman- lines, FWHMkm s-1, whereas galaxies will have narrower lines, FWHMkm s-1. The difference in line widths leads to the possibility of distinguishing the type of sources responsible for ionisination. For the purpose of confirming the presence of a redshifted Lyman- line it is necessary to resolve the lines sufficiently to measure the asymmetry, requiring resolutions of .
The combination of FBGs and ELTs will make it possible to thoroughly explore the ionisation history of the IGM using NIR spectroscopy of first light objects. The detection of complete Gunn-Peterson absorption troughs in the spectra of high redshift quasars (Becker et al. 2001) show that the IGM was partly neutral at . However, a neutral fraction of only is all it takes for complete absorption due to the high oscillator strength of the Lyman- transition. Thus to probe further back in time to uncover the details of the ionisation of the IGM, we must look to other means.
Oh (2002) suggest that metal absorption lines may provide a useful means of measuring the ionisation state of the IGM. Oi and Siii have ionisation potentials close to that of neutral hydrogen, and thus measuring the neutral fraction of either of these metals could be used to infer the neutral fraction of hydrogen. Furthermore there are useful lines just longer than Lyman- so a single measured spectrum may incorporate Lyman- 1215.67Å, Oi 1302.17Å and Siii 1260.42Å. These metals have previously been observed in the spectra of high redshift quasars (Pettini 2001) verifying their usability for this purpose. Since it is unlikely that metals will be smoothly distributed through the IGM, the signature will be in the form of a forest of lines rather than a Gunn-Peterson trough. A measurement of the equivalent width of the lines, or even simply the number of lines will provide precious information on the ionisation state.
The detection or non-detection of a radiation damping wing has the potential to divulge important information on the ionisation state of the IGM. If a radiation damping wing is found it will provide a very accurate measure of the neutral fraction of hydrogen (Miralda-Escude 1998). If the ionising sources reside in significant cosmic Strömgren spheres then a damping wing will be impossible to measure (Cen & Haiman 2000; Madau & Rees 2000). However, the line profile may still be identified as Lyman- due to its asymmetrical shape, and thus the lack of a damping wing can place constraints on the ionising fluxes of the sources. If the sources are galaxies then it may also place constraints on the clustering of the objects, since it is unlikely that a single primordial galaxy would produce a significant ionised region on its own. If spectra can be obtained with a sufficiently high signal-to-noise, then the tail of the damping wing may provide detailed information on the size of the Strömgren spheres.
Figure 20 shows the same simulation as described in section 5.3.3, except the telescope was assumed to have a diameter of 30m. Metal absorption lines are now visible in the spectrum.
5.4.2 Galaxy evolution
Deep NIR imaging and spectroscopy with FBGs will allow galaxy evolution to be studied over most of the history of the Universe. Figure 18 shows a Vega mag galaxy at . Absorption lines are clearly visible. It would thus be possible to measure galaxy masses, luminosities and star-formation rates from emission lines, and to derive the evolution of the star-formation history, the luminosity function, the Faber & Jackson (1976) relation and if high spatial resolution imaging is available, the fundamental plane.
5.4.3 Cool stars
NIR infrared observations are essential for identifying cool stars such as L, T and Y dwarfs. Measuring the number density of such objects as a function of mass is a critical test of our understanding of both star and planet formation processes. NIR spectroscopy is essential for fully characterising their temperature, surface gravity and atmospheric conditions. The use of FBGs would allow observations of objects orders of magnitude fainter than currently possible (see Figure 19), thus extending the survey volumes and numbers of such objects, and placing strong constraints on the low mass end of the initial mass function.
6 Realisation
The 8-10m telescope generation has been with us for more than a decade, and astronomy must now plan for a new generation of facilities if the field is to advance in the years to come. For ground-based observations, the Earth s atmosphere provides a major challenge to scientific progress on two fronts: (a) the movement of air cells blurs the cosmic signal; (b) hydroxyl emission from the upper atmosphere produces a perpetual twilight, thereby greatly increasing the background signal in astronomical observations. At near infrared wavelengths, there are clear indications that adaptive optics is overcoming the problem of seeing and is starting to deliver unprecedented resolution and sensitivity at near-infrared wavelengths (Liu 2006). In contrast, the extreme brightness of the infrared sky remains an unsolved problem.
The James Webb Space Telescope (Gardner et al. 2006) will be launched sometime in the next decade, bypassing altogether the problems associated with observing through the atmosphere. However, it will have a 6m aperture compared to apertures of 20–42m of the next generation of ground-based telescopes. The satellite will be inaccessible and will not be serviced by astronauts, thus the instrument suite will have restricted functionality compared to what is possible today on ground-based sites. For these reasons it is important to continue to address the issue of the infrared night sky background for ground-based telescopes.
The AAO has spearheaded the development of a new technology that promises to completely solve the infrared twilight problem, i.e. by removing 99 per cent of the OH line emission with an overall efficiency of 80 per cent or better. The concept exploits two recent advances in photonics: (i) broadband fibre Bragg gratings (FBGs); (ii) multimode to single-mode photonic lanterns. While the development remains challenging, there are indications that the development is on track to solve the OH suppression problem once and for all. We have demonstrated the extraordinary scientific potential of these fibres in this paper. Note that all simulations include correction by adaptive optics, for both cases, with and without FBGs. The observations we have presented and discussed would not be possible through use of adaptive optics alone. The improvements over the AO-only observations demonstrate a compelling need for FBGs, if such deep observations are to be achieved. The development and implementation of FBG fed instruments on existing 8m, and especially on future ELTs, deserves equal attention to that which has been invested in the development of adaptive optics.
In subsequent papers, we will discuss the relative merits of OH suppression in natural seeing compared to corrected seeing through adaptive optics, and describe instrument concepts that are under development to capitalize on the photonic OH suppression development.
Acknowledgments
We thank Adam Burgasser for providing the T dwarf spectrum, and Richard McMahon for the QSO spectrum, which were used in the simulations. We thank members of the instrument science group at the AAO for invaluable discussions. We thank the referee for useful comments which have improved this paper. This research was funded by the STFC grant PP/D002494/1 Revolutionary Technologies for Optical-IR Astronomy. JBH is supported by a Federation Fellowship from the Australian Research Council.
References
- Barden et al. (2000) Barden, S. C., Arns, J. A., Colburn, W. S., Williams, J. B. 2000, PASP, 112, 809
- Becker et al. (2001) Becker, R. H., et al. 2001, AJ, 122, 2850
- Blais-Ouellette et al. (2004) Blais-Ouellette, S., Artigau, É., Havermeyer, F., Matthews, K., Moser, C., Psaltis, D., Steckman, G. J. 2004, in Presented at the Society of Photo-Optical Instrumentation Engineers (SPIE) Conference, Vol. 5494, Optical Fabrication, Metrology, and Material Advancements for Telescopes, Edited by E. Atad-Ettedgui and P. Dierickx. Proceedings of the SPIE, Volume 5494, pp. 554-561 (2004)., ed. E. Atad-Ettedgui P. Dierickx, 554
- Bland-Hawthorn (2005) Bland-Hawthorn, J. 2005, Anglo-Australian Observatory Newsletter, 108, 4
- Bland-Hawthorn et al. (2008) Bland-Hawthorn, J., Buryak, Kolossovski. 2008, J.O.S.A., 25
- Bland-Hawthorn et al. (2004) Bland-Hawthorn, J., Englund, M., Edvell, G. 2004, Optics Express, 12, 5902
- Bruzual & Charlot (2003) Bruzual, G., Charlot, S. 2003, MNRAS, 344, 1000
- Burton et al. (2005) Burton, M. G., et al. 2005, Publications of the Astronomical Society of Australia, 22, 199
- Cen & Haiman (2000) Cen, R., Haiman, Z. 2000, ApJ, 542, L75
- Committee On The Physics Of The Universe et al. (2003) Committee On The Physics Of The Universe, B. O. P., Astronomy, D. O. E., Physical Sciences, N. R. C. O. T. N. A. 2003, Connecting quarks with the cosmos : eleven science questions for the new century (Connecting quarks with the cosmos : eleven science questions for the new century / Committee on the Physics of the Universe, Board on Physics and Astronomy, Division on Engineering and Physical Sciences, National Research Council of the National Academies. Washington, D.C. : National Academies Press, c2003.)
- Content (1996) Content, R. 1996, ApJ, 464, 412
- Cox (2000) Cox, A. N. 2000, Allen’s astrophysical quantities (Allen’s astrophysical quantities, 4th ed. Publisher: New York: AIP Press; Springer, 2000. Editedy by Arthur N. Cox. ISBN: 0387987460)
- Cuby et al. (2000) Cuby, J., Lidman, C., Moutou, C. 2000, ESO Messenger, 101, 2
- Davies (2007) Davies, R. I. 2007, MNRAS, 375, 1099
- Dufay (1951) Dufay, M. 1951, Publications of the Observatoire Haute-Provence, 2
- Ennos (1966) Ennos, A. E. 1966, Applied Optics, 5, 51
- Faber & Jackson (1976) Faber, S. M., Jackson, R. 1976, ApJ, 204, 668
- Frey et al. (2000) Frey, H. U., Mende, S. B., Arens, J. F., McCullough, P. R., Swenson, G. R. 2000, Geophysical Research Letters, 27, 41
- Gardner et al. (2006) Gardner, J. P., et al. 2006, Space Science Reviews, 123, 485
- Gunn & Peterson (1965) Gunn, J. E., Peterson, B. A. 1965, ApJ, 142, 1633
- Herzberg (1939) Herzberg, G. 1939, Molecular Spectra and Molecular Structure. I. Diatomic Molecules (Prentice-Hall Inc., New York)
- Horton & Bland-Hawthorn (2007) Horton, A., Bland-Hawthorn, J. 2007, Optics Express, 15, 1443
- Horton et al. (2004) Horton, A., Parry, I., Bland-Hawthorn, J., Cianci, S., King, D., McMahon, R., Medlen, S. 2004, in Ground-based Instrumentation for Astronomy. Edited by Alan F. M. Moorwood and Iye Masanori. Proceedings of the SPIE, Volume 5492, pp. 1022-1032 (2004)., ed. A. F. M. Moorwood M. Iye, 1022
- Iwamuro et al. (1994) Iwamuro, F., Maihara, T., Oya, S., Tsukamoto, H., Hall, D. N. B., Cowie, L. L., Tokunaga, A. T., Pickles, A. J. 1994, PASJ, 46, 515
- Iwamuro et al. (2001) Iwamuro, F., Motohara, K., Maihara, T., Hata, R., Harashima, T. 2001, PASJ, 53, 355
- Kelsall et al. (1998) Kelsall, T., et al. 1998, ApJ, 508, 44
- Krisciunas & Schaefer (1991) Krisciunas, K., Schaefer, B. E. 1991, PASP, 103, 1033
- Leon-Saval et al. (2005) Leon-Saval, S., Birks, T., Bland-Hawthorn, J., Englund, M. 2005, Optics Letters, 30, 19
- Levasseur-Regourd & Dumont (1980) Levasseur-Regourd, A. C., Dumont, R. 1980, A&A, 84, 277
- Liu (2006) Liu, M. C. 2006, in Presented at the Society of Photo-Optical Instrumentation Engineers (SPIE) Conference, Vol. 6272, Advances in Adaptive Optics II. Edited by Ellerbroek, Brent L.; Bonaccini Calia, Domenico. Proceedings of the SPIE, Volume 6272, pp. 62720H (2006).
- Lord (1992) Lord, S. D. 1992, NASA Technical Memor., 103957
- Madau & Rees (2000) Madau, P., Rees, M. J. 2000, ApJ, 542, L69
- Maihara & Iwamuro (2000) Maihara, T., Iwamuro, F. 2000, in Astronomical Society of the Pacific Conference Series, Vol. 195, Imaging the Universe in Three Dimensions, ed. W. van Breugel J. Bland-Hawthorn, 585
- Maihara et al. (1993a) Maihara, T., Iwamuro, F., Hall, D. N., Cowie, L. L., Tokunaga, A. T., Pickles, A. J. 1993a, in Presented at the Society of Photo-Optical Instrumentation Engineers (SPIE) Conference, Vol. 1946, Proc. SPIE Vol. 1946, p. 581-586, Infrared Detectors and Instrumentation, Albert M. Fowler; Ed., ed. A. M. Fowler, 581
- Maihara et al. (1993b) Maihara, T., Iwamuro, F., Yamashita, T., Hall, D. N. B., Cowie, L. L., Tokunaga, A. T., Pickles, A. 1993b, PASP, 105, 940
- Maihara et al. (2000) Maihara, T., et al. 2000, in Presented at the Society of Photo-Optical Instrumentation Engineers (SPIE) Conference, Vol. 4008, Proc. SPIE Vol. 4008, p. 1111-1118, Optical and IR Telescope Instrumentation and Detectors, Masanori Iye; Alan F. Moorwood; Eds., ed. M. Iye A. F. Moorwood, 1111
- Matsumoto et al. (1996) Matsumoto, T., Kawada, M., Murakami, H., Noda, M., Matsuura, S., Tanaka, M., Narita, K. 1996, PASJ, 48, L47
- McLean et al. (2003) McLean, I. S., McGovern, M. R., Burgasser, A. J., Kirkpatrick, J. D., Prato, L., Kim, S. S. 2003, ApJ, 596, 561
- Meinel (1950) Meinel, I. A. B. 1950, ApJ, 111, 555
- Miralda-Escude (1998) Miralda-Escude, J. 1998, ApJ, 501, 15
- Motohara et al. (2002) Motohara, K., et al. 2002, PASJ, 54, 315
- Noda et al. (1992) Noda, M., Christov, V. V., Matsuhara, H., Matsumoto, T., Matsuura, S., Noguchi, K., Sato, S., Murakami, H. 1992, ApJ, 391, 456
- NRC (2001) NRC. 2001, Astronomy and Astrophysics in the New Millennium (Astronomy and Astrophysics in the New Millennium, Astronomy and Astrophysics Survey Committee, Board on Physics and Astronomy-Space Studies Board, Division on Engineering and Physical Sciences, National Research Council. Washington DC: National Academy Press, 2001.)
- Offer & Bland-Hawthorn (1998) Offer, A. R., Bland-Hawthorn, J. 1998, MNRAS, 299, 176
- Oh (2002) Oh, S. 2002, MNRAS, 336, 1021
- Osterbrock et al. (1996) Osterbrock, D. E., Fulbright, J. P., Martel, A. R., Keane, M. J., Trager, S. C., Basri, G. 1996, PASP, 108, 277
- Pettini (2001) Pettini, M. 2001, in ESA SP-460: The Promise of the Herschel Space Observatory, ed. G. L. Pilbratt, J. Cernicharo, A. M. Heras, T. Prusti, R. Harris, 113
- Ramsay et al. (1992) Ramsay, S. K., Mountain, C. M., Geballe, T. R. 1992, MNRAS, 259, 751
- Rousselot et al. (2000) Rousselot, P., Lidman, C., Cuby, J.-G., Moreels, G., Monnet, G. 2000, A&A, 354, 1134
- Shimazaki & Laird (1970) Shimazaki, T., Laird, A. 1970, Journal of Geophysical Research, 75, 3221
- Smith et al. (2006) Smith, R., et al. 2006, in Presented at the Society of Photo-Optical Instrumentation Engineers (SPIE) Conference, Vol. 6276, High Energy, Optical, and Infrared Detectors for Astronomy II. Edited by Dorn, David A.; Holland, Andrew D.. Proceedings of the SPIE, Volume 6276, pp. 62760R (2006).
- Stanway et al. (2004) Stanway, E. R., Bunker, A. J., McMahon, R. G., Ellis, R. S., Treu, T., McCarthy, P. J. 2004, ApJ, 607, 704
- Stiavelli et al. (2004) Stiavelli, M., Fall, S. M., Panagia, N. 2004, ApJ, 600, 508
- Stockman et al. (1998) Stockman, H. S., Stiavelli, M., Im, M., Mather, J. C. 1998, in ASP Conf. Ser. 133: Science With The NGST, ed. E. P. Smith A. Koratkar, 24
- Taniguchi et al. (2005) Taniguchi, Y., et al. 2005, PASJ, 57, 165
- Thompson et al. (2007) Thompson, R. I., Eisenstein, D., Fan, X., Rieke, M., Kennicutt, R. C. 2007, ApJ, 657, 669
- Tokunaga & Vacca (2005) Tokunaga, A. T., Vacca, W. D. 2005, PASP, 117, 421
- Turnbull & Lowe (1983) Turnbull, D. N., Lowe, R. P. 1983, Canadian Journal of Physics, 61, 244
- Woods et al. (1994) Woods, T. N., Wrigley III, R. T., Rottman, G. J., Haring, R. E. 1994, Applied Optics, 33, 4273
- Yan & Windhorst (2004) Yan, H., Windhorst, R. A. 2004, ApJ, 612, L93
- Zapatero Osorio et al. (2002) Zapatero Osorio, M. R., Béjar, V. J. S., Martín, E. L., Rebolo, R., Barrado y Navascués, D., Mundt, R., Eislöffel, J., Caballero, J. A. 2002, ApJ, 578, 536