Low-Level Nuclear Activity in Nearby Spiral Galaxies
Abstract
We are conducting a search for supermassive black holes (SMBHs) with masses below by looking for signs of extremely low-level nuclear activity in nearby galaxies that are not known to be AGNs. Our survey has the following characteristics: (a) X-ray selection using the Chandra X-ray Observatory, since x-rays are a ubiquitous feature of AGNs; (b) Emphasis on late-type spiral and dwarf galaxies, as the galaxies most likely to have low-mass SMBHs; (c) Use of multiwavelength data to verify the source is an AGN; and (d) Use of the highest angular resolution available for observations in x-rays and other bands, to separate nuclear from off-nuclear sources and to minimize contamination by host galaxy light. Here we show the feasibility of this technique to find AGNs by applying it to six nearby, face-on spiral galaxies (NGC 3169, NGC 3184, NGC 4102, NGC 4647, NGC 4713, NGC 5457) for which data already exist in the Chandra archive. All six show nuclear x-ray sources. The data as they exist at present are ambiguous regarding the nature of the nuclear x-ray sources in NGC 4713 and NGC 4647. We conclude, in accord with previous studies, that NGC 3169 and NGC 4102 are almost certainly AGNs. Most interestingly, a strong argument can be made that NGC 3184 and NGC 5457, both of type Scd, host AGNs.
1 Introduction
The past decade has seen extraordinary improvement in our understanding of supermassive black holes (SMBHs) — their growth and evolution, and their links with their host galaxies. We now realize that galaxies hosting SMBHs at their centers are the rule rather than the exception. The observed correlations of the masses of the SMBHs with properties of their host galaxies, for example with the bulge stellar velocity dispersion (Ferrarese & Merritt 2000; Gebhardt et al. 2000), show that there is a close link between the formation and evolution of galaxies and of the SMBHs they host. Furthermore, a comparison of the SMBH mass function required to explain the observed luminosity function of active galactic nuclei (AGNs) with estimates of the local SMBH mass function (e.g. Marconi et al. 2004; Shankar et al. 2004) shows that not only must SMBHs be very common in massive galaxies but that most, if not all, of these black holes are relics of AGNs active in previous epochs. Thus knowledge of the local SMBH mass function enables us to put constraints on theories of galaxy and SMBH formation and growth, and AGN lifetimes.
Estimates of the local SMBH mass function are anchored by resolved stellar or gas dynamical measurements of the masses of SMBHs (see, e.g., the review by Ferrarese & Ford 2005), and otherwise based on the distribution of host galaxy properties (luminosity of the bulge or bulge stellar velocity dispersion ) and known scaling relationships between the mass of the SMBH and these properties (most prominently and ; but see Greene & Ho 2007a for a more direct estimate ). Most of the measured SMBH masses are or greater, however, as the sphere of influence of a less massive SMBH is extremely hard to resolve even at moderate distances, even with HST. For example, the sphere of influence of a SMBH at 15 Mpc is milliarcseconds (mas). As a result, while different estimates of the mass function agree for , the low-mass end () often has discrepancies (see, e.g., Fig. 7 of Graham et al. 2007 for a comparison of different authors’ estimates of the mass function). A second source of uncertainty at the low-mass end is the fact that it is unknown how the scaling relationships extrapolate to very late-type spiral galaxies, which have little or no bulge component, and to very low mass galaxies (dE and dSph). Yet SMBHs do exist in very late-type spirals, e.g. NGC 4395, a spiral galaxy of type Sdm, with (Peterson et al. 2005), and in very low mass galaxies, e.g. POX 52, a dwarf galaxy, with (Barth et al. 2004). Questions that naturally arise at this point are: Do the scaling relationships break down at low masses? What determines the mass of an SMBH: the mass of the bulge or the mass of the dark matter halo? Is there a lower bound to the local SMBH mass function? A well defined sample of low-mass SMBHs is needed to answer these questions.
Since we cannot detect low-mass SMBHs by their dynamical signature, looking for them by signs of their accretion activity may be the only viable way of detecting them. This of course limits detection to the subset of low-mass black holes that are active, but this fraction can be expected to be large, for the following reason. We now understand that the “quasar era” is a function of luminosity, with the space density of the most luminous quasars peaking at high redshift and that of lower luminosity quasars peaking at progressively lower redshifts (Fiore et al. 2003; Hasinger et al. 2005). This is often referred to as the “downsizing” of AGN activity with cosmic epoch. Moreover, at least some models of black hole growth (Marconi et al. 2004; Merloni 2004) require anti-hierarchical growth. That is, higher mass SMBHs attain most of their mass at high redshift while lower mass SMBHs grow at progressively lower redshifts. The trends of AGN downsizing and anti-hierarchical growth, extended logically to the smallest mass SMBHs, imply that these objects were active in recent times and may still be accreting at the present epoch.
The Eddington luminosity of a SMBH is only erg s-1; low-mass SMBHs, even if accreting at high rates, will be low-luminosity AGNs (LLAGNs). The converse is not true; that is, not all LLAGNs have a low-mass SMBH. In addition to a low SMBH mass, the low luminosity of an LLAGN may be caused by a low rate or radiatively inefficient mode of accretion to an SMBH of any mass (Soria et al. 2006a, b present a study of massive SMBHs accreting at very low rates). Finally, obscuration may further lower the observed luminosity. Low-ionization nuclear emission-line region (LINER) nuclei have been studied at multiple wavelengths (e.g. Eracleous et al. 2002; Satyapal et al. 2004; Dudik et al. 2005; Flohic et al. 2006) to identify LLAGNs among them, and these studies have demonstrated that these AGNs are not necessarily the same type of object with the same physical characteristics. Since we are interested specifically in the low-mass end of the SMBH mass function, it is necessary to identify among the AGNs those that can be expected to have the smallest black holes. One approach is to use mass estimators based on the luminosity of the AGN and the width of the broad component of emission lines in its spectrum. This is the technique that was used by Greene & Ho (2007b) in constructing their sample of low-mass SMBHs. A second approach, and the one we use, is to look for AGN activity in galaxies (late-type spirals, dwarf galaxies) where the known host galaxy-SMBH scaling relationships predict the lowest-mass SMBHs would reside. This approach has been used by Satyapal et al. (2007, 2008) to find candidate low-mass SMBHs. However, the scaling relationships are only statistical and cannot be used to estimate the mass of a particular SMBH; thus the second approach requires an independent estimate of the SMBH mass.
A search for active low-mass SMBHs requires confirmation of the presence of an AGN in each candidate nucleus, and measurement of the mass of the SMBHs in the confirmed AGNs. The method used by Greene & Ho (2007b) has the virtue of effectively combining all of the above into a single step. However, as the luminosity of an AGN decreases, the optical spectrum of the galaxy nucleus becomes more and more dominated by host galaxy light, and the signature of the AGN becomes difficult to detect. Even when the optical spectrum shows no clear evidence of an AGN, however, such evidence may still be present in other wavelengths, such as x-ray and radio (e.g. Filho et al. 2004), and infrared (e.g. Dale et al. 2006; Satyapal et al. 2007, 2008) (See Ho 2008 for a review of nuclear activity in nearby galaxies). For the lowest-luminosity AGNs, therefore, it is possible that a system based on optical spectra would not classify the nuclei as AGNs at all. We choose to use x-ray selection to identify candidate AGNs for the following reasons: First, x-rays can penetrate obscuring material which may be hiding the line emitting regions. Second, there are fewer sources of x-rays in a galaxy than there are of optical and UV emission and so dilution of the AGN signature by host galaxy light is less of a problem. Where the luminosity of the AGN is low to begin with, even a modest amount of absorption may result in the signal being below the optical background imposed by the galaxy. Third, even if, as expected in some theories (Eracleous et al. 1995; Nicastro 2000; Nicastro et al. 2003; Laor 2003) AGNs that have luminosities or accretion rates below a cut-off value do not have broad-line regions, they should still be detectable in x-rays. X-ray observations have in fact detected AGNs in what were thought to be “normal” galaxies (e.g. Martini et al. 2002). The disadvantage, as discussed in §4, is that x-ray observations by themselves cannot always distinguish between AGNs and other x-ray sources, such as x-ray binaries (XRBs) and ultraluminous x-ray sources (ULXs). Multi-wavelength data are needed to determine the type of source.
As the first step towards assembling a sample of low-mass SMBHs, we are conducting an x-ray survey of nearby (within 20 Mpc), quiescent spiral galaxies using the Chandra X-ray Observatory to look for nuclear x-ray sources, with an emphasis on late-type spirals. The high angular resolution of Chandra is necessary to ensure that any detected source is really at the center and is not an off-nuclear source. The survey is sensitive to an (unobscured) SMBH of mass radiating at out to the survey limit. We will present details of the survey sample selection and the Chandra observations in a future paper. Here, we present the methods used and the feasibility of detecting AGNs using these methods by applying them to six galaxies that meet selection criteria similar to those used for the survey sample, and for which x-ray data already exist in the Chandra archive.
2 Sample selection
Starting with Third Reference Catalogue of Bright Galaxies111In practice, we accessed the RC3 table in the SDSS database. (RC3; de Vaucouleurs et al. 1991), we imposed the following main filters. (1) Morphological type: we selected spiral galaxies of type Sa through Sd (); (2) Distance: galaxies that had recession velocity km s-1; (3) Galactic latitude: to avoid x-ray absorption by gas in our own Galaxy; (4) Inclination: we required , where and are the projected lengths of the semi-major and semi-minor axes, respectively. This was to avoid obscuration by the disk of the host galaxy; (5) Nuclear inactivity: the galaxy must not be known to be an AGN or starburst. Starbursts were excluded since the vigorous star formation also increases the likelihood of the presence of XRBs and ULXs. LINERs were included as there is still debate about whether the fundamental source of energy in these nuclei is an AGN or star formation. We also required that the object have the value of the “goodposition” flag set to 1 in the RC3 table in the Sloan Digital Sky Survey (SDSS) database, which indicated that the coordinates of the galaxy were accurate to 0.1 s in RA and in Dec. All objects passing these filters were cross-correlated with SDSS Data Release 3, with a match radius of . This resulted in a list of 76 galaxies. This list was then checked against publicly available data in the Chandra archive. The final sample consists of six galaxies: NGC 3169 (Sa), NGC 3184 (Scd), NGC 4102 (Sb), NGC 4647 (Sc), NGC 4713 (Sd), and NGC 5457 (Scd).
3 Data analysis
Details of the observations that were analyzed are given in Table 1. X-ray data were downloaded from the Chandra archive and analyzed using version 3.4 of Chandra Interactive Analysis of Observations (CIAO) software. In each case the Level 2 event list was processed using the observation-specific bad-pixel file and the latest calibration files, and filtered to exclude times when the instrument experienced a background flare. The event lists were then converted to FITS images and the CIAO wavelet source detection tool wavdetect was run on them to determine source positions. For each observation, source counts were extracted from a circle centered on the wavdetect source position, and with a radius equal to the greater of 4.67 pixels () and the 95% encircled-energy radius at 1.5 keV on ACIS-S at the position of the source. Background counts were taken from an annulus with an inner radius of twice, and an outer radius of five times, the source circle radius after excising any sources that happened to fall in the background region. Counts were extracted in the 0.3 – 8.0 keV (Broad), 2.5 – 8.0 keV (Hard) and 0.3 – 2.5 keV (Soft) bands. A hardness ratio (HR) was defined as , where and are the counts in the hard and soft bands, respectively. Spectral fits were performed with the CIAO tool Sherpa. Uncertainties reported in fit values represent the 90% confidence level for one parameter. In all estimations of the AGN Eddington ratio we have assumed that the bolometric luminosity is ten times the 2–10 keV luminosity of the AGN.
Where available, optical and UV data from HST (WFPC2) were downloaded from the archive and analyzed using IRAF to extract nuclear fluxes. We note here that we use “nuclear flux” to refer to the total background-subtracted flux at the location of the nucleus. We use this flux, and colors if observations in more than one band exist, only as a consistency check, not to obtain photometry of any putative AGN. At these extremely low luminosities (– erg s-1), the contribution of the AGN, even if present, will be a small fraction of the nuclear flux in the optical and UV bands. In most cases, therefore, we expect the fluxes and colors to be consistent with the absence of an AGN. We check for anomalous colors or fluxes, since these may indicate the presence of an additional source of flux, possibly an AGN. As such, we perform simple aperture photometry for resolved nuclear sources, with the aperture size matched to the source size. For point sources background-subtracted source counts were determined using imexam, using a 2-pixel radius aperture for the source, and an annulus with an inner radius of 7 pixels and an outer radius of 12 pixels for the background. These were corrected for CTE effects (Dolphin 2002) then extrapolated to a radius aperture using the encircled-energy tables of Holtzman et al. (1995). A correction of mag was added to represent the magnitude in an infinite aperture. Proprietary ACS data for NGC 4713 were made available by Martini et al. . The flux of the resolved nuclear source was estimated using aperture photometry on the drizzled image. We use infrared fluxes from the Two-Micron All Sky Survey (2MASS; Skrutskie et al. 2006) Point Source Catalog (PSC) for similar consistency checks.
Individual targets are discussed below. For each target, we first describe the observed properties in the x-ray, and then in other wavebands when such observations exist. We then consider whether the evidence supports the hypothesis that the x-ray source is an AGN.
3.1 NGC 3169
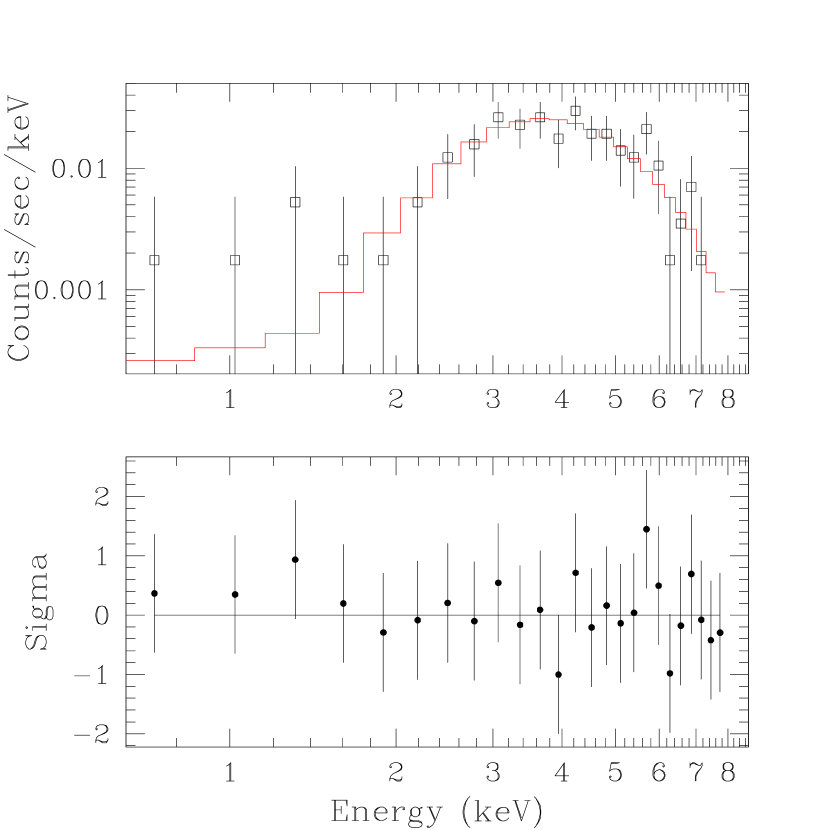
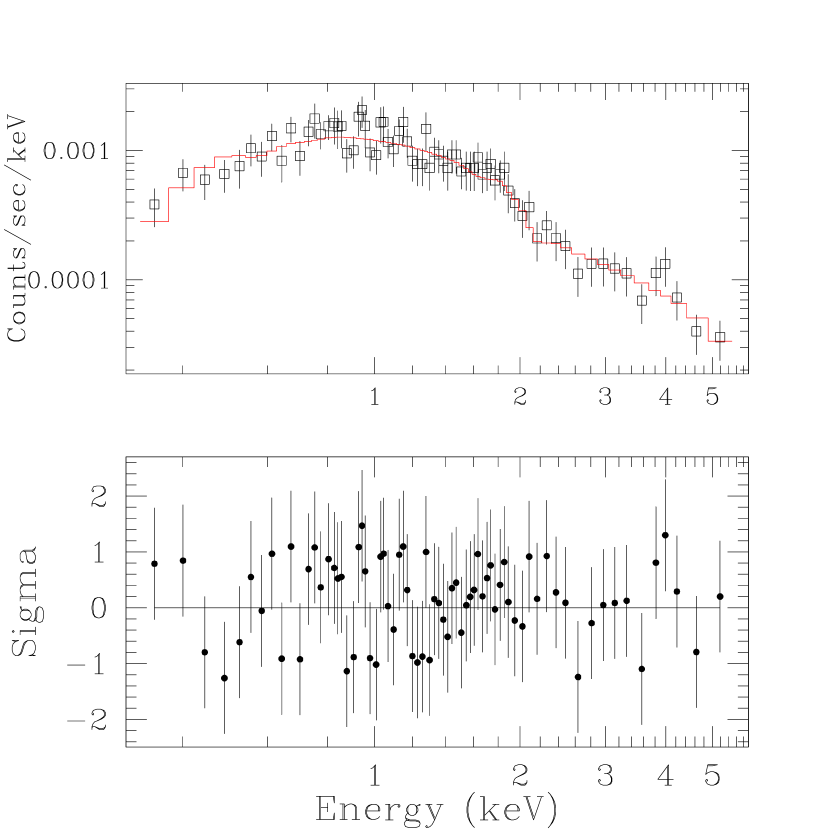
This is a galaxy of type Sa, at a distance of 19.7 Mpc (Tully 1988), and its nucleus is classified as a LINER (Ho et al. 1997a). The Chandra observation of the nucleus of NGC 3169 was analyzed by Terashima & Wilson (2003) and the nucleus identified as a low luminosity AGN, but the x-ray data are analyzed and presented here again for completeness. NGC 3169 was observed by Chandra for 2 ks and detected with 159 counts. Its hardness ratio makes it the hardest of the six sources discussed here and the only one to have a positive HR. Its spectrum, shown in Fig. 1, can be reasonably fit by an absorbed power-law, with cm-2 and . Spectral fit parameters are shown in Table 4, with the first row showing a fit using the Cash statistic and data binned to five counts per bin, and the second row a fit using the Gehrels statistic and data binned by 20 PHA channels. Best-fit parameter values from both fits are consistent within errors with each other and with the results obtained by Terashima & Wilson (2003). Fluxes used in the analysis are from the Cash fit. The unabsorbed broad band flux is erg cm-2 s-1, implying a luminosity erg s-1 for the assumed distance.
Observations with the Very Large Baseline Array (VLBA) show the nucleus is a mas-scale radio source at 5 GHz (Nagar et al. 2005). The nuclear flux density is erg cm-2 s-1 Hz-1, or erg s-1. The measured brightness temperature exceeds K and rules out starbursts and supernova remnants (Nagar et al. 2005).
The nucleus was detected by 2MASS. The observed magnitudes , , imply luminosities erg s-1 in these bands.
3.1.1 The nature of the nuclear emission
The combination of being a sub-parsec scale radio source as well as a luminous hard x-ray source points to the source being an AGN. Further evidence comes from the high luminosity. The source is obscured, as made clear from the x-ray spectrum. The infrared luminosity therefore is a better indication of the true bolometric luminosity. This luminosity, a few erg s-1, is higher than is expected from XRBs or nuclear star formation regions.
Dong & De Robertis (2006) perform a bulge-disk decomposition of NGC 3169 and use the 2MASS K-band luminosity of the galaxy to estimate a central black hole mass . Héraudeau & Simien (1998) report the central stellar velocity dispersion km s-1, which implies . Assuming for simplicity, the corresponding erg s-1. The inferred erg s-1 then implies .
3.2 NGC 3184
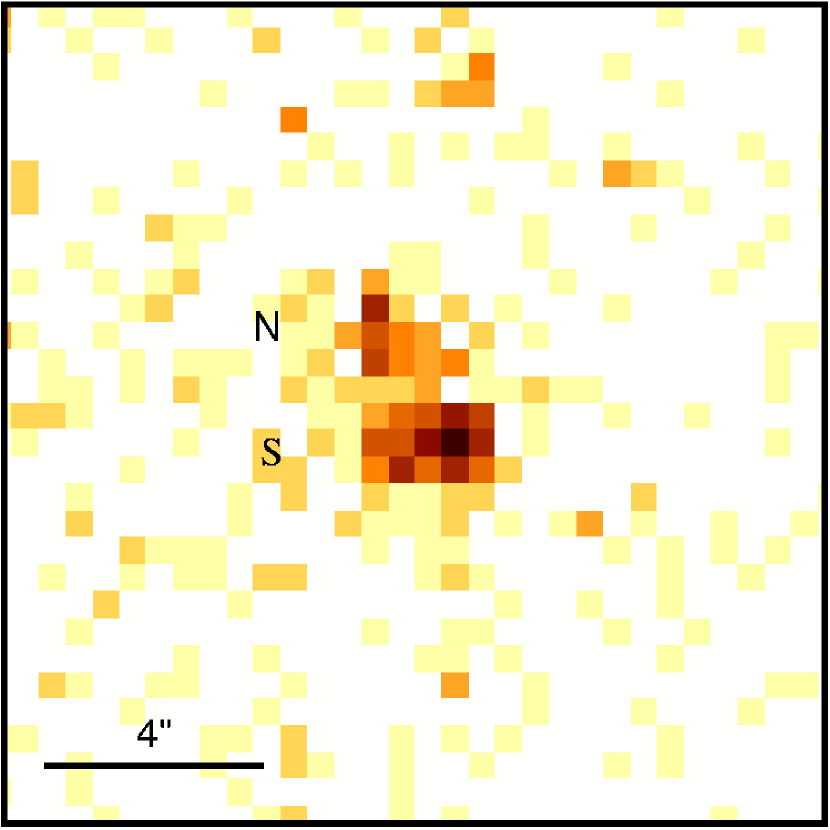
This is of type Scd, classified as having an H II nucleus by Ho et al. (1997a), and is at a distance of 8.7 Mpc (Tully 1988). It was observed with Chandra twice, one month apart, for 40 ks and 25 ks. Both observations used the ACIS-S3 chip. The nuclear x-ray emission appears to consist of two components (Fig. 2), a fainter, point-like source in the north and a brighter, more extended source in the south. The total extent of the nuclear emission is about ( pc). Both components are soft and have HR .
Since the northern component has only counts, detailed spectral fitting is not possible. We check for consistency of the data with different models using unbinned data. An absorbed power-law can be fitted to the data, and despite the degeneracy in the parameters, an intrinsic cm-2 is inconsistent at the 3- level. Fixing at the Galactic value gives a range of acceptable power-laws with (3- limits). An unabsorbed blackbody with temperature (3- limits) is also consistent with the data. The observed broadband luminosity of this component, corrected for Galactic absorption, corresponds to erg s-1. The difference in count rates between the two observations is not statistically significant, so this source does not vary on month timescales.
There are archival HST observations in the UV (WFPC2, F300W) and optical (WFPC2, F606W) of this galaxy. The F606W image has the nucleus on the WF4 chip, and clearly shows a central point source. The nucleus is on the PC chip in the F300W image. There is no central point source detected. Both images also show diffuse nuclear emission and a prominent spiral arm in the central . Other than the nuclear source in the F606W image, there are no obvious counterparts of the x-ray sources in either the UV or the optical. We note here that the coordinates in the HST images are misaligned with each other and with the x-ray image. The images were therefore aligned by cross-correlating point sources in each individual image with SDSS sources that are classified as stars. The aligned HST images match each other to within , and match the Chandra image to within . These offsets are comparable to the absolute astrometric accuracy of both Chandra and HST.
3.2.1 The nature of the nuclear emission
The fact that we see x-ray emission in the soft band but almost none in the hard band argues against the emission being the continuum from the AGN, whether direct or scattered. The source is not seen in the UV image. Both of these points suggest the presence of heavy obscuration. The observed x-rays could instead be soft emission from circumnuclear ionized gas, if the AGN is completely obscured and what is visible is mostly re-processed radiation. This is in fact the case in some heavily obscured Seyfert 2s (e.g. Bianchi et al. 2006; Levenson et al. 2006; Ghosh et al. 2007), where the dominant emission is the soft emission from the Narrow-Line Region. The Chandra and HST observations, therefore, are inconclusive regarding whether the source is an AGN, but do not rule out that possibility either.
A stronger argument that the source is an AGN derives from infra-red data. This galaxy is part of the Spitzer Infrared Nearby Galaxies Survey (SINGS; Kennicutt et al. 2003). Dale et al. (2006) have used the equivalent width of the PAH feature at and the fluxes in a mix of high- and low-ionization lines ([S IV] , [Ne II] , [Ne III] , [S III] , [O IV] , [S III] , [S II] ) to create diagnostic diagrams that distinguish between AGN and star-forming galaxies. This nucleus falls into the “transition” region between AGNs and H II regions. This suggests an AGN component to the emission exists that may have been diluted because of the large aperture used () to extract the fluxes. In IRAC images the nuclear source is resolved ( FWHM compared to the FWHM of the PSF). Nuclear fluxes were extracted using apertures in the IRAC channels (D. A. Dale, private communication). Host galaxy emission appears to dominate the MIPS (24, 70, and 160 ) fluxes, but the observed IRAC colors, and (magnitudes in system), are redder than more than 80% of normal late-type galaxies (Assef et al. 2008). This is expected if there is an AGN, as AGN power-law emission falls off more slowly than galactic emission in the NIR. Thus, the IR line ratios and IRAC colors strongly argue for the source to be an AGN.
The nucleus was also detected by 2MASS. The , , and magnitudes, from the 2MASS Point Source Catalog (2MASS PSC), are , , and , which correspond to erg s-1. Such a luminosity can be easily produced by an AGN. While all the observations are consistent with there being an AGN in NGC 3184, we cannot rule out a nuclear super-starcluster as the source. The x-ray emission could be from one or more XRBs in such a cluster. The x-ray luminosity ( erg s-1) is in the range seen from XRBs. The presence of a nuclear star formation region is indicated by the optical line ratios observed by Ho et al. (1997a). In addition, Larsen (2004) reports a candidate nuclear star cluster in NGC 3184.
In conclusion, there are two scenarios that are consistent with the observations. In both there is a nuclear star cluster that dominates the optical emission. In the first, there is no AGN and the x-rays are produced by one or more XRBs. In the second, there is a low-luminosity AGN in the center of the star cluster, so heavily obscured that we do not observe any direct or scattered emission. The x-ray emission arises from photoionized gas immediately surrounding the AGN. Using the luminosity derived using the Bremsstrahlung model above, and assuming that approximately 1% of the AGN luminosity is reprocessed into the plasma x-ray emission, the AGN has a luminosity erg s-1. The infrared line ratios and IRAC colors from Spitzer strongly argue for this scenario.
3.3 NGC 4102
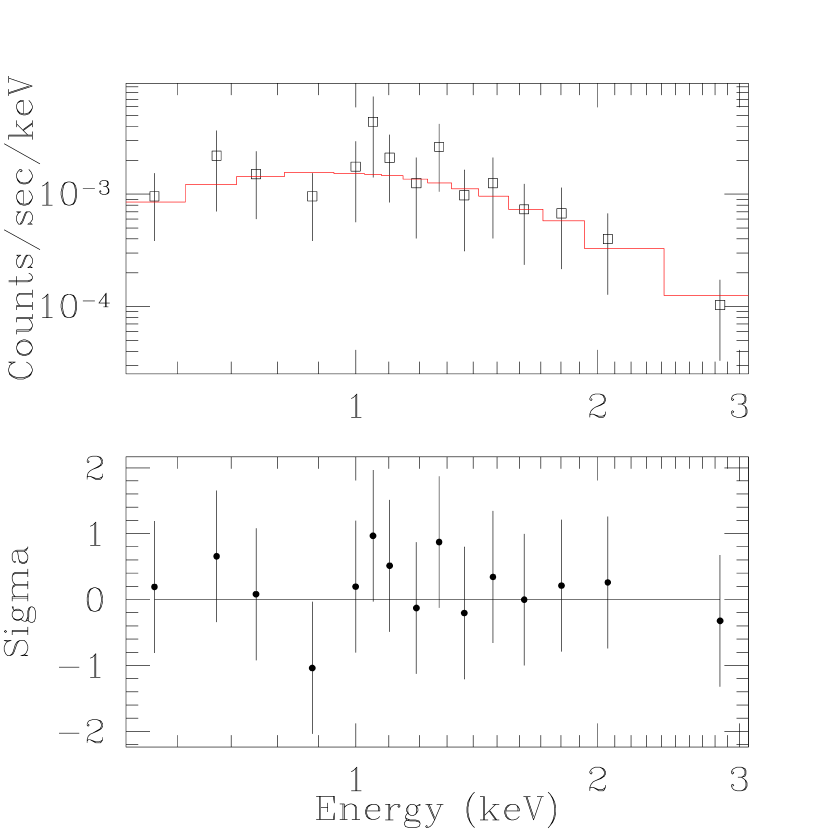
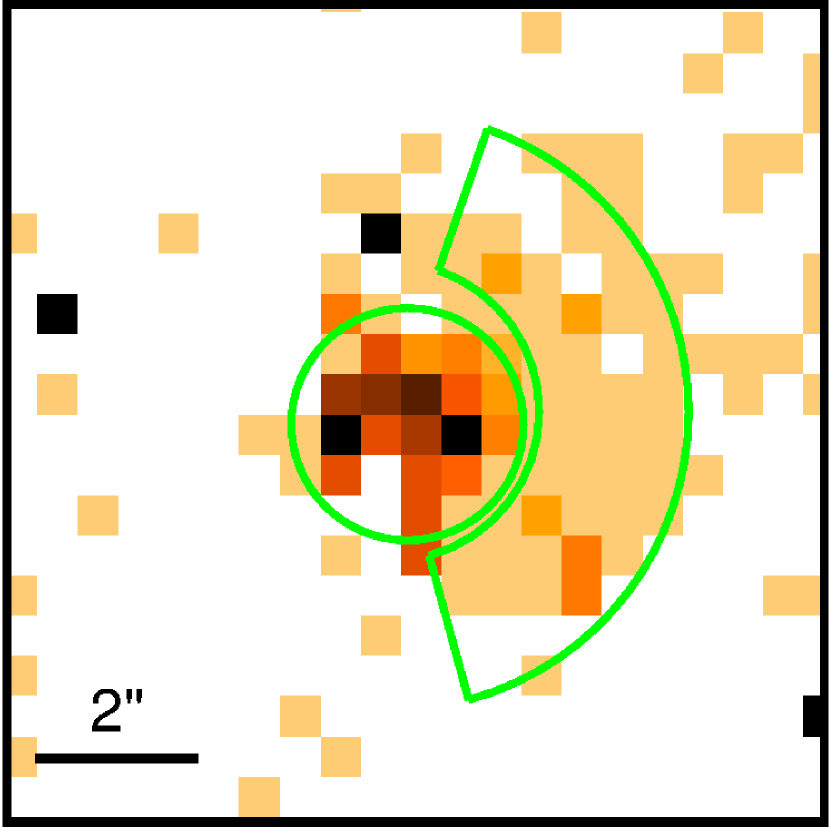
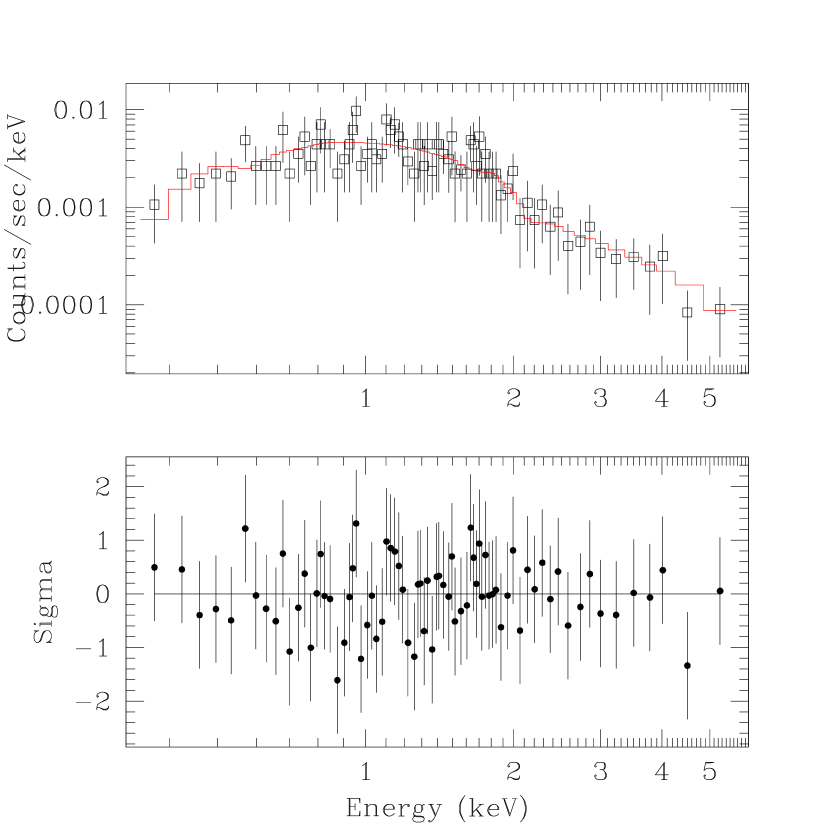
This is an Sb galaxy, classified as H II in Ho et al. (1997a) and as H II/LINER in the NASA/IPAC Extragalactic Database (NED), at a distance of 17 Mpc (Tully 1988). The Chandra observation of this galaxy was presented by Dudik et al. (2005) and also by Tzanavaris & Georgantopoulos (2007) . There are about 350 counts in the x-ray image of the nucleus. As a hardness ratio map (Fig. 3) shows, the hard and soft emission are well segregated into a fairly hard (HR ), point-like source with extended, very soft (HR ) emission to the west of it. Wavdetect, run on hard and soft band images, detects a small hard source and an encompassing soft source whose centers are apart. We therefore fit the spectra of the harder “core” and the softer extended emission separately, using counts from the regions shown in Fig. 3. The spectrum of the core has 171 counts, and shows a broad line between 6 and 7 keV, suggestive of reflection. The spectrum was fit after binning to 5 counts per bin, using the Cash statistic (cstat in Sherpa). A simple absorbed power-law model, fit to the energy range –3 keV, shows increasingly positive residuals at energies above 3 keV, again suggestive of a reflection component. The fit quality is poor, with a statistic value of 200 for 27 d-o-f. Using a reflection model (xspexrav) reduces the statistic to 60 for 26 d-o-f. The possible line at 6.4 keV is not well constrained because of the lack of counts on the high energy side of the line (there are 8 counts with keV). For the line, we added a Gaussian at the fixed position of 6.4 keV and of fixed FWHM keV, allowing only the amplitude to vary. This reduces the statistic further, to 40 for 25 d-o-f. The final parameters are and reflection scaling factor . The formal equivalent width (EW) of the line is keV, but the uncertainty in the amplitude of the line is of the order of and in the normalization of the reflected component, . The flux, excluding the line and corrected for Galactic absorption, is erg cm-2 s-1. A fit using the statistic (shown in Table 4) gives best-fit parameter values consistent with those from the Cash fit, with the exception of the equivalent width of the line, which is keV in this fit. Given the poor determination of the continuum near the line the difference is not significant. The equivalent width of the Fe K in type 1 AGNs is typically of the order of 300 eV, and a large EW implies that the direct continuum is suppressed and the source is reflection dominated. In NGC 4102 the formal EW is an order of magnitude larger; therefore even after accounting for the large uncertainty we can conclude that the true EW is greater than the typical type 1 value.
The extended emission is very soft, with just 5 counts (out of 115) above 2.5 keV. The spectrum was fit after binning to 5 counts per bin and using both the and Cash statistics. A bremsstrahlung model provides an acceptable fit ( and Cash statistic for 18 d-o-f), and the MEKAL model is less favored ( and Cash statistic for 18 d-o-f). Best-fit parameter values obtained using the two statistics are consistent within the errors. The best-fit temperature keV is higher than what may be expected of 100 pc-scale circumnuclear gas. The plasma surrounding an AGN may be photoionized rather than collisionally ionized, and there may be complexity in the spectrum that is hidden because of the poor quality. The flux in the extended emission is erg cm-2 s-1. Spectral models and best-fit parameter values for both the core and the extended emission are shown in Table 4. The fits for both the core and extended components are shown in Fig. 4.
HST imaging observations in visual and near-infrared (NIR) bands show that the nucleus is clumpy and has large amounts of dust, and that there is circumnuclear star formation (Carollo et al. 1997). High absorption and reddening towards the nucleus is also indicated by the Balmer decrement which gives (Ho et al. 1997a). The nucleus was detected by 2MASS. The 2MASS PSC gives , , and . For a distance of 17 Mpc, these correspond to erg s-1, erg s-1, and erg s-1. The nucleus is highly luminous in the far-infrared (FIR). Infrared Astronomical Satellite (IRAS) observations indicate erg s-1 (Mouri & Taniguchi 1992), where is the luminosity between and , albeit in the arcminute-scale IRAS apertures. The nucleus was also detected in radio by the FIRST survey (1.4 GHz). The stated radio position is within of the Chandra position, and therefore within Chandra astrometric accuracy. The radio beam size, however, was . The integrated radio flux density was 223 mJy, with peak flux density of 167 mJy. This is the same integrated 1.4 GHz flux density reported by Condon et al. (1982), fifteen years prior to the 1997 FIRST observation. Condon et al. (1982) also report a higher resolution 4.9 GHz observation. The 4.9 GHz map shows radio emission extended in the northeast-southwest direction with a total extent of about ( pc), and with two peaks separated by ( pc) and also aligned along a NE-SW axis. The position of the southwest peak coincides with the hard x-ray “core” seen in the Chandra observation. The radio spectral index () suggests a synchrotron rather than thermal origin for the radio emission.
3.3.1 The nature of the nuclear emission
We first consider the case where there is no AGN and all of the observed emission is due to star formation, and in particular consider the radio emitting region, which, as mentioned above, has a size of the order of 400 pc. If this region obeys the radio-FIR correlation for non-AGN galaxies (Condon 1992), then it has an FIR luminosity of erg s-1, exactly what was measured by IRAS. Therefore the radio and FIR observations are consistent with each other and with the star-formation-only hypothesis, requiring only the assumption that this region dominated the FIR emission within the IRAS aperture. Following Condon (1992), we use the radio emission to estimate a supernova rate and consequently a star formation rate (SFR). The luminosity density measured by FIRST, erg cm-2 s-1 Hz-1, implies yr-1, and yr-1. In the samples of Grimm et al. (2003) and Ranalli et al. (2003), the galaxies that have this star formation rate have x-ray luminosities ranging from a few erg s-1 to a few erg s-1. The observed nuclear x-ray luminosity of NGC 4102, erg s-1 is really a lower limit because the amount of absorption is undetermined, but for the purpose of the argument here may be considered to be consistent with the –SFR relationship of Ranalli et al. and Grimm et al. On the face of it, therefore, all of the observations are consistent with a starburst origin to the emission, but this explanation requires an extraordinarily intense starburst in a non-interacting galaxy. The radio, FIR, and x-ray luminosities require yr-1 of massive () star formation within a 400 pc region. For comparison, the massive star formation rate in the interacting starburst galaxy M 82 integrated over the whole galaxy is yr-1 (Neff & Ulvestad 2000), and the total SFR () in the merging pair NGC 4038/4039 is estimated to be between 5 and 10 yr-1 (Neff & Ulvestad 2000; Grimm et al. 2003).
In favor of the AGN hypothesis, NGC 4102 shows an approximately conical region of outflowing gas that has a higher [O III]/H ratio than the surrounding star forming regions (Ganda et al. 2006), suggesting exposure to a harder ionizing radiation than stellar continuum emission, and reminiscent of the ionization cones sometimes seen in Seyfert 2s (e.g. Pogge 1988). The [O III] line profile in this region is broader than in the surrounding regions and cannot be fit with a single Gaussian (Ganda et al. 2006). Gonçalves et al. (1999) reported a broad component (FWHM 560 km s-1) to the [O III] line as well. The broad component is weak, comprising just 5–7% of the flux in the line in the case of the H and H lines. Using this component gives [N II] 6583/H = 1.57, similar to LINERs and Seyferts, and thus Gonçalves et al. argue for the presence of a very weak Seyfert 2 in NGC 4102. In this respect NGC 4102 is similar to NGC 1042, where Shields et al. (2008) recently demonstrated the existence of a broad component in [N II], and that considering only the broad component moves the nucleus into the Seyfert/LINER regions in line-ratio diagnostic diagrams. Finally, the combination of a point-like hard source, soft extended circumnuclear emission, and an Fe K line with a large EW, is one often seen in type 2 AGNs.
There is undeniably strong star formation occurring in the nucleus of NGC 4102, and we cannot rule out the extremely large SFR implied if all of the observed emission is imputed to star formation alone. Nevertheless, the evidence is strong that there is an AGN in NGC 4102. We conclude that NGC 4102 is another example where an AGN and strong star formation co-exist at the nucleus.
3.4 NGC 4647
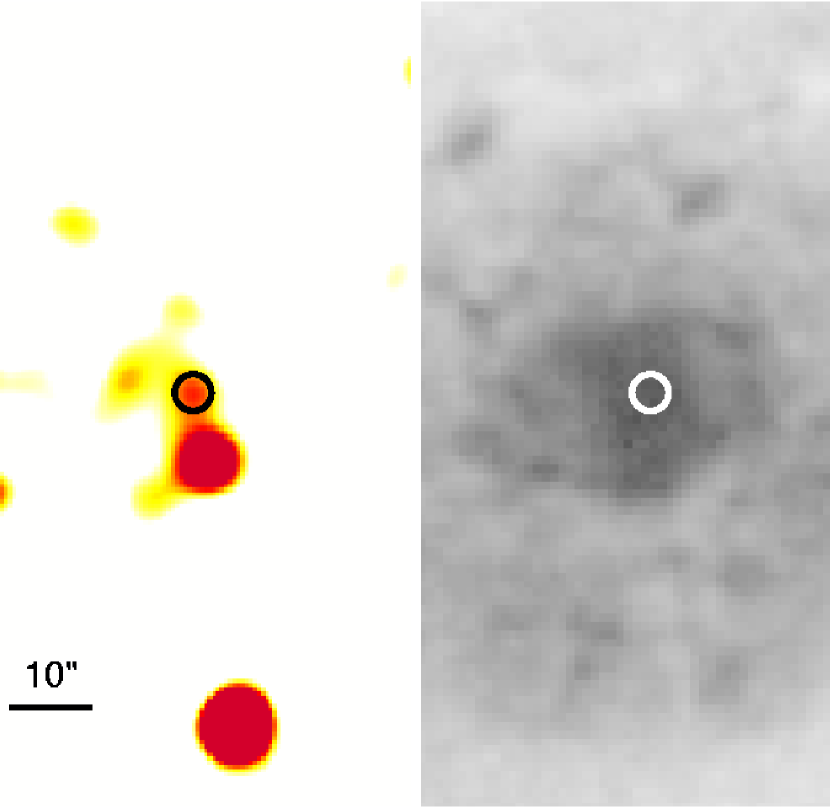
NGC 4647 is a galaxy of type Sc, its nucleus classified as H II in Ho et al. (1997a), at a distance of 16.8 Mpc (Tully 1988). The Chandra observation is of the elliptical galaxy NGC 4649, and NGC 4647 is on the chip, at an off-axis angle of . Two factors complicate the detection of the nucleus of NGC 4647. First, the nucleus lies within the extended emission from NGC 4649. Second, the nucleus falls on a node boundary of the CCD. Wavdetect at its default filter for source significance ( false source per pixels) does not detect the nucleus. However, once the elliptical galaxy is modeled and subtracted out of the image, there is a positive residual at the location of the nucleus of NGC 4647 (see Fig. 5). To extract source counts we used a circular region centered on the centroid of the residual and with radius , which is approximately the 95% encircled-energy radius at 1.5 keV at that position. To extract background counts we located another region on the same node boundary that was at the same distance from the center of NGC 4649 as was the source circle. The source region has counts after background subtraction, but this number necessarily has a large uncertainty. We take the radius of the source circle, , as the Chandra positional uncertainty of this source.
The nucleus may also have been detected in x-rays by XMM-Newton (Randall et al. 2006). While the source was detected with , the positional uncertainty was . The XMM-Newton source is soft, similar to the Chandra residual. The XMM-Newton and Chandra source positions differ by . There is a nuclear 2MASS point source () at a distance of from the Chandra position, but it is embedded in diffuse emission and the flux from the point source is poorly constrained. In the radio, there is a upper limit to the nuclear emission of mJy at 5 GHz (Ulvestad & Ho 2002). There is an older report of a radio detection of the nucleus with a flux density of 16 mJy at 1.4 GHz (Willis et al. 1976; Kotanyi 1980), but with positional uncertainty .
3.4.1 The nature of the nuclear emission
The data are inconclusive at this time as to whether there is an AGN in NGC 4647. The faintness of the source and the positional uncertainties in the existing observations prevent a firm identification and characterization of the source.
3.5 NGC 4713
This galaxy is of type Sd, at a distance of 17.9 Mpc (Tully 1988). Its nucleus was classified as T2 (transition object with type 2 spectrum) by Ho et al. (1997a). The nucleus is clearly detected by Chandra, but with only ten counts. It is a very soft source, with nine of the ten counts below keV. This object was also analyzed by Dudik et al. (2005), but since they were looking for hard-band sources, this object was not counted as a detection. The observed count rate corresponds to a flux of (5–10) erg cm-2 s-1 in the 0.3–8 keV band, or luminosity (3–5) erg s-1 for our assumed distance. The 2–10 keV flux depends strongly on the assumed model, from erg cm-2 s-1 for a thermal bremsstrahlung model with keV, to erg cm-2 s-1 for a power-law with and Galactic absorption.
NGC 4713 was observed by HST in December 2006 . The nucleus is resolved; thus only a nuclear star cluster or star forming region, and no AGN, is detected. The cluster is in diameter in the image, corresponding to a physical size of pc. Within this aperture the flux density is erg cm-2 s-1 Å-1, which implies erg s-1. The nucleus is also in the 2MASS PSC, with , , luminosities erg s-1. However, the nucleus is embedded in diffuse extended emission and therefore the reported magnitudes may not be accurate estimates of the nuclear emission. There is an upper limit of mJy to the nuclear radio emission at 15 GHz (Nagar et al. 2005), and a similar limit, 1.0 mJy, to the emission at 1.4 GHz from the FIRST survey.
3.5.1 The nature of the nuclear emission
As in the case of NGC 4647, the data are inconclusive regarding the presence of an AGN. The data are consistent with the AGN hypothesis: the “transition object” classification by Ho et al. (1997a) implies there may be an AGN component in the optical spectrum; the nucleus is without doubt an x-ray source, though it is not possible to distinguish between emission from circumnuclear gas and the nucleus proper in the current Chandra imaging. The hardness ratio (with large uncertainty) is consistent with a power-law. NGC 4713 may be similar to NGC 3184 in having a low-luminosity AGN inside a nuclear star cluster.
3.6 NGC 5457 (M 101)
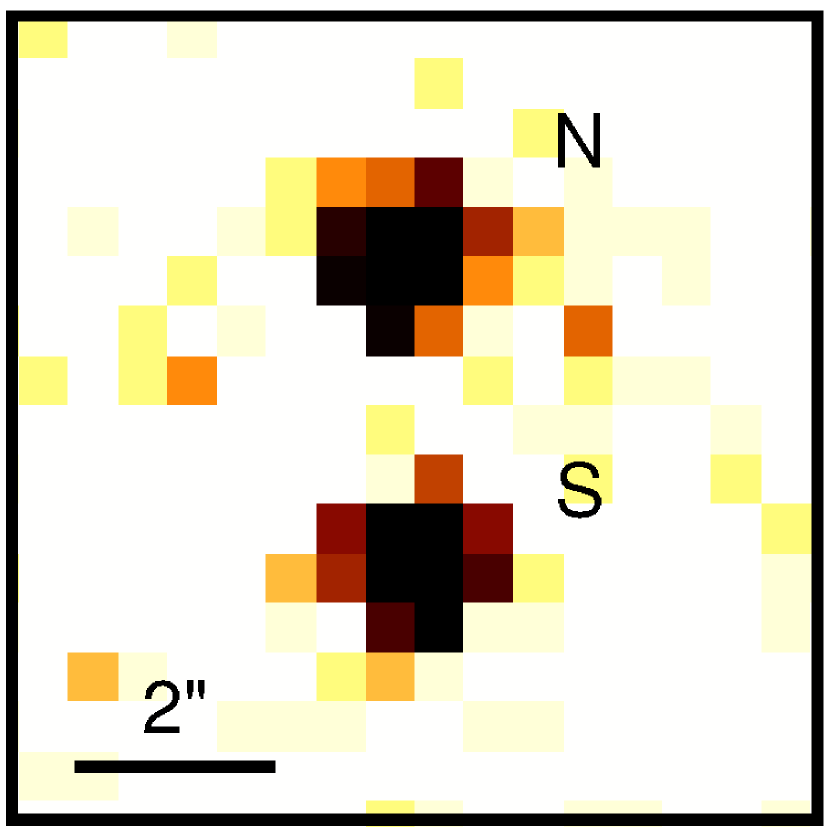
NGC 5457 is a galaxy of type Scd at a distance of approximately 7 Mpc (Freedman et al. 2001; Stetson et al. 1998). The nucleus was classified as H II by Ho et al. (1997a). It has been observed multiple times by Chandra for a total observation time of about 1.1 Ms. Our analysis omits the shorter, and hence low signal-to-noise, exposures. The observations included here are listed in Table 3. The total usable exposure time is 695 ks. Chandra clearly resolves two sources in the nuclear region (Fig. 6), which we label N and S. The northern source, N, is the nucleus, while the southern, S, is a star cluster (Pence et al. 2001). Table 3 shows the counts and hardness ratios of the two sources in each of the observations. Source N (the nucleus) varies in brightness by about a factor of 9 over the course of about 8 months (see Table 3 and Fig. 7). There is no significant change in hardness ratio. In our analysis and discussion below we consider only the nucleus (source N).
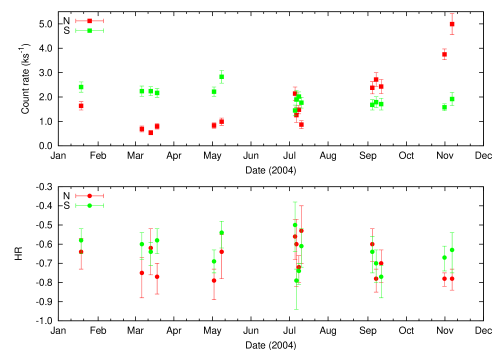
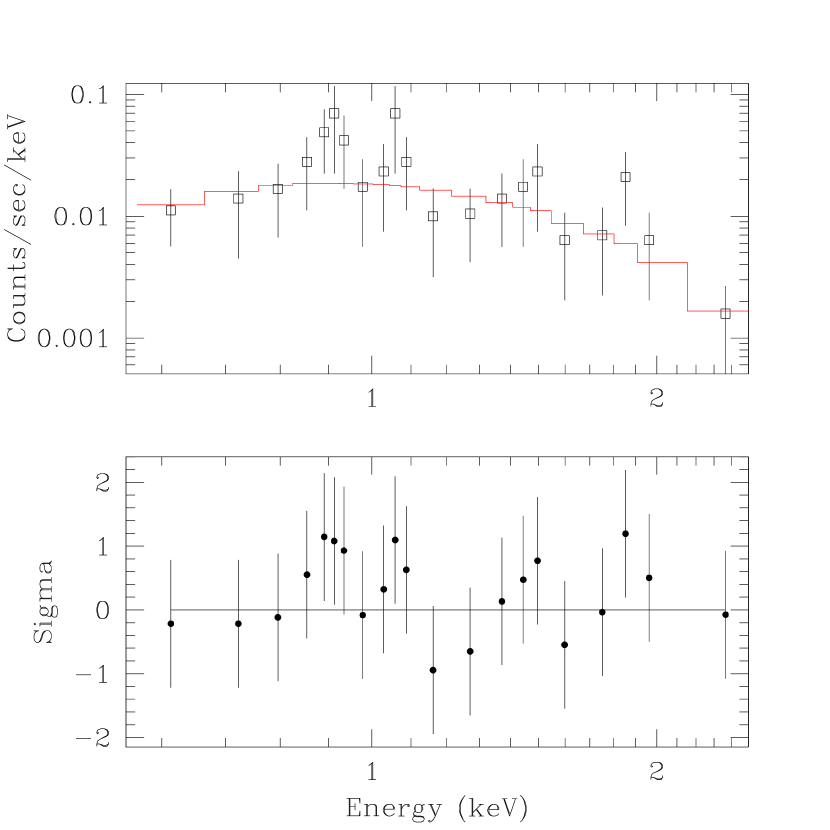
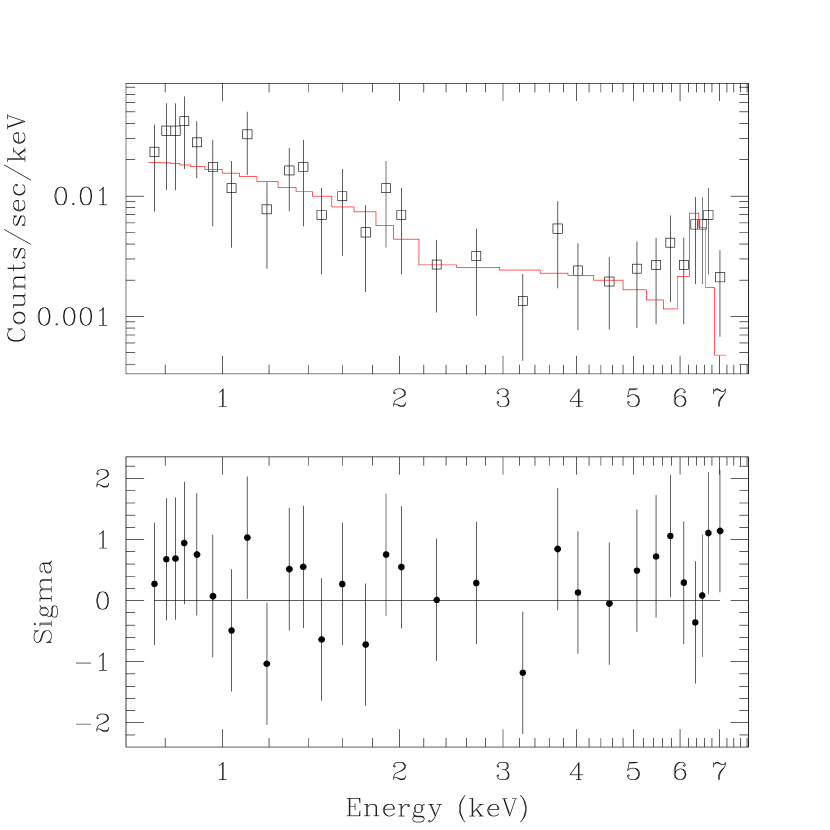
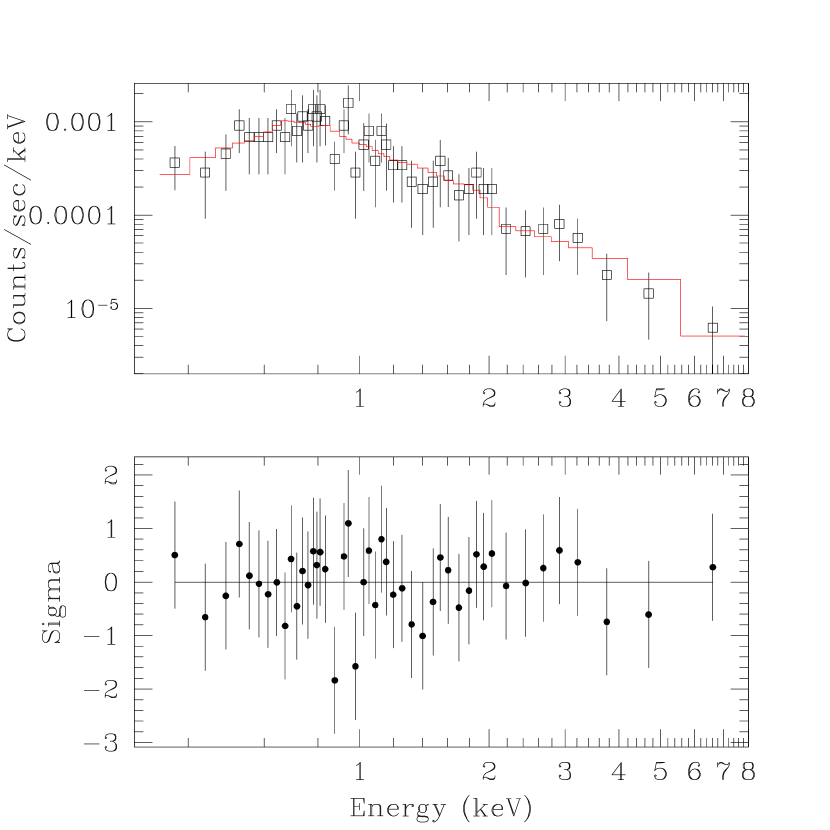
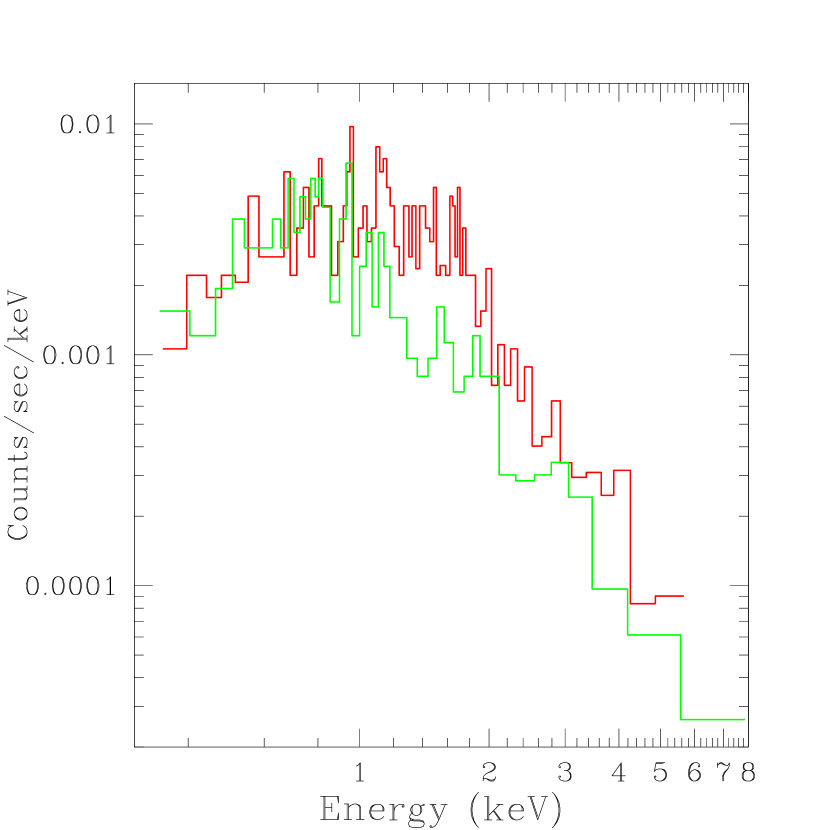
Three nuclear x-ray spectra were extracted: one (“merged”) from the event list obtained by merging all observations done in 2004, and fit using the instrument response from ObsID 5339; one (“high state”) from merging two observations where the source had a high count rate (ObsIDs 4736 and 6152) and fit using the response from ObsID 4736; and one (“low state”) from merging five observations where the count rate was low (ObsIDs 5300, 5309, 4732, 5322, 5323), fit using the response from ObsID 4732. The spectra are shown in Figs. 8 and 9; fit models and parameters are shown in Table 4. The low state spectrum can be fit with an absorbed power-law () but the fit is improved slightly with the addition of a plasma component (xsmekal) at temperature keV ( for two fewer d-o-f). The best-fit power-law slope is typical of unabsorbed AGN, and best-fit intrinsic absorption is consistent with zero. The unabsorbed 0.3–8 keV luminosity is erg s-1. The high state spectrum can also be fit by an absorbed power-law. The best-fit slope is , steeper but consistent with the low state slope within the uncertainties. The differences from the low state spectrum are, first, that the fit requires intrinsic absorption cm-2), and second, that there is no evidence for the MEKAL component. If a plasma component exists in the high state its flux falls below that of the power-law component. The unabsorbed 0.3–8 keV luminosity in the high state is erg s-1. Figure 10 shows the high and low state spectra over-plotted. The spectra are identical below 1 keV, with the entire flux difference arising from the power-law normalization between 1 and 7 keV, and a possible “shoulder” between 1 and 2 keV in the high state. A fit where the power-law slope is forced to be identical in the low and high states is of similar statistical significance and produces best-fit values similar to the separate fits. This fit is shown in Table 4 in the rows labeled “sim. low” and “sim. high”. The merged spectrum is similar to the high state one in that an absorbed power-law provides a good fit without the need for additional components.
We analyzed archival HST WFPC2 images of NGC 5457, a 2400 s exposure using the F336W filter (referred to as U band below; nucleus on WF3) and a 1600 s exposure using the F547M filter (referred to as V band below; nucleus on PC1). The nucleus and the star cluster are detected in both images. In 2-pixel radius apertures, the U band nuclear flux is erg cm-2 s-1 Å-1 and the V band flux is erg cm-2 s-1 Å-1, corresponding to and in the STMAG system. The 2MASS PSC contains a source at the position of the nucleus (x-ray source N) but none at the location of source S. The given magnitudes , , and all correspond to erg s-1. The nucleus was not detected by FIRST. Heckman (1980) gives an upper limit to the nuclear luminosity at 6 cm corresponding to erg s-1.
McElroy (1995) reports km s-1 which implies . The corresponding Eddington luminosity is erg s-1. Assuming the source is an AGN, and assuming bolometric correction factors of and in the x-ray and IR, respectively, implies that the bolometric luminosity is in the range – erg s-1, or that –.
3.6.1 The nature of the nuclear emission
The nuclear source shows several properties typical of an AGN. First, variability: The source varies by a factor of nine in eight months in 2004, and also varied between 2000 and 2004. Second, the x-ray spectrum: The spectrum is an absorbed power-law with slope . In particular, the spectrum cannot be fit by a thermal component alone — a power-law is necessary. The low state spectrum is reminiscent of highly obscured AGN where an unabsorbed but diminished spectrum is seen via scattering. Third, x-ray colors: The ratio of 0.3–2 keV, 2–5 keV, and 5–8 keV counts puts this object into the Compton-thick AGN part of the Levenson color-color diagram (Fig. 9 in Levenson et al. 2006). In the context of the latter two points it is worth noting that if the source really is a highly absorbed AGN then energy emitted by the AGN may show up as re-processed radiation in the infrared. The existence of an infrared source with luminosity erg s-1 is consistent with this picture, though it does not argue for the presence of an AGN to exclusion of other types of sources.
The x-ray properties of the nucleus are consistent with both the XRB and AGN hypotheses, but an AGN is not ruled out. The inferred x-ray luminosity ( erg s-1) is in the range seen from XRBs, and the observed x-ray colors put this source in the LMXB region of the Prestwich et al. (2003) color-color diagram. In favor of the XRB scenario is that the variability of the source is similar to the spectral state changes in XRBs. The low state may be interpreted as being the XRB state known as “hard” or “low/hard”, and the best-fit power law slope, is the value seen in XRBs in this state. The high state would then be the XRB state known as the “very high” or “steep power law” state. The best-fit power-law slope in this case is less steep than is usually seen in XRBs in this state () but the steeper value is included in the 90% confidence range. However, it must be kept in mind first, that at the quality of the spectra analyzed here the power law slopes are consistent with being identical in the two states, and second, that AGNs can show the same state behavior (e.g. 1H 0419-577, Pounds et al. 2004). In XRBs, the steep power-law state is associated with the presence of quasi-periodic oscillations in the x-ray emission, while the hard state is associated with the presence of a radio jet. In principle the presence of these features could provide additional evidence supporting the XRB hypothesis, but it is not currently feasible to detect them in XRBs at the distance of NGC 5457.
Thus, there are again two possible scenarios, as in the case of NGC 3184. The x-ray source could be an HMXB in a super-star cluster. The star cluster would dominate the optical and IR emission. The large variation observed in the x-ray flux rules out the source’s being more than one HMXB, as otherwise they would have to be varying in concert. The actual amount of obscuration is important, however, for the plausibility of the HMXB hypothesis since the inferred x-ray luminosity ( erg s-1 in the high state) is already at the high end of the range of XRB luminosities and there is not much room for a significantly higher absorption-corrected intrinsic luminosity. The alternative scenario is an AGN together with a nuclear star cluster. In AGNs both the intrinsic luminosity and the amount of obscuration are known to vary. The low state x-ray spectrum may be explained as a truly under-luminous ( erg s-1) unabsorbed AGN, or as an AGN where the obscuration is so high that only scattered light, and no direct emission, is seen. The fact that the x-ray colors are similar to those of Compton-thick AGN (Levenson et al. 2006) supports the latter view, but we also note the absence of the keV Fe K line in the x-ray spectrum that is often present in the reflected component. Though both the HMXB and AGN hypotheses are possible, on balance the AGN appears to be the more plausible one.
4 Discussion
The motivation for this paper was to evaluate the feasibility of detecting low-mass SMBHs in late-type spiral galaxies, which may still be accreting at the current epoch and if so should be detectable in x-rays. The six galaxies studied in this paper are not all late-type, but span the range Sa–Sd. NGC 3169 and NGC 4102 were regarded as low luminosity AGNs. None of the remaining four nuclei, however, was known to have an accreting SMBH, of any mass. NGC 3169 and NGC 4102 are of type Sa and Sb, which have massive bulges and are expected to have massive SMBHs. For galaxies of types Scd and Sd, on the other hand, the lack of a luminous AGN could mean either that there is no SMBH or that the mass of the SMBH is low. As such, the observations studied here examine both aspects of a search for accreting low-mass SMBH: First, are these objects really detectable, given that the accretion rate is expected to be low? Second, are any sources detected in the very latest type spiral galaxies that have small or no bulges?
We first note that of the six galaxies presented here, all six show nuclear x-ray sources. This implies that it is a very common occurrence. In a survey of late-type spiral galaxies such as our ongoing Chandra survey, therefore, the predominant concern is not going to be detection efficiency, but rather identification of the AGNs among the detected sources. Given that the sample presented in this paper consists of only six galaxies, we do not draw statistical conclusions here of the prevalence of very low-luminosity AGNs in nearby galaxies. But we note that, as shown in §§3.1–3.6, of the six nuclear x-ray sources, NGC 3169 is almost certainly an AGN, and NGC 4102, NGC 3184, and NGC 5457 , have very strong, though not conclusive, arguments in favor of their being AGNs. The two remaining galaxies, NGC 4713 and NGC 4647, are ambiguous but AGNs are not ruled out. We discuss below the issues such surveys will face when attempting to identify the nature of the detected sources. The diagnostic tools traditionally used to distinguish AGNs from non-AGNs (e.g. optical line ratios, Baldwin et al. 1981; Veilleux & Osterbrock 1987) were developed in the course of studying luminous AGN. Dilution of the AGN emission by host galaxy light was not a serious problem and observations with low spatial resolution (several arcseconds) sufficed. In the study of AGN that are either intrinsically less luminous or are heavily obscured, however, host galaxy light becomes increasingly problematic, and surveys relying on optical spectra (e.g. Ho et al. 1995; Greene & Ho 2004) require careful subtraction of the starlight using galactic spectral templates. In the weakest AGNs, however, signs of AGN emission may not be detected by the usual diagnostics. This problem will persist until optical observations with angular resolution of 1–10 mas become possible so that host galaxy light can be effectively excluded, though it can be mitigated by using regions of the spectrum where host galaxy emission is negligible, for example very high energy x-rays (tens to hundreds of keV). The detection of a compact radio source unresolved at milliarcsecond-scales, especially if the source is accompanied by jets, would also unambiguously identify the nucleus as an AGN. This has been the motivation for radio surveys like that of Nagar et al. (2002). Some AGNs obscured in the optical and UV may be detectable using infrared emission line strengths and ratios (e.g. Dale et al. 2006; Satyapal et al. 2007, 2008).
While the methods listed above allow the unambiguous identification of AGNs, observations often do not have the angular resolution or sensitivity to distinguish AGN and non-AGN flux. Other sources of radiation in the vicinity of the AGN are, for example, plasma photoionized by the AGN itself, or a nuclear star cluster. The targeted AGNs have very low luminosity and thus even moderate amounts of obscuration may cause a significant decrement in the observed flux. In most cases, therefore, the AGN contribution should not be expected to dominate the total observed flux. Consequently, identifying these AGNs requires a different approach than what can be used in the case of the more luminous AGNs (Seyferts and QSOs). AGNs can be identified using x-ray observations (e.g. with Chandra and XMM-Newton) solely, but only if they are point sources whose inferred luminosities are greater than erg s-1. Below that value, AGNs can become indistinguishable from ULXs and XRBs in x-rays. ULXs can have luminosities of a few times erg s-1 (e.g. Soria et al. 2007) and have x-ray spectra that look similar to AGN spectra. It has been suggested (Stobbart et al. 2006) that ULX spectra show a break at keV. AGNs are not known to show this break. In high quality spectra with a large number of counts it may be possible to exploit this difference to separate ULXs and AGNs. XRBs have power law spectra with , can show an Fe K emission line, and emit hard x-rays, all characteristics of AGNs as well. Additionally, even with Chandra’s angular resolution, the physical space probed ranges from the central 10 to 100 pc of the galaxy. The existence of one or more XRBs within that region would be unsurprising. However, the fact that the inferred luminosities are as high as erg s-1 severely constrains the expected number of XRBs. For example, for NGC 5457 , one of the four galaxies presented here that are not confirmed AGNs, Pence et al. (2001) provide a log N-log S relation as well as the surface density of x-ray point sources as a function of radius (their Figs. 3 and 4). Approximately 12.5% of the sources have luminosities exceeding erg s-1. The surface density of sources in the innermost is arcmin-2. Therefore we may expect sources arcmin-2 above the luminosity cut-off in the central , or such sources within the Chandra source circle of radius that has been used here. NGC 5457 is of type Scd, and can be taken to be representative of the other three galaxies, NGC 4647, NGC 3184, and NGC 4713 which are types Sc, Scd, and Sd, respectively. Thus invoking XRBs and ULXs alone to explain the x-ray observations leads to physically implausible conditions, such as requiring that most, or all, quiescent, non-starburst spiral galaxies have a ULX or XRBs in the central . Nevertheless, x-ray observations by themselves will usually be inadequate to distinguish AGNs from non-AGNs in any particular instance.
Information from other wavebands is thus crucial for the identification process. For the six galaxies in this paper multi-wavelength photometry is summarized in Tables 5 and 6. But here too, traditional methods of identifying AGNs using flux ratios such as , , and , must be used with caution. The low luminosities of the AGNs mean that the emission in the two bands being compared may not be from the same object. For instance, for an obscured AGN surrounded by a nuclear star cluster, the observed x-ray flux may be from the AGN but the optical flux may be dominated by the cluster. The existence of an AGN must instead be inferred by consistency and plausibility checks considering as much of the spectral energy distribution as possible, and the goal is the rejection of the hypothesis that all of the observed properties can be explained without requiring the presence of an AGN. NGC 3184 provides a good example where different modes of observing, imaging and spectroscopy, in two wavebands, x-ray and IR, together make a compelling argument for the presence of an AGN where each observation individually is ambiguous.
Nuclear star clusters are fairly common in spiral galaxies (e.g. Böker et al. 2002; Walcher et al. 2005; Seth et al. 2008). A cluster poses two main problems. First, it makes the presence of XRBs more likely. Second, if the cluster is young and contains many O and B stars, it may overwhelm AGN emission in the UV in addition to the optical (e.g. NGC 4303, Colina et al. 2002). It may be possible in some cases, as for NGC 1042 (Shields et al. 2008) and NGC 4102 (Gonçalves et al. 1999), to attempt a separation of the cluster and AGN components in the optical spectrum. In addition, stellar spectra, even for late-type stars, fall faster towards the infrared than the power-laws typical of AGNs. The mid-infrared colors of AGNs, therefore, tend to be redder than those of stellar populations and this color difference can be used to infer the presence of an AGN (Stern et al. 2005).
In addition to the spectral energy distribution, source variability can be a discriminant, as AGNs are known to vary in all wavelengths, whereas a star cluster, say, would not. Conversely, if the variation is periodic it would rule out an AGN and argue for an XRB instead.
A survey of the type discussed here finds AGNs and strong AGN candidates, but does not measure the masses of the SMBHs in those AGNs. Measurement of the mass of one of these SMBHs will be a difficult endeavor, since the sphere of influence of the black hole cannot be resolved with current technology and resources. None of the six objects studied in this paper shows broad optical emission lines whose widths could be used to estimate the BH mass, and this is likely to be typical behavior. Spectropolarimetry may uncover broad lines in polarized light in some of the AGNs. Estimates of the SMBH mass may be made by using known scaling relationships, with the caveat that the correlations are all based on SMBHs two or more orders of magnitude more massive than the ones expected to be found by the survey. The least indirect method is an application of the observed correlation between the x-ray power law slope and Eddington ratio (Williams et al. 2004). The Eddington ratio and the luminosity in turn provide an estimate of the mass of the SMBH. Other relationships that can be used are: (a) the – relation (Ferrarese & Merritt 2000; Gebhardt et al. 2000), but this method becomes more and more uncertain as the bulge itself becomes ill-defined in the latest-type spirals; (b) the – relationship (Kormendy & Richstone 1995; McLure & Dunlop 2001; Marconi & Hunt 2003), which has more scatter and also faces the problem of the definition of the bulge; (c) the – relation (Ferrarese 2002; Baes et al. 2003), which has the advantage that it does not require the presence of a well-defined bulge; (d) the – relation (Graham et al. 2001), where is the concentration of light. There is also a reported relationship between black hole mass and core radio power (Snellen et al. 2003; McLure et al. 2004), but this relationship is not as well established as the others, and is based on observations of elliptical galaxies, so its applicability to the spiral galaxies here is uncertain. Overall, there is unlikely to be one standard method of measurement that can be applied to these galaxies, but one or more of the above methods may provide useful estimates of or limits to the masses of the SMBHs in these AGNs. Mass measurements independent of the scaling relationships are possible if an object turns out to have broad emission lines, like NGC 4395, in which case line widths or reverberation mapping may be used, or if it has maser emission, like NGC 4258, in which case gas dynamics can be used. Mass measurement in other cases will have to await mas-scale angular resolution in bands other than radio to resolve the sphere of influence of these black holes.
Of the six galaxies here, NGC 3169, NGC 4102, and NGC 5457 have measurements of either the stellar velocity dispersion or the luminosity of the bulge, thus allowing an estimate of their SMBH masses (assuming here that the source in M 101 is an AGN). The scatter in the – and – relations, together with the uncertainty in the observed flux and the bolometric correction, result in uncertainties of about an order of magnitude in the inferred Eddington ratio, but all three objects have . This is in the range seen in low-luminosity AGNs (e.g. for M 81; Young et al. 2007), and much higher than the seen in truly quiescent SMBHs. These observations indicate that there is indeed a population of accreting SMBHs in nearby spiral galaxies that do not show optical signs of activity but can be uncovered by looking for their x-ray emission. Such a population will answer the question of whether the bulge is the dominant component that determines the existence, and mass, of a nuclear SMBH. The discoveries of AGNs in the Sd galaxies NGC 4395 (Ho et al. 1997b) and NGC 3621 (Satyapal et al. 2007), and the strong evidence for AGNs in the Scd galaxies NGC 3184 and NGC 5457 suggest it is not, at least as far as existence is concerned. Among the SMBHs discovered in the latest-type spirals (with small or no bulges) and in the lowest-mass galaxies should be a population of SMBHs with masses less than , enabling a systematic study of the low-mass end of the local supermassive black hole mass function.
| Target | Morph. | Nucleus | Coordinates (J2000) | Dist.bbFrom Tully (1988) except from Stetson et al. (1998) for NGC 5457. | Scale | Obs. Date | ObsID | Exp. | |
|---|---|---|---|---|---|---|---|---|---|
| Type | TypeaaFrom Ho et al. (1997a). L2: Type 2 LINER, T2: Type 2 Transition object. | RA | Dec | (Mpc) | (pc/″) | (ks) | |||
| NGC 3169 | Sa | L2 | 10 14 15.0 | +03 27 58 | 19.7 | 96 | 2001 May 2 | 1614 | 2.0 |
| NGC 3184 | Scd | H II | 10 18 17.0 | +41 25 28 | 8.7 | 42 | 2000 Jan 8 | 804 | 39.8 |
| 2000 Feb 3 | 1520 | 21.3 | |||||||
| NGC 4102 | Sb | H II | 12 06 23.1 | +52 42 39 | 17.0 | 82 | 2003 Apr 30 | 4014 | 4.9 |
| NGC 4647 | Sc | H II | 12 43 32.3 | +11 34 55 | 16.8 | 81 | 2000 Apr 20 | 785 | 36.9 |
| NGC 4713 | Sd | T2 | 12 49 57.9 | +05 18 41 | 17.9 | 87 | 2003 Jan 28 | 4019 | 4.9 |
| NGC 5457ccNGC 5457 (M 101) was observed multiple times. The total observation time analyzed here is given in this table. The individual observations are listed in Table 3 | Scd | H II | 14 03 12.6 | +54 20 57 | 7.2 | 35 | ccNGC 5457 (M 101) was observed multiple times. The total observation time analyzed here is given in this table. The individual observations are listed in Table 3 | ccNGC 5457 (M 101) was observed multiple times. The total observation time analyzed here is given in this table. The individual observations are listed in Table 3 | 750 |
| Target | Counts | Bkg/Src | HRaaHardness ratio, HR = (HS)/(H+S), where H and S are the counts in the hard and soft bands respectively, calculated using the method described in Park et al. (2006). The tool used is available at http://hea-www.harvard.edu/AstroStat/BEHR/. | |||||
|---|---|---|---|---|---|---|---|---|
| Broad | Hard | Soft | Area Ratio | |||||
| Src | Bkg | Src | Bkg | Src | Bkg | |||
| NGC 3169 | 159 | 23 | 148 | 5 | 11 | 18 | 21.4 | |
| NGC 3184 N | 36 | 95 | 4 | 33 | 32 | 62 | 92 | |
| S | 117 | 95 | 13 | 33 | 104 | 62 | 60 | |
| NGC 4102 all | 354 | 48 | 78 | 8 | 276 | 40 | 6.8 | |
| core | 171 | 48 | 68 | 8 | 103 | 40 | 52.5 | |
| ext | 115 | 48 | 6 | 8 | 109 | 40 | 26.1 | |
| NGC 4647 | 15 | 38 | 1 | 15 | 14 | 23 | 10.1 | |
| NGC 4713 | 10 | 4 | 1 | 0 | 9 | 4 | 21.4 | |
| NGC 5457 | 314 | 256 | 23 | 45 | 291 | 211 | 20.8 | |
| ObsID | Obs Date | Exp Time | North source | South source | ||||
|---|---|---|---|---|---|---|---|---|
| Counts | Rate | HR | Counts | Rate | HR | |||
| (ks) | (ks-1) | (ks-1) | ||||||
| 934 | 2000 Mar 26 | 262 | 264 | |||||
| 4731aaSource extended, or possibly image smeared. | 2004 Jan 19 | 92 | 136 | |||||
| 5300 | 2004 Mar 7 | 36 | 117 | |||||
| 5309 | 2004 Mar 14 | 38 | 158 | |||||
| 4732 | 2004 Mar 19 | 56 | 151 | |||||
| 5322 | 2004 May 3 | 54 | 144 | |||||
| 5323 | 2004 May 9 | 42 | 120 | |||||
| 5338aaSource extended, or possibly image smeared. | 2004 Jul 6 | 61 | 41 | |||||
| 5339bbPossible residual contamination from background flare. | 2004 Jul 7 | 18 | 27 | |||||
| 5340 | 2004 Jul 9 | 81 | 110 | |||||
| 4734 | 2004 Jul 11 | 31 | 63 | |||||
| 6114 | 2004 Sep 5 | 91 | 64 | |||||
| 6115 | 2004 Sep 8 | 96 | 63 | |||||
| 4735 | 2004 Sep 12 | 70 | 49 | |||||
| 4736aaSource extended, or possibly image smeared.bbPossible residual contamination from background flare. | 2004 Nov 1 | 290 | 122 | |||||
| 6152aaSource extended, or possibly image smeared. | 2004 Nov 7 | 133 | 51 | |||||
| Target | Galactic | ModelaaModel labels: ab=xswabs, photoelectric absorption; ga=xswabs with value frozen at Galactic column density towards this target; br=xsbremss, thermal bremsstrahlung; g=gauss1d, one-dimensional Gaussian; me=xsmekal, thermal plasma; pl=powlaw1d, one-dimensional power law; rn=xspexrav, power-law reflected by neutral material. | Spectral Fit Parameters | (dof) | |||||
|---|---|---|---|---|---|---|---|---|---|
| NH | kT | NH | Refl.bbReflection scaling factor. | Line | EW | ||||
| () | (keV) | () | (keV) | (keV) | |||||
| NGC 3169 | 2.86 | ab(pl) | ccCash statistic (cstat in Sherpa). | ||||||
| ab(pl) | |||||||||
| NGC 4102 core | 1.79 | ab(pl) | ccCash statistic (cstat in Sherpa). | ||||||
| ab(rn) | ccCash statistic (cstat in Sherpa). | ||||||||
| ab(rn+g) | ddUnconstrained by fit. | ||||||||
| ab(rn+g) | ccCash statistic (cstat in Sherpa). | ||||||||
| ext | ab(br) | ||||||||
| NGC 5457 sep. low | 1.15 | ab(me+pl) | |||||||
| sep. high | ab(pl) | ||||||||
| sim. low | ab(me+pl) | ||||||||
| sim. high | ab(pl) | ||||||||
| merged | ab(pl) | ||||||||
| Filter | NGC 3169 | NGC 4102 | NGC 4647 | NGC 3184 | NGC 5457 | NGC 4713 | |
|---|---|---|---|---|---|---|---|
| or Band | (Sa) | (Sb) | (Sc) | (Scd) | (Scd) | (Sd) | |
| X-ray | 0.3–8 keV | 41.7 | 40.2 | 39.0ababfootnotemark: | 37.3ccBased on a small number of counts. A power-law spectrum was assumed. Intrinsic absorption is unknown. | 37.5–38.5ddVariable source. | 38.6ccBased on a small number of counts. A power-law spectrum was assumed. Intrinsic absorption is unknown. |
| UV & Opt. | F300W | ||||||
| F336W | 39.0 | ||||||
| F547M | 39.5 | ||||||
| F606W | 39.5 | 40.1 | |||||
| IR | 42.6 | 42.8 | 38.8 | 40.9 | 41.0 | 41.0 | |
| Radio | 15 GHz | ||||||
| 5 GHz | 37.2 | ||||||
| 1.4 GHz | 38.0 | 36.9bbLarge positional uncertainty makes it unclear whether the detected source is really the nucleus. |
Note. — Values are in the specified bandpass in the x-ray and where a single filter, wavelength, or frequency is given. Note that the values are derived from observations with varied instruments, PSFs, apertures, and signal-to-noise ratios, and the uncertainties can be as large as a factor of two.
| Band | Aperture | aa0.3–12 keV. |
|---|---|---|
| Radius | (erg s-1) | |
| 3.6 | 40.6 | |
| 4.5 | 40.4 | |
| 5.8 | 40.7 | |
| 8.0 | 40.8 | |
| 24 | 41.1 | |
| 70 | 41.5 | |
| 160 | 41.7 |
References
- Assef et al. (2008) Assef, R. J. et al. 2008, ApJ, 676, 286
- Baes et al. (2003) Baes, M., Buyle, P., Hau, G. K. T., & Dejonghe, H. 2003, MNRAS, 341, L44
- Baldwin et al. (1981) Baldwin, J. A., Phillips, M. M., & Terlevich, R. 1981, PASP, 93, 5
- Barth et al. (2004) Barth, A. J., Ho, L. C., Rutledge, R. E., & Sargent, W. L. W. 2004, ApJ, 607, 90
- Bianchi et al. (2006) Bianchi, S., Guainazzi, M., & Chiaberge, M. 2006, A&A, 448, 499
- Böker et al. (2002) Böker, T., Laine, S., van der Marel, R. P., Sarzi, M., Rix, H.-W., Ho, L. C., & Shields, J. C. 2002, AJ, 123, 1389
- Carollo et al. (1997) Carollo, C. M., Stiavelli, M., de Zeeuw, P. T., & Mack, J. 1997, AJ, 114, 2366
- Colina et al. (2002) Colina, L., Gonzalez Delgado, R., Mas-Hesse, J. M., & Leitherer, C. 2002, ApJ, 579, 545
- Condon (1992) Condon, J. J. 1992, ARA&A, 30, 575
- Condon et al. (1982) Condon, J. J., Condon, M. A., Gisler, G., & Puschell, J. J. 1982, ApJ, 252, 102
- Dale et al. (2006) Dale, D. A. et al. 2006, ApJ, 646, 161
- de Vaucouleurs et al. (1991) de Vaucouleurs, G., de Vaucouleurs, A., Corwin, Jr., H. G., Buta, R. J., Paturel, G., & Fouque, P. 1991, Third Reference Catalogue of Bright Galaxies (Volume 1-3, XII, 2069 pp. 7 figs.. Springer-Verlag Berlin Heidelberg New York)
- Dolphin (2002) Dolphin, A. E. 2002, in The 2002 HST Calibration Workshop : Hubble after the Installation of the ACS and the NICMOS Cooling System, Proceedings of a Workshop held at the Space Telescope Science Institute, Baltimore, Maryland, October 17 and 18, 2002. Edited by Santiago Arribas, Anton Koekemoer, and Brad Whitmore. Baltimore, MD: Space Telescope Science Institute, 2002., p.301, ed. S. Arribas, A. Koekemoer, & B. Whitmore, 301
- Dong & De Robertis (2006) Dong, X. Y., & De Robertis, M. M. 2006, AJ, 131, 1236
- Dudik et al. (2005) Dudik, R. P., Satyapal, S., Gliozzi, M., & Sambruna, R. M. 2005, ApJ, 620, 113
- Eracleous et al. (1995) Eracleous, M., Livio, M., & Binette, L. 1995, ApJ, 445, L1
- Eracleous et al. (2002) Eracleous, M., Shields, J. C., Chartas, G., & Moran, E. C. 2002, ApJ, 565, 108
- Ferrarese (2002) Ferrarese, L. 2002, ApJ, 578, 90
- Ferrarese & Ford (2005) Ferrarese, L., & Ford, H. 2005, Space Science Reviews, 116, 523
- Ferrarese & Merritt (2000) Ferrarese, L., & Merritt, D. 2000, ApJ, 539, L9
- Filho et al. (2004) Filho, M. E., Fraternali, F., Markoff, S., Nagar, N. M., Barthel, P. D., Ho, L. C., & Yuan, F. 2004, A&A, 418, 429
- Fiore et al. (2003) Fiore, F. et al. 2003, A&A, 409, 79
- Flohic et al. (2006) Flohic, H. M. L. G., Eracleous, M., Chartas, G., Shields, J. C., & Moran, E. C. 2006, ApJ, 647, 140
- Freedman et al. (2001) Freedman, W. L. et al. 2001, ApJ, 553, 47
- Ganda et al. (2006) Ganda, K., Falcón-Barroso, J., Peletier, R. F., Cappellari, M., Emsellem, E., McDermid, R. M., de Zeeuw, P. T., & Carollo, C. M. 2006, MNRAS, 367, 46
- Gebhardt et al. (2000) Gebhardt, K. et al. 2000, ApJ, 539, L13
- Ghosh et al. (2007) Ghosh, H., Pogge, R. W., Mathur, S., Martini, P., & Shields, J. C. 2007, ApJ, 656, 105
- Gonçalves et al. (1999) Gonçalves, A. C., Véron-Cetty, M.-P., & Véron, P. 1999, A&AS, 135, 437
- Graham et al. (2007) Graham, A. W., Driver, S. P., Allen, P. D., & Liske, J. 2007, MNRAS, 378, 198
- Graham et al. (2001) Graham, A. W., Erwin, P., Caon, N., & Trujillo, I. 2001, ApJ, 563, L11
- Greene & Ho (2004) Greene, J. E., & Ho, L. C. 2004, ApJ, 610, 722
- Greene & Ho (2007a) ——. 2007a, ApJ, 667, 131
- Greene & Ho (2007b) ——. 2007b, ApJ, 656, 84
- Grimm et al. (2003) Grimm, H.-J., Gilfanov, M., & Sunyaev, R. 2003, MNRAS, 339, 793
- Hasinger et al. (2005) Hasinger, G., Miyaji, T., & Schmidt, M. 2005, A&A, 441, 417
- Heckman (1980) Heckman, T. M. 1980, A&A, 87, 152
- Héraudeau & Simien (1998) Héraudeau, P., & Simien, F. 1998, A&AS, 133, 317
- Ho (2008) Ho, L. C. 2008, ArXiv e-prints, 0803.2268
- Ho et al. (1995) Ho, L. C., Filippenko, A. V., & Sargent, W. L. 1995, ApJS, 98, 477
- Ho et al. (1997a) Ho, L. C., Filippenko, A. V., & Sargent, W. L. W. 1997a, ApJS, 112, 315
- Ho et al. (1997b) Ho, L. C., Filippenko, A. V., Sargent, W. L. W., & Peng, C. Y. 1997b, ApJS, 112, 391
- Holtzman et al. (1995) Holtzman, J. A. et al. 1995, PASP, 107, 156
- Kennicutt et al. (2003) Kennicutt, Jr., R. C. et al. 2003, PASP, 115, 928
- Kormendy & Richstone (1995) Kormendy, J., & Richstone, D. 1995, ARA&A, 33, 581
- Kotanyi (1980) Kotanyi, C. G. 1980, A&AS, 41, 421
- Laor (2003) Laor, A. 2003, ApJ, 590, 86
- Larsen (2004) Larsen, S. S. 2004, A&A, 416, 537
- Levenson et al. (2006) Levenson, N. A., Heckman, T. M., Krolik, J. H., Weaver, K. A., & Życki, P. T. 2006, ApJ, 648, 111
- Marconi & Hunt (2003) Marconi, A., & Hunt, L. K. 2003, ApJ, 589, L21
- Marconi et al. (2004) Marconi, A., Risaliti, G., Gilli, R., Hunt, L. K., Maiolino, R., & Salvati, M. 2004, MNRAS, 351, 169
- Martini et al. (2002) Martini, P., Kelson, D. D., Mulchaey, J. S., & Trager, S. C. 2002, ApJ, 576, L109
- McElroy (1995) McElroy, D. B. 1995, ApJS, 100, 105
- McLure & Dunlop (2001) McLure, R. J., & Dunlop, J. S. 2001, MNRAS, 327, 199
- McLure et al. (2004) McLure, R. J., Willott, C. J., Jarvis, M. J., Rawlings, S., Hill, G. J., Mitchell, E., Dunlop, J. S., & Wold, M. 2004, MNRAS, 351, 347
- Merloni (2004) Merloni, A. 2004, MNRAS, 353, 1035
- Mouri & Taniguchi (1992) Mouri, H., & Taniguchi, Y. 1992, ApJ, 386, 68
- Nagar et al. (2005) Nagar, N. M., Falcke, H., & Wilson, A. S. 2005, A&A, 435, 521
- Nagar et al. (2002) Nagar, N. M., Falcke, H., Wilson, A. S., & Ulvestad, J. S. 2002, A&A, 392, 53
- Neff & Ulvestad (2000) Neff, S. G., & Ulvestad, J. S. 2000, AJ, 120, 670
- Nicastro (2000) Nicastro, F. 2000, ApJ, 530, L65
- Nicastro et al. (2003) Nicastro, F., Martocchia, A., & Matt, G. 2003, ApJ, 589, L13
- Park et al. (2006) Park, T., Kashyap, V. L., Siemiginowska, A., van Dyk, D. A., Zezas, A., Heinke, C., & Wargelin, B. J. 2006, ApJ, 652, 610
- Pence et al. (2001) Pence, W. D., Snowden, S. L., Mukai, K., & Kuntz, K. D. 2001, ApJ, 561, 189
- Peterson et al. (2005) Peterson, B. M. et al. 2005, ApJ, 632, 799
- Pogge (1988) Pogge, R. W. 1988, ApJ, 332, 702
- Pounds et al. (2004) Pounds, K. A., Reeves, J. N., Page, K. L., & O’Brien, P. T. 2004, ApJ, 605, 670
- Prestwich et al. (2003) Prestwich, A. H., Irwin, J. A., Kilgard, R. E., Krauss, M. I., Zezas, A., Primini, F., Kaaret, P., & Boroson, B. 2003, ApJ, 595, 719
- Ranalli et al. (2003) Ranalli, P., Comastri, A., & Setti, G. 2003, A&A, 399, 39
- Randall et al. (2006) Randall, S. W., Sarazin, C. L., & Irwin, J. A. 2006, ApJ, 636, 200
- Satyapal et al. (2004) Satyapal, S., Sambruna, R. M., & Dudik, R. P. 2004, A&A, 414, 825
- Satyapal et al. (2008) Satyapal, S., Vega, D., Dudik, R. P., Abel, N. P., & Heckman, T. 2008, ArXiv e-prints, 0801.2759
- Satyapal et al. (2007) Satyapal, S., Vega, D., Heckman, T., O’Halloran, B., & Dudik, R. 2007, ApJ, 663, L9
- Seth et al. (2008) Seth, A., Agueros, M., Lee, D., & Basu-Zych, A. 2008, ApJ, in press
- Shankar et al. (2004) Shankar, F., Salucci, P., Granato, G. L., De Zotti, G., & Danese, L. 2004, MNRAS, 354, 1020
- Shields et al. (2008) Shields, J. C., Walcher, C. J., Boeker, T., Ho, L. C., Rix, H.-W., & van der Marel, R. P. 2008, ApJ, in press
- Skrutskie et al. (2006) Skrutskie, M. F. et al. 2006, AJ, 131, 1163
- Snellen et al. (2003) Snellen, I. A. G., Lehnert, M. D., Bremer, M. N., & Schilizzi, R. T. 2003, MNRAS, 342, 889
- Soria et al. (2007) Soria, R., Baldi, A., Risaliti, G., Fabbiano, G., King, A., La Parola, V., & Zezas, A. 2007, MNRAS, 379, 1313
- Soria et al. (2006a) Soria, R., Fabbiano, G., Graham, A. W., Baldi, A., Elvis, M., Jerjen, H., Pellegrini, S., & Siemiginowska, A. 2006a, ApJ, 640, 126
- Soria et al. (2006b) Soria, R., Graham, A. W., Fabbiano, G., Baldi, A., Elvis, M., Jerjen, H., Pellegrini, S., & Siemiginowska, A. 2006b, ApJ, 640, 143
- Stern et al. (2005) Stern, D. et al. 2005, ApJ, 631, 163
- Stetson et al. (1998) Stetson, P. B., et al. 1998, ApJ, 508, 491
- Stobbart et al. (2006) Stobbart, A.-M., Roberts, T. P., & Wilms, J. 2006, MNRAS, 368, 397
- Terashima & Wilson (2003) Terashima, Y., & Wilson, A. S. 2003, ApJ, 583, 145
- Tully (1988) Tully, R. B. 1988, Nearby galaxies catalog (Cambridge and New York, Cambridge University Press, 1988, 221 p.)
- Tzanavaris & Georgantopoulos (2007) Tzanavaris, P., & Georgantopoulos, I. 2007, A&A, 468, 129
- Ulvestad & Ho (2002) Ulvestad, J. S., & Ho, L. C. 2002, ApJ, 581, 925
- Veilleux & Osterbrock (1987) Veilleux, S., & Osterbrock, D. E. 1987, ApJS, 63, 295
- Walcher et al. (2005) Walcher, C. J. et al. 2005, ApJ, 618, 237
- Williams et al. (2004) Williams, R. J., Mathur, S., & Pogge, R. W. 2004, ApJ, 610, 737
- Willis et al. (1976) Willis, A. G., Oosterbaan, C. E., & de Ruiter, H. R. 1976, A&AS, 25, 453
- Young et al. (2007) Young, A. J., Nowak, M. A., Markoff, S., Marshall, H. L., & Canizares, C. R. 2007, ApJ, 669, 830