Spitzer observations of the Hyades:
Circumstellar debris disks at 625 Myr of age
Abstract
We use the Spitzer Space Telescope to search for infrared excess at 24, 70, and 160 m due to debris disks around a sample of 45 FGK-type members of the Hyades cluster. We supplement our observations with archival 24 and 70 m Spitzer data of an additional 22 FGK-type and 11 A-type Hyades members in order to provide robust statistics on the incidence of debris disks at 625 Myr of age, an era corresponding to the late heavy bombardment in the Solar System. We find that none of the 67 FGK-type stars in our sample show evidence for a debris disk, while 2 out of the 11 A-type stars do so. This difference in debris disk detection rate is likely to be due to a sensitivity bias in favor of early-type stars. The fractional disk luminosity, , of the disks around the two A-type stars is 410-5, a level that is below the sensitivity of our observations toward the FGK-type stars. However, our sensitivity limits for FGK-type stars are able to exclude, at the 2- level, frequencies higher than 12% and 5% of disks with 110-4 and 510-4, respectively. We also use our sensitivity limits and debris disk models to constrain the maximum mass of dust, as a function of distance from the stars, that could remain undetected around our targets.
1 Introduction
Soon after IRAS discovered cold circumstellar disks around main-sequence (MS) stars (Aumann et al., 1984), it was realized that these disks could not be made of primordial material. Followup CO observations (e.g. Yamashita et al., 1993) showed that molecular gas was highly depleted around these disks. Since, in the absence of gas, the survival time of dust due to dissipation processes such as radiation/wind pressure and the Poynting-Robertson effect is much shorter than the ages of MS stars, these systems are believed to be debris disks where dust is continuously replenished by collisions between planetesimals, the building blocks of planets. Because of their probable connection with the formation of planetary systems, debris disks rapidly became the subject of many studies. However, IRAS was only sensitive enough to study bright nearby objects and most of the pre-Spitzer statistics come from surveys performed by IRAS’s successor, the ISO satellite. Habing et al. (2001) studied 84 nearby ( pc) A,F,G, and K stars for which ISO was sensitive to photospheric fluxes and detected 60 m excess in 50% of the stars younger than 400 Myr and in 10% of the stars older than 400 Myr. They suggest that this sudden decrease in the fraction of stars with disks around 400 Myr is related to the lifetime of planetesimals that replenish the dust. Spangler et al. (2001) observed 150 pre-main sequence stars and young main sequence stars and detected 60 m excess in 25% of the objects. Their observations do not confirm a sudden decrease in the disk fraction around 400 Myr but rather suggest a power law relationship (index –2) between the age of the star and the fractional dust luminosity, . They argue that such a power law naturally arises in collisionally replenished debris disks. The discrepancies in the results from these ISO surveys can probably be traced back to the different target selection criteria and observing strategies and to small number statistics. However, since conclusions from Habing et al. (2001) and Spangler et al. (2001) were not totally consistent, ISO was unable to provide a clear picture for the evolution of debris disks.
Fortunately, Spitzer’s unprecedented sensitivity has recently allowed many studies of large samples of pre-MS and MS stars in the mid- and far-IR. These studies are rapidly providing important clues on the evolution of debris disks. Rieke et al. (2005) studied over 250 A-type stars and concluded that, even though the incidence of 24 m excess clearly decreases with increasing stellar age, a very large dispersion on the magnitude of the IR-excesses is seen at every age. Su et al. (2006) finds that A-type stars show a similar qualitative behavior at 70 m. However, at this wavelength, the IR excess declines more slowly with time than at 24 m. The decay timescale is estimated to be 150 Myr for the 24 m excess and 850 Myr for the 70 m excess. Trilling et al. (2007) studied field FGK-type stars and found that 4 and 16 of them show detectable IR excesses at 24 and 70m, respectively. These disk frequencies are roughly a factor of two lower than those found for A-type stars at the same wavelengths. They also find that solar-type stars have an almost constant disk frequency beyond 1 Gyr and hence conclude that the their debris disk decay timescale is significantly larger than for A-type star. Gautier et al. (2007) studied a sample of nearby M-type stars but detected no significant far-IR excesses. However, given the sensitivity of their survey, they conclude that the average MIPS excesses, measured in photospheric flux units, of the M-type stars are at least a factor of four lower than those of solar-type stars
The Spitzer study of the Hyades presented in this paper is intended to provide additional clues by giving robust statistics on the frequency of debris disks at 625 Myr of age for a homogeneous sample of MS stars. At 46 pc, the Hyades is the nearest star cluster to the Sun, and represent a sample of stars formed at the same epoch with the same heavy element abundance () (Paulson et al., 2003).
The 625 Myr age of the Hyades places them at an extremely interesting era in the evolution of planetary systems. This age corresponds almost exactly to the era of the late heavy bombardment (LHB) in our Solar System about 3.9 Gyrs ago (Tera et al., 1973). The cratering record of the Moon, Mars, and Mercury all indicate that the inner planets experienced intense bombardment by large bodies at that time. There is still intense debate as to whether the LHB represented merely the end of an exponential decrease in the impact rate from the formation of the terrestrial planets (Wetherill, 1975, 1977; Neukum & Ivanov, 1994), or was instead a short intense spike in the bombardment rate when the Solar System was about 600 Myr old (Ryder, 1990; Cohen, 2002). In either case, the LHB of our Solar System clearly indicates that at an age of 600 My there was still a major debris disk present that was undergoing a rapid evolution. Large, asteroid-size bodies had been built up during the early planet building era, but not all of these bodies had been incorporated into the planets. At the time of the LHB, these bodies were undergoing an era of significant collisions with the inner planets, and presumably with each other as well. These collisions would have generated large amounts of smaller particles, ranging all of the way down to dust particles. If most planetary systems go through a LHB-type event at a similar age, it is quite reasonable to assume that other stellar systems might have also similar remnant debris disks at 600 Myr of age. However, it has been recently argued that events such that of the LHB can be triggered by sudden dynamical interactions between planets after a long quiescent period of time (Gomes et al. 2005). In that case, the incidence of debris disks on Hyades members is not expected to be significantly different from that of stars that are somewhat older (or younger) than them.
Here, we analyze deep MIPS 24 and 70 m observations for a sample of 78 Hyades stars, enough to provide robust statistics on the status of debris disks at 625 Myr of age. In Section 2, we describe the sample of Hyades stars, our observations, and the data reduction procedures. In Section 3, we establish our disk identification criteria and present our detection statistics. In Section 4, we compare our detection statistics to recent Spitzer results, use our sensitivity limits and debris disk models to constrain the maximum mass of dust that could remain undetected around our targets, and discuss the implications of our results for debris disk evolution models and the late heavy bombardment in the Solar System.
2 Observations
2.1 Spitzer Sample and Observations
The majority of the 78 targets discussed in this paper were observed at 3.6, 4.5, 5.8 and 8.0 m with the Infrared Array Camera (IRAC) and at 24, 70, and 160 m with the Multiband Imaging Photometer for Spitzer (MIPS) as part of our General Observer (GO) program 3371. This program contains 45 FGK-type Hyades members from the high-precision radial velocity (RV) survey discussed by Cochran et al. (2002) and Paulson et al. (2004). We have also included MIPS 24 and 70 m observations of Hyades members from the FEPS Spitzer Legacy Project (PID=148, 21 FGK-type stars), and two Guaranteed Time Observation (GTO) programs (PID=40, 11 A-type stars and PID = 71, 1 K0 star). Even though the MIPS photometry for some of the targets has already been discussed in the context of their respective programs (Su et al., 2006; Meyer et al., 2006), we have retrieved the MIPS data from the Spitzer archive and processed them ourselves for consistency. The Astronomical Observation Requests (AORs) keys, Program IDs, spectral types from the literature, and near-IR photometry (from 2MASS) for our entire sample of Hyades stars are listed in Table 1.
Given the extreme near-IR brightness of the sample, the IRAC observations of our GO program were acquired in the subarray mode (e.g., 0.02 sec 64 frames). The IRAC data were requested to try to better constrain the stellar photospheres of our targets; however, they did not fulfill their intended purpose and were not utilized in our study (see Section 3.1). All the MIPS observations discussed in this paper were obtained using the MIPS pointed imaging mode. At 24 m, 1 or 2 cycles of 3-sec frames were enough to detect the stellar photospheres of the entire sample with high signal to noise ratio (S/N 40). At 70 m, the observations were designed for the 1- detector sensitivities to match the predicted stellar photospheres of the targets. Thus, in the absence of background noise, an IR excess 4 times larger than the photospheric flux would be detected at a 5- level. However, at the distance of the Hyades, the 70 m photospheric emission of most FGK-type stars falls below the extragalactic confusion level (see Section 3.2) and the observations become background limited beyond 24 m for most of the sample.
2.2 Data Reduction
We processed the IRAC data (available only for the GO program 3371) and MIPS 24 m data using the mosaicing and source extraction software c2dphot, which was developed as part of the the Spitzer Legacy Project “From Molecular Cores to Planet Forming Disks” Evans et al. (2006). This program is based on the mosaicking program MOPEX (MOsaicker and Point source EXtractor), developed by the Spitzer Science Center (SSC) and on the source extractor program DoPHOT (Schechter et al., 1993). The IRAC and MIPS 24 m measurements for our entire sample are listed in Tables 2 and 3, respectively.
For the 70 m and 160 m data, we used MOPEX to create mosaiced images. We started from the SSC pipeline version S14.4 of the median-filtered BCDs (basic calibrated data), which are optimized for point-source photometry. For each source, we created two versions of the 70 m mosaic, one resampled to 8 pixels (close to the original size of the pixels in the detector) and the other resampled to 4 pixels. We used the former to obtain the aperture photometry and the latter to visually inspect the images for background contamination (See section 3.2). The 160 m data were resampled to mosaics with 16 pixels.
For the 70 m data, we use an aperture of 16 in radius and a sky annulus with an inner and an outer radius of 48 and 80, respectively. From high S/N 70 m point source observations we derive a multiplicative aperture correction, , of 1.8. This AC is in good agreement with the 1.74 value suggested by the Spitzer Science Center for observations with the same aperture size and similar sky annulus111See htt/ss.spitzer.caltech.edu/mips/apercorr.. Thus, we calculate the observed flux, F70, as F70=FA, where FA70 is the flux within the aperture. We estimate the 1- photometric uncertainty as RMSSKY , where is the flux RMS of the pixels in the sky annulus, and is the number of pixels in our aperture. The 70 m measurements for our entire sample are listed in Table 3. For the 160 m data, we used an aperture with a radius of 32 and a sky annulus with an inner and an outer radius of 48 and 80, respectively. The fluxes and uncertainty were calculated in the same way as for the 70 m data, but adopting an aperture correction of 2.0, appropriate for the size of the aperture and sky annulus used4. The 160 m measurements for the entire sample of FGK-type stars from program ID=3371 are also listed in Table 3 (the 160 m data are not available for the Hyades stars from the other programs).
3 Results
3.1 MIPS 24 m results
At 24 m, all of our targets are detected with very high signal to noise ratios (S/N 50-300). In order to establish whether or not our targets show IR-excess at a given wavelength, we first need to estimate the expected photospheric fluxes at that wavelength. We do so by normalizing NextGen Models (Hauschildt et al., 1999), corresponding to published spectral types of our Hyades stars, to the near-IR data from 2MASS listed in Table 1. We decided not to include the IRAC data in the normalization of the stellar photospheres for two reasons. First, the IRAC data are only available for the stars from program 3371, and second because we found that including IRAC fluxes does not provide a better photospheric constraint than using the 2MASS data alone. This is probably because, even for bright sources with formal errors 1, there is a random error floor to the best uncertainty possible with our IRAC and MIPS 24 m observing techniques and data reduction process of 0.05 mag (Evans et al. 2006). The IRAC photometry for all the targets in our GO program 3371 is presented for completeness only (see Table 2). The expected 24 m photospheric fluxes for our entire sample, obtained as described above, are listed in Table 3.
The magnitude of the smallest 24 m excess emission that we can identify depends on both the uncertainty of our photometry and on our ability to predict the photospheric flux. In Figure 1, we plot the distribution of observed 24 m fluxes relative to predicted photospheric fluxes. After excluding a single outlier, this distribution can be characterized as a Gaussian distribution with a mean of 0.99 and a 1- dispersion of 0.06. The mean of the distribution is consistent with the absolute Spitzer calibration uncertainty at 24 m. The dispersion of the distribution is identical to that found by Bryden et al. (2006) for FGK-type field stars, smaller than that obtained by Beichman et al. (2007) for FGK, and M stars, and only slightly larger than the uncertainty floor of 0.05 mag expected for 24 m photometry obtained with c2dphot (Evans et al. 2006). However, we note that our 1- dispersion in the distribution of measured to predicted flux ratios is significantly larger than the 0.03 mag value achieved by Su et al. (2006) for A-type stars and by Thrilling et al. (2007) for FGK-type stars. Based on the analysis of Figure 1, we conclude that only one of the Hyades stars in our sample shows a significant ( 3-) 24 m excess. This object is HD28355, an A-type star that was already identified by Su et al. (2006) as having a debris disk. According to the values listed in Table 3, we find that the 24 m flux of HD28355 is 1.24 times the expected photospheric level, in good agreement with the 1.27 value found by Su et al. (2006).
3.2 MIPS 70 m results
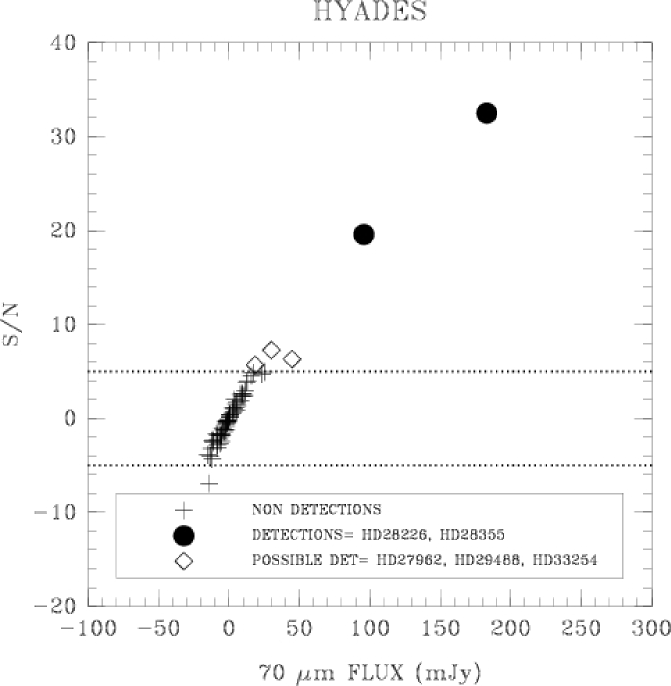
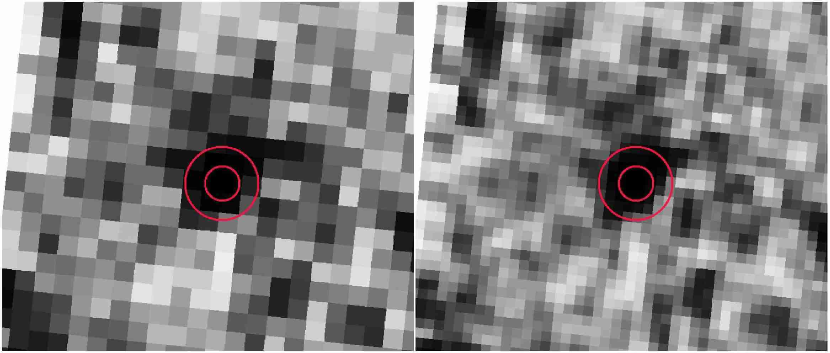
By extrapolating the predicted 24 m photospheric fluxes, listed in Table 3, we estimated the fluxes of the stellar photosphereres that are expected at 70 m. These predicted 70 m photospheric fluxes are also listed in Table 3. Unlike at 24 m, the expected photospheric flux at 70 m of all our solar-type Hyades stars is at or below the noise of the observations. This noise is dominated by the sky pixel to pixel variations due to extragalactic source confusion and cirrus contamination. Bryden et al. (2006) present a detailed analysis of the sources of noise in deep 70 m observations. They analyze the noise of images constructed by combining an increasing number of cycles (each cycle consisting of ten 10-sec frames). They show that beyond 4 cycles (a total exposure time of 400 sec), the total noise becomes dominated by the extragalactic background noise. The low spatial resolution of Spitzer, combined with the high instrumental sensitivity of MIPS, implies a high incidence of extragalactic sources per beam. This extragalactic source confusion sets a firm limit (1- 2 mJy) to the sensitivity that can be achieved with MIPS at 70 m. This limit can not be reduced with longer integration times. Any contamination from galactic cirrus decreases the sensitivity that can be achieved at any given field. Most of the 70 m observations discussed in this paper amount to at least 500 sec (and up to 1200 sec in many cases) and hence can be characterized as “background limited”. Since the background noise is highly non-Gaussian, a simple 3- threshold is inappropriate to prevent spurious detections. Thus, the first step in our analysis is to establish a different detection criterion. In Figure 2, we plot the signal to noise ratio as a function of the measured 70 m flux. We find that a similar number of negative and positive fluctuations exist at the 5- level; therefore, we consider objects with S/N ratios 5 to be non-detections. We find that only two objects, HD28266 and HD28355, are unambiguously detected. In order to establish that the 70 m emission is in fact associated with the Hyades targets, we inspect their mosaics, shown in Figure 3, and verify that the emission is centered on the targets. HD28266 and HD28355 are both A-type stars, which have been already identified by Su et al. (2006) as having a debris disk. As mentioned in Section 3.1, HD28355 also shows significant 24 m excess.
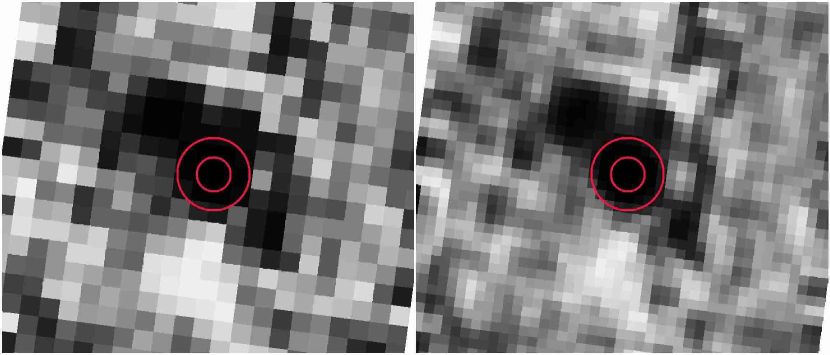
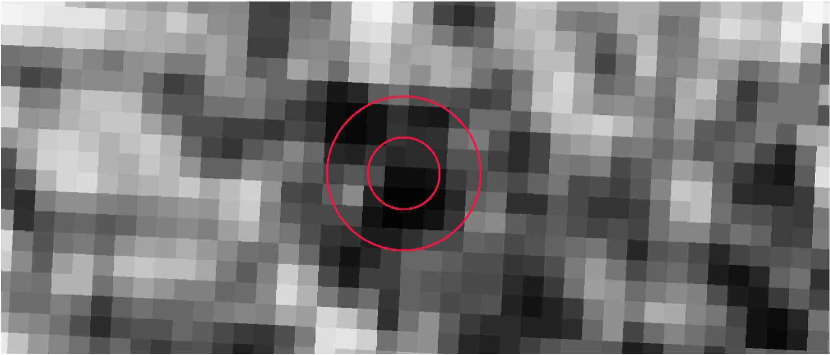
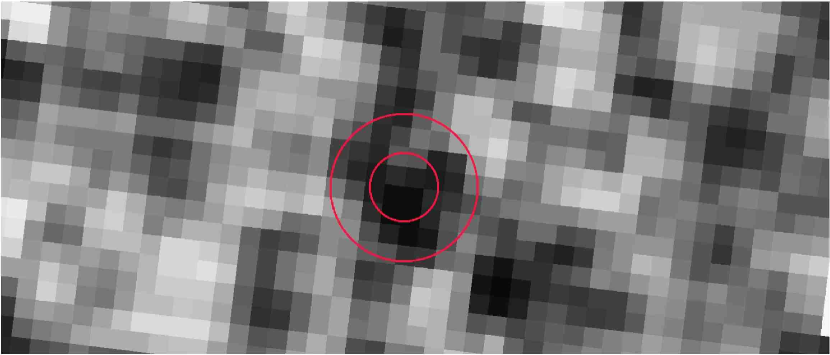
Three objects, HD27962, HD29488, and HD33524, have S/N just above 5. We consider these objects to be possible detections that need further consideration. We inspect their high resolution (4 pixel) mosaics (Figures 4 and 5) to establish the spatial distribution of the 70 m emission. In the three cases we find that even though there seems to be a source near the aperture, there is a significant offset (10-15) between the center of the 70 m emission and the location of the Hyades target. Therefore, we conclude that the 70 m emission within these apertures are likely to be due to background contamination.
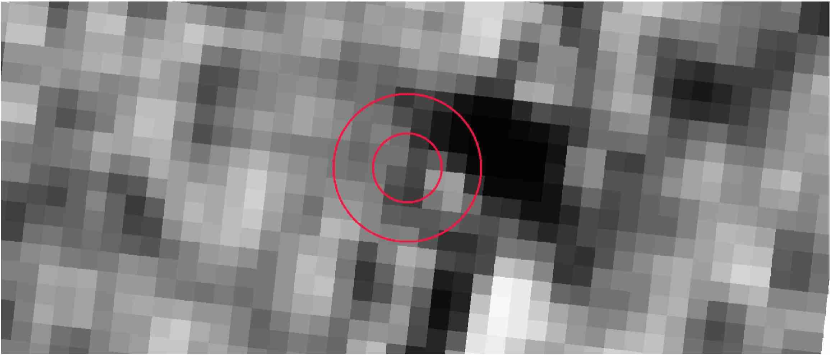
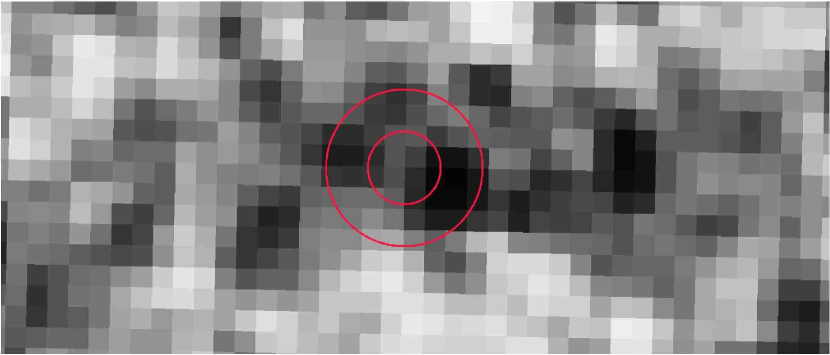
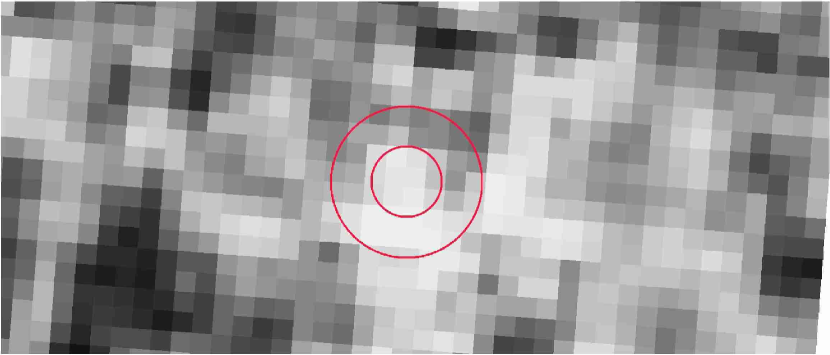
We note that one of these objects, HD33524, has been identified by Su et al. (2006) as having a weak 70 m excess. For this object, they report a 70 m flux of mJy as opposed to our 5 mJy (i.e., the fluxes agree very well within the uncertainties). A similar situation occurs for HD28527. Su et al. (2006) report a 70 m flux of mJy, which also is in relative agreement with our measurement (within ). However, since the 70 m emission does not seem to be centered at the target (Figure 5), we do not consider this detection to be real either. An independent reanalysis and inspection of the 70 m data of HD 33254 and HD 28527 confirms that the 70 m fluxes within the apertures are no likely to be associated with the Hyades stars (Su 2008, private communications). Our conservative detection criterion is also supported by the presence of negative background fluctuations at the - level at the location of some of the targets, such as HD28430 shown in Figure 6.
We conclude that none of the 67 FGK-type Hyades stars in our sample are detected at 70 m, while 2 of the 11 A-type stars are. The measured 70 m fluxes for these two objects, HD28266 and HD28355, are 13.9 and 11.5 times the values predicted for their respective photospheres (see Table 3). We attribute these excesses, as Su et al. (2006) did, to the presence of debris disks around both of these sources.
3.3 MIPS 160 m results
At 160 m, the expected photospheric levels are significantly below the noise of the observations (which are only available for the 45 FGK-type stars from the program ID=3371). In order to establish the detection of any of our targets, we follow the same approach as for the 70 m data. In Figure 7, we plot the the signal to noise ratio as a function of the measured 160 m flux. As for the 70 m observations, we find that a similar number of negative and positive fluctuations exist at the 5- level; therefore, we considered all the 160 m measurements to be non-detections.
4 Discussion
4.1 Comparison to Recent Spitzer Results
Recent Spitzer surveys have provided robust statistics on the debris disk frequencies around nearby stars against which our results can be compared. In order to make more meaningful comparisons, we divide the sample into FGK-type stars (67 objects) and A-type stars (11 objects). There are two motivations for doing so. First, most of the previous studies are restricted to either one of these groups. Second, given the strong luminosity dependence on spectral type, the 70 m observations are sensitive to much smaller 70 m excesses (in units of photospheric fluxes) and values for A-type stars than for FGK-type stars.
4.1.1 FGK-type vs A-type stars
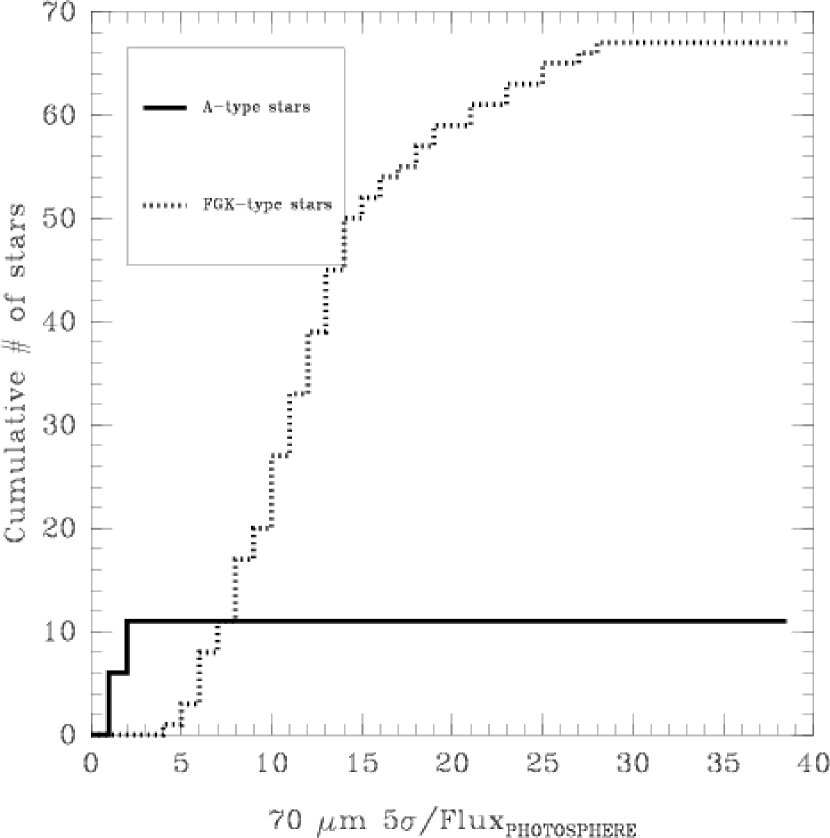
To estimate the sensitivity difference between the 70 m observations of A-type stars and FGK-type stars, we calculate the ratio of 5 times the flux uncertainties to the estimated photospheric values (from Table 3). A cumulative histogram of this ratio is shown in Figure 8 for FGK and A-type stars. For A-type stars, the 70 m observations can detect fluxes that are 1-2 those of the expected photospheres. However, for most of the FGK-type stars, the 70 m observations are only sensitive enough to detect fluxes that are 15 the expected photospheric values. As discussed in Section 3.2, this sensitivity limitation is mostly due to the fact that the stellar photospheres of solar-type stars, at the distance of the Hyades, fall below the 70 m extragalactic confusion limit for MIPS (1- 2 mJy, Bryden et al. 2006).
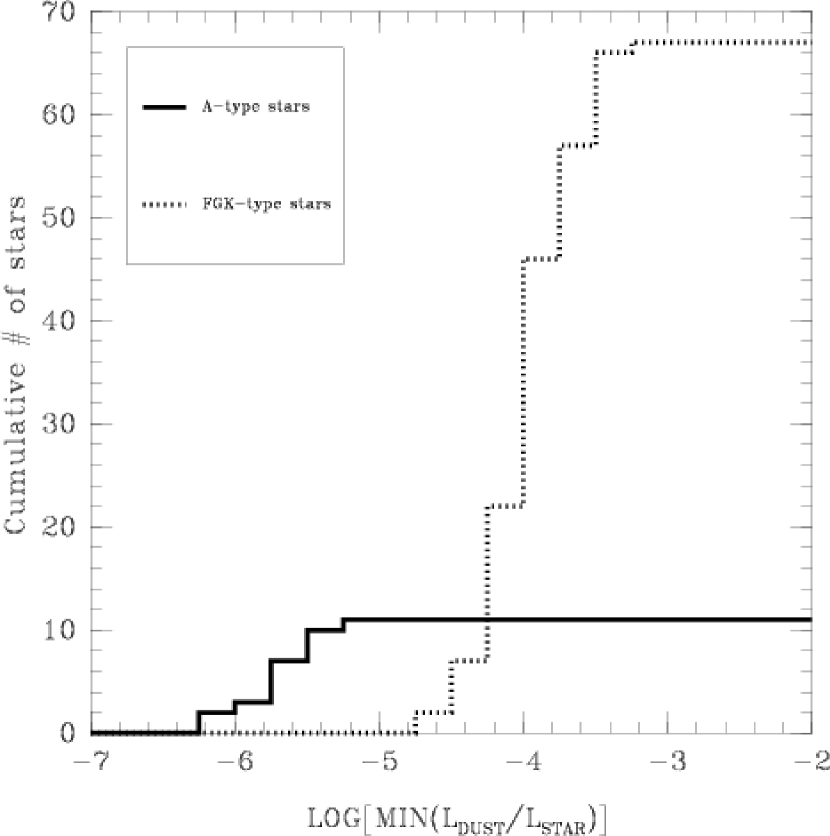
The difference in 70 m sensitivity is even larger when it is calculated in terms of minimum detectable disk luminosity, . Following Bryden et al. (2006), we calculate minimum disk luminosity as a function of 70 m excess flux by setting the emission peak at 70 m (T, according to:
| (1) |
where is the flux of the dust and is the flux of the stars, both at 70 m. By setting , we calculate the minimum values that are detectable for A-type and FGK-type stars. The results are shown in Figure 9, which demostrates that the 70 m observations of A-type stars are sensitive enough to detect disk with values in the 10-6-10-5 range. However for most of the FGK-type stars, the 70 m observations are only sensitive enough to detect disks with 1-210-4. We also use equation 1 to estimate values of 3.410-5 and 4.710-5 for the debris disks around HD28226 and HD28355, respectively. Since there are only 2 FGK-type objects for which the 70 m observations are sensitive enough to detect disks fainter than 10-5, we conclude that the difference in the detection rate of debris disks around A-type stars and FGK-type stars is the result of a sensitivity bias rather than a real effect.
4.1.2 Comparison to FGK-type field stars
Bryden et al. (2006) present 24 and 70 m observations for 69 FGK nearby (distance 10-30 pc) field stars with a median age of 4 Gyrs. They find 24 m excess around only one of their targets. This is consistent with the 24 m excess rate of 0 we find for our 67 FGK-type stars. At 70 m, they identify 7 debris disks. This excess rate (10), if taken at face value, seems inconsistent with our results. However, given the smaller distances to the stars involved, their survey was more sensitive than ours to faint disks. Since the stellar photospheres of their targets are above the 70 m confusion limit of MIPS, they were able to detect the stellar photosphere of most of them and identify very faint disks (). They also find that the disk frequency increases from 2 for disks with to for disks with . Recent results by Trilling et al. (2008) confirm that the frequency of debris disks with around solar type stars is 2.
Figure 9 shows that there are only 22 objects for which our 70 m observations are sensitive enough to detect a debris disk with . We use binomial statistics to show that if the incidence of disks brighter than is in fact 2% as found by Bryden et al. (2006) and Trilling et al. (2007), there was a 26 probability that our survey would find zero disks. Also, given the cumulative distribution of sensitivities shown in Figure 9, we use binomial statistics to calculate the minimum disk frequencies, as a function of , that would be excluded at the 1- and 2- level (i.e., the disk frequencies that would give our survey a 32% and 5% chance to result in zero detections). These disk frequencies are tabulated in Table 4.
Based on the statistics for disks with , Table 4 suggests that a debris disk fraction in the Hyades 2.5 and 6 times larger than in the field can be excluded at the 1- and 2- level, respectively. Thus, we conclude that the debris disk fraction of the FGK-type Hyades stars (age 625 Myr) is consistent with that in the field (age 4 Gyrs), but that 6 higher values cannot excluded from the currently available data.
4.2 Comparison to debris disk models
In this section, we use the debris disk model developed by Augereau et al. (1999) to constrain the location and mass of the circumstellar material around HD 28266 and HD 28355, the two A-type stars identified in section 3.2 as having real 70 m excesses. We also use this model to estimate the maximum encompassed mass of dust, as a function of distance from the stars, that could remain undetected around the A-type and FGK-type stars in our sample that do not show significant IR excesses.
4.2.1 The debris disks around HD 28266 and HD 28355
We limit the exploration of the parameter space to the disk parameters that affect most the global shape of an SED, namely the minimum grain size , the peak surface density position and the total dust mass (or, equivalently, the surface density at ). We adopted a differential grain size distribution proportional to between and , with m, a value sufficiently large to not affect the SED fitting in the wavelength range we consider. Following Augereau et al. (1999), the disk surface density is parametrized by a two power-law radial profile with , and where and to simulate a disk peaked around , with a sharp inner edge, and a density profile decreasing smoothly with the distance from the star beyond . The optical properties of the grains were calculated for astronomical silicates (optical constants from Weingartner Draine (2001)), and with the Mie theory valid for hard spheres. The grain temperatures were obtained by assuming the dust particles are in thermal equilibrium with the central star. NextGen model atmosphere spectra (Hauschildt et al. 1999) scaled to the observed K-band magnitudes, were used to model the stellar photospheres.
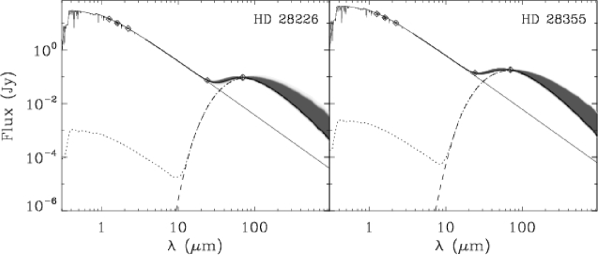
For each of the stars with 70 m excess, HD 28266 and HD 28355, we calculated SEDs (mm), for , logarithmically-spaced values of between m and m, and for values of , logarithmically-spaced between AU and AU. For each model, the dust mass was adjusted by a least-squares method, assuming purely photospheric emission in the 2MASS bands and by fitting the measured MIPS m and m flux densities. The results are summarized in Table 5, and the SEDs are displayed in Figure 10. Results in Table 7 are listed for two different regimes of minimal grain sizes, namely, 10 m and 0.5 m in order to illustrate the strong dependence of and Mdust on the assumed grain size distribution.
Even though neither the position of the peak surface density , nor the minimum grain size , can be uniquely determined with so few observational constraints, some models can be eliminated. In particular, given the large luminosity of A-type stars, the small or nonexistent excess at 24 m implies that the disks of HD 28226 and HD 28355 are significantly dust-depleted within at least 40 AU from the star. However, “inner-holes” larger than 300 AU can not be excluded if very small grains are present (i.e., amin 0.5 m). Similarly, even though the best-fit disk models imply dust masses of the order 10-2M⊕, disk masses 0.1M⊕ could be accomodated for both stars.
4.2.2 Limits on dust masses as a function of radius
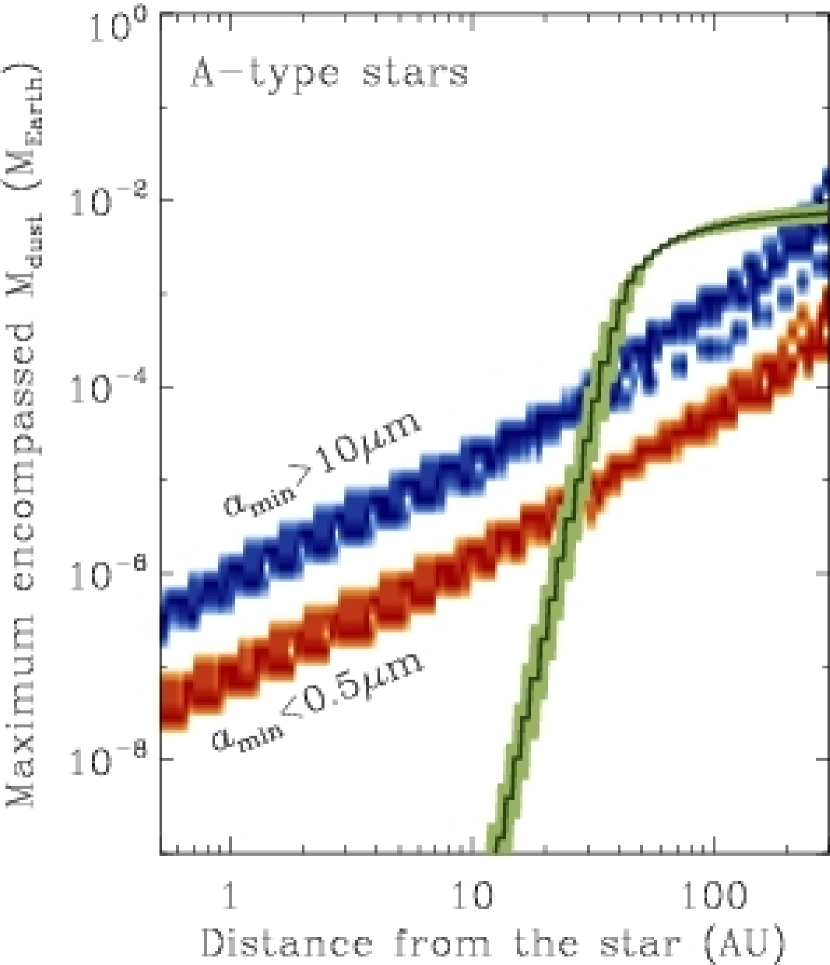
In section 4.1.1, we found that the 70 m observations of the Hyades were sensitive to significantly lower fractional disk luminosities for A-type stars than for FGK-type stars. However, since the 70 m observations probe larger radii around A-type stars than around FGK-stars, this implies that the mass of the grains needed to produce a given fractional luminosity, as calculated in section 4.1.1, is larger around A-type stars than it is around FGK-type stars (see Gautier et al. 2007 for a discussion of origin of the dependence of dust mass sensitivity on stellar luminosity). Therefore, the degree to which the MIPS observations are sensitive to smaller amounts of dust around A-type stars than around FGK-type stars is not immediately obvious. In order to explore this last point, we estimate the maximum encompassed mass of dust, as a function of distance from the stars, that could remain undetected around the A-type and FGK-type stars in our sample that do not show significant IR excesses.
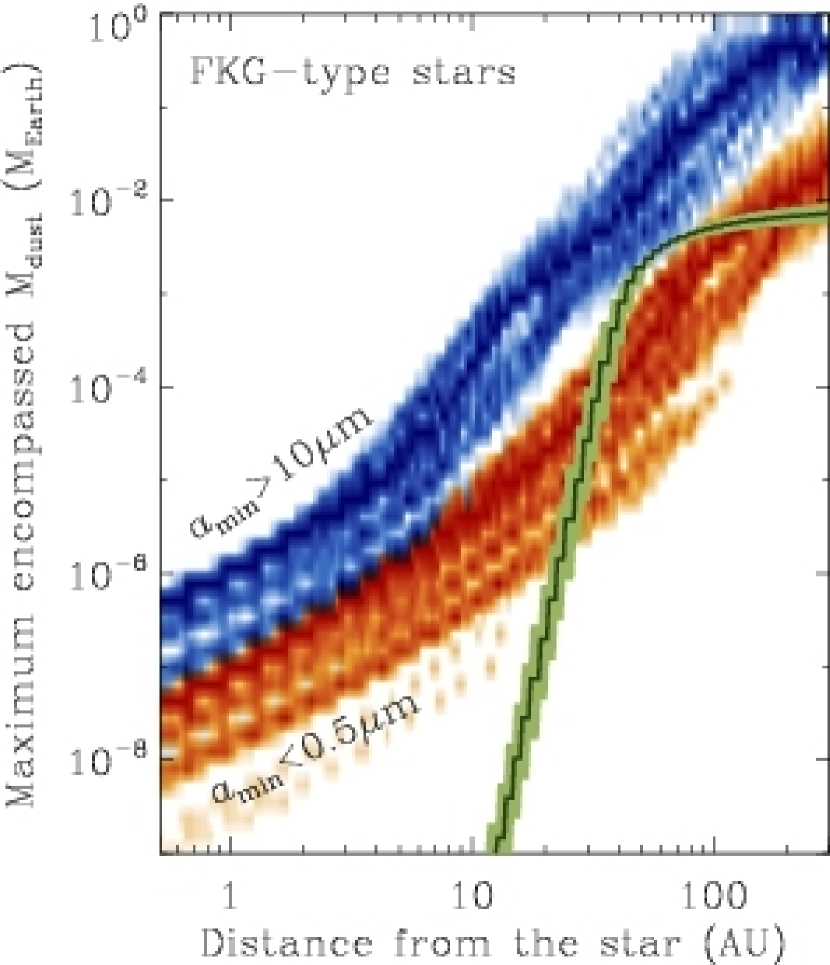
Following Cieza et al. (2007), we use the optically thin disk models discussed above to constrain the maximum amount of dust that could be present within 300 AU of the A-type and FGK-type stars in our sample. Using the 70 m 5- upper limits (and the 160 m limits, when available), we calculated models analogous to those calculated for HD 28266 and HD 28355 for each of the stars in our sample. For each model, we calculated the mass encompassed within a radius , as a function of this radius. With this approach, we estimate the maximum dust mass in the circumstellar regions of the Hyades stars with no detectable emission in excess to the photospheric emission. The results for A-type and FGK-type stars, for two different minimal grain size regimes (amin 10 m in blue and amin 0.5 m in red), are shown in Figure 11. This figure shows that the absence of IR excess at 24 and 70 m constrains the total mass of dust within 10 AU of the solar type stars to be 10-4 MEarth. This limit is an order of magnitude lower for A-type stars. The range of encompassed dust masses as a function of radius for the best-fit disk models of HD 28355 corresponding to the case where amin 10 m is shown for comparison (green region). The fact that, for FGK-type stars, the green region lies below the blue region (i.e., the case corresponding to the same grain size distribution), implies that disks similar to that found around HD 28355 would not be detectable by our observations if they were also present around the FGK-type Hyades members. Given the similarities of the inferred disk properties of HD 28355 and HD 28266 (see Table 5), the same conclusion applies for HD 28266. Thus, Figure 11 strengthen our conclusion from section 4.1.1 stating that the difference in detection rate of debris disks around A-type and FGK-type stars is due to a sensitivity bias rather than to a real difference in the incidence or properties of debris disks around stars of different spectral types.
4.3 Debris disk evolution and the Late Heavy Bombardment
4.3.1 Steady State vs. Stochastic Evolution
Rieke et al. (2005) studied a sample of 266 A-type stars with Spitzer, ISO, or IRAS 24 m/25 m data. They used this very large sample to establish statistically significant trends of IR-excess with age. They find that: (1) at all ages, the population is dominated by stars with little or no IR excess, (2) stars with a wide range of excesses are seen at every age, and (3) both the frequency and the magnitude of the IR excess decreases with time. In particular, they find that the upper envelope of the evolution of the excess ratio with time can be fitted by , with 150 Myr. Similar trends are seen in the 70 m excesses of A-type stars (Su et al., 2006), with the difference that the decay time seems to be considerably larger, 400 Myr, suggesting inside-out disk clearing.
Based on these results, Rieke et al. (2005) argue that the evolution of debris disks is the convolution of a stochastic and a steady component. They suggest that, at any given age, the debris disks detected are those that have experienced large planetesimal collisions in the recent past. This stochastic evolution is on top of steady decrease in the number of parent bodies in the belts of planetesimals where the dust is produced, which would explain the overall decrease of IR excess with age. However, it has also been argued that a stochastic component in the evolution of debris disk is not necessary to explain the diversity of disk properties observed at a given age. Wyatt et al. (2007b) construct a simple collisional model, where the mass of planetesimals is constant until the largest ones reach collisional equilibrium, at which point mass falls as 1/time. They propose that the large spread in IR properties observed at any given age can be explained in terms of the initial distributions of masses and temperatures of the planetesimal belts producing the dust. They argue that their simple model can account for the 24 and 70 m statistics presented by Rieke et al. (2005) and Su et al. (2006) using realistic belt parameters, and thus that transient events are not required to explained the observations. Given the limited observational constraints available, the models presented by Wyatt et al. (2007b) do not rule out the possibility that stochasticity plays an important role in the evolution of most debris disks. Our results could provide additional constrains to these kinds of models because, unlike the studies by Rieke et al. (2005) and Su et al. (2006), our study provides robust statistics for the debris disks at a single, well defined age.
4.3.2 Implications for the Late Heavy Bombardment in the Solar System
The 625 Myr age of the Hyades corresponds almost exactly to the era of the late heavy bombardment (LHB, Tera et al., 1973; Gomes et al., 2005). Thus, if the Solar-type (FGK) Hyades stars resemble the Sun at 625 Myr of age, our statistics could provide valuable clues on this important event in the history of the Solar System.
The cause and the duration of the LHB is still a matter of debate. Proposed causes for a intense spike in the impact rate include the formation of Uranus and Neptune (Levison et al., 2001), the presence of a fifth terrestrial planet in a low-eccentricity orbit which became dynamically unstable at an age of about 600 Myr (Chambers & Lissauer, 2002), or impacts by bodies left over from planetary accretion (Morbidelli et al., 2001). More recently, Gomes et al. (2005) propose that the LHB was triggered by the sudden migration of the giant planets that occurred after a long quiescent period of time. In their model, soon after the dissipation of the solar nebula, the orbits of Jupiter and Saturn started to slowly diverge due to the interaction with the massive disk of planetesimals that was still present. They argue that 700 Myr later, when Jupiter and Saturn crossed their 1:2 mean motion resonance, their orbits became eccentric and temporally destabilized those of Uranus and Neptune. The reconfiguration of the orbits of the giant planets resulted in the perturbation and massive delivery of planetesimals to the inner Solar System, which according to their models, lasted between 10-150 Myr.
The observational signatures of a LHB-type event as seen from a distance of 46 pc are not known, but it as been suggested that they could be those of a family of rare Solar-type stars characterized by the presence of a bright “hot disk” around an object hundreds of million years old. These objects present excess IR emission, originating in the terrestrial planet regions, with , a level that is times larger than steady state evolution models can explain (Wyatt et al., 2007a). There are currently only 5 known objects that fall into this category of “hot transient disks”: BD +20 307 (age 300 Myr, Song et al., 2005), HD72905 (age 400 Myr, Beichman et al., 2006)), Corvi (age 1 Gyr, Wyatt et al., 2005), HD69830 (age 2 Gyr, Beichman et al., 2005), and Ceti (age 10 Gyr, Di Folco et al. 2007) which represent 2 of all the Solar-type stars surveyed. If this group of objects corresponds to those that are currently experiencing events similar to the LHB and the Hyades stars resemble the Sun at 625 Myr of age, then the fact that none of the 67 Solar-type stars in our Hyades sample has a “hot transient disk” implies one of two possibilities: (1) the likelihood of an event similar to the LHB is not significantly higher at 625 Myr than it is at any other age, or (2) events like the LHB are very short spikes with a duration much closer to the lower limit of 10 Myr suggested by Gomes et al. (2005) than to their 150 Myr upper limit. If the likelihood of a LHB-type event is approximately constant with time, then a 2 incidence in the Solar neirghborwood (median age 4000 Myr) would imply a total duration of 80 Myr. However, if such an event is more likely to occur around an age of 625 Myr, then our non detections would only be consistent with a much shorter duration. Thus, the implication of our results on the LHB could depend on the age distribution of these “hot transient disks”, which still remains largely unconstrained since only 5 of such examples are currently known. Fortunately, as more Spitzer observations are reported, this distribution will become better constrained.
Understanding the debris disk phenomenon has been a high priority of the Spitzer’s mission. As a result, the number of debris disk studies has increased dramatically over the last few years. Each of these studies is providing new clues and constraints, from which it will eventually emerge a much clearer picture of the evolution of debris disks and its connection to the history of the Solar System.
References
- Augereau et al. (1999) Augereau, J. C., Lagrange, A. M., Mouillet, D., Papaloizou, J. C. B., & Grorod, P. A. 1999, A&A, 348, 557
- Aumann et al. (1984) Aumann, H. H., Beichman, C. A., Gillett, F. C., de Jong, T., Houck, J. R., Low, F. J., Neugebauer, G., Walker, R. G., & Wesselius, P. R. 1984, ApJ, 278, L23
- Beichman et al. (2005) Beichman, C. A., Bryden, G., Rieke, G. H., Stansberry, J. A., Trilling, D. E., Stapelfeldt, K. R., Werner, M. W., Engelbracht, C. W., Blaylock, M., Gordon, K. D., Chen, C. H., Su, K. Y. L., & Hines, D. C. 2005, ApJ, 622, 1160
- Beichman et al. (2006) Beichman, C. A., Bryden, G., Stapelfeldt, K. R., Gautier, T. N., Grogan, K., Shao, M., Velusamy, T., Lawler, S. M., Blaylock, M., Rieke, G. H., Lunine, J. I., Fischer, D. A., Marcy, G. W., Greaves, J. S., Wyatt, M. C., Holland, W. S., & Dent, W. R. F. 2006, ApJ, 652, 1674
- Beichman et al. (2007) Beichman, C. A., Fridlund, M., Traub, W. A., Stapelfeldt, K. R., Quirrenbach, A., & Seager, S. 2007, in Protostars and Planets V, ed. B. Reipurth, D. Jewitt, & K. Keil, 915–928
- Bryden et al. (2006) Bryden, G., Beichman, C. A., Trilling, D. E., Rieke, G. H., Holmes, E. K., Lawler, S. M., Stapelfeldt, K. R., Werner, M. W., Gautier, T. N., Blaylock, M., Gordon, K. D., Stansberry, J. A., & Su, K. Y. L. 2006, ApJ, 636, 1098
- Cieza et al. (2007) Cieza, L., et al. 2007, ApJ, 667, 308
- Chambers & Lissauer (2002) Chambers, J. E., & Lissauer, J. J. 2002, in LPI Conference Abstracts, 1093
- Cochran et al. (2002) Cochran, W. D., Hatzes, A. P., & Paulson, D. B. 2002, AJ, 124, 565
- Cohen (2002) Cohen, B. A. 2002, in LPI Conference Abstracts, 1984
- Di Folco et al. (2007) Di Folco, E., et al. 2007, A&A, 475, 243
- Evans et al. (2003) Evans, N. J., et al. 2003, PASP, 115, 965
- Evans et al. (2006) Evans, N. J., Harvey, P. M., Dunham, M. M., Mundy, L. G., Lai, S., Chapman, N., Huard, T., Brooke, T. Y., & Koerner, D. W. 2006, Delivery of Data from the c2d Legacy Project: IRAC and MIPS (Pasadena,SSC), Pasadena, SSC, http://ssc.spitzer.caltech.edu/legacy/original.html
- Gautier et al. (2007) Gautier, T. N., III, et al. 2007, ApJ, 667, 527
- Gomes et al. (2005) Gomes, R., Levison, H. F., Tsiganis, K., & Morbidelli, A. 2005, Nature, 435, 466
- Habing et al. (2001) Habing, H. J., Dominik, C., Jourdain de Muizon, M., Laureijs, R. J., Kessler, M. F., Leech, K., Metcalfe, L., Salama, A., Siebenmorgen, R., Trams, N., & Bouchet, P. 2001, A&A, 365, 545
- Hauschildt et al. (1999) Hauschildt, P. H., Allard, F., & Baron, E. 1999, ApJ, 512, 377
- Levison et al. (2001) Levison, H. F., Dones, L., Chapman, C. R., Stern, S. A., Duncan, M. J., & Zahnle, K. 2001, Icarus, 151, 286
- Meyer et al. (2006) Meyer, M. R., Hillenbrand, L. A., Backman, D., Beckwith, S., Bouwman, J., Brooke, T., Carpenter, J., Cohen, M., S. Cortes, S., Crockett, N., Gorti, U., Henning, T., Hines, D., Hollenbach, D., Kim, J. S., Lunine, J., R. Malhotra, E. M., Metchev, S., Moro-Martin, A., Morris, P., Najita, J., Padgett, D., Pascucci, I., Rodmann, J., Schlingman, W., Silverstone, M., Soderblom, D., Stauffer, J., Stobie, E., Strom, S., Watson, D., Weidenschilling, S., & S. Wolf, E. Y. 2006, PASP, 118, 1690
- Morbidelli et al. (2001) Morbidelli, A., Petit, J.-M., Gladman, B., & Chambers, J. 2001, Meteoritics and Planetary Science, 36, 371
- Neukum & Ivanov (1994) Neukum, G., & Ivanov, B. A. 1994, in Hazards Due to Comets and Asteroids, 359
- Paulson et al. (2004) Paulson, D. B., Cochran, W. D., & Hatzes, A. P. 2004, AJ, 127, 3579
- Paulson et al. (2003) Paulson, D. B., Sneden, C., & Cochran, W. D. 2003, AJ, 125, 3185
- Rieke et al. (2005) Rieke, G., Su, K. Y. L., Stansberry, J. A., Trilling, D., Bryden, G., Muzerolle, J., White, B., Gorlova, N., Young, E. T., Beichman, C. A., Stapelfeldt, K. R., & Hines, D. C. 2005, ApJ, 620, 1010
- Ryder (1990) Ryder, G. 1990, EOS, 71, 313
- Schechter et al. (1993) Schechter, P. L., Mateo, M., & Saha, A. 1993, PASP, 105, 1342
- Song et al. (2005) Song, I., Zuckerman, B., Weinberger, A. J., & Becklin, E. E. 2005, Nature, 436, 363
- Spangler et al. (2001) Spangler, C., Sargent, A. I., Silverstone, M. D., Becklin, E. E., & Zuckerman, B. 2001, ApJ, 555, 932
- Su et al. (2006) Su, K. Y. L., Rieke, G. H., Stansberry, J. A., Bryden, G., Stapelfeldt, K. R., Trilling, D. E., Muzerolle, J., Beichman, C. A., Moro-Martin, A., Hines, D. C., & Werner, M. W. 2006, ApJ, 653, 675
- Tera et al. (1973) Tera, F., Papanastassiou, D. A., & Wasserburg, G. J. 1973, in LPI Conf. Abstracts, 723
- Trilling et al. (2007) Trilling, D. E., et al. 2007, ArXiv e-prints, 710, arXiv:0710.5498
- Weingartner & Draine (2001) Weingartner, J. C., & Draine, B. T. 2001, ApJ, 548, 296
- Wetherill (1975) Wetherill, G. W. 1975, in Lunar and Planetary Science Conference, 1539
- Wetherill (1977) Wetherill, G. W. 1977, in Lunar and Planetary Science Conference, 1
- Wyatt et al. (2005) Wyatt, M. C., Greaves, J. S., Dent, W. R. F., & Coulson, I. M. 2005, ApJ, 620, 492
- Wyatt et al. (2007a) Wyatt, M. C., Smith, R., Greaves, J. S., Beichman, C. A., Bryden, G., & Lisse, C. M. 2007a, ApJ, 658, 569
- Wyatt et al. (2007b) Wyatt, M. C., Smith, R., Su, K. Y. L., Rieke, G. H., Greaves, J. S., Beichman, C. A., & Bryden, G. 2007b, ApJ, 663, 365
- Yamashita et al. (1993) Yamashita, T., Handa, T., Omodaka, T., Kitamura, Y., Kawazoe, E., Hayashi, S. S., & Kaifu, N. 1993, ApJ, 402, L65
| Star Name | Ra | Dec | MIPS | IRAC | PID | Spectral | J | H | KS |
|---|---|---|---|---|---|---|---|---|---|
| (J2000.0) | (J2000.0) | AOR | AOR | Type | (mag) | (mag) | (mag) | ||
| BD+17 455 | 43.81800 | 17.89170 | 10853888 | 10865152 | 3371 | G7 | 7.56 | 7.21 | 7.18 |
| BD+29 503 | 44.44480 | 29.66140 | 10841856 | 10854400 | 3371 | K0 | 7.38 | 7.00 | 6.91 |
| HD 18632 | 45.01220 | 7.74980 | 10842112 | 10854656 | 3371 | K2 | 6.32 | 5.95 | 5.84 |
| HD 20430 | 49.35990 | 7.65580 | 05403904 | 148 | F8 | 6.29 | 6.05 | 5.99 | |
| BD+07 499 | 50.12200 | 8.45440 | 12289280 | 12288512 | 3371 | K5 | 7.54 | 6.96 | 6.88 |
| BD+23 465 | 53.20890 | 23.69240 | 10842624 | 10855168 | 3371 | K1 | 7.37 | 7.02 | 6.91 |
| HIP 17766 | 57.04970 | 7.14620 | 10843648 | 10856192 | 3371 | K6 | 8.27 | 7.62 | 7.51 |
| BD+23 571 | 57.76320 | 23.90360 | 10843904 | 3371 | K7 | 8.11 | 7.54 | 7.39 | |
| HD 286363 | 58.75610 | 12.48560 | 10854144 | 10856704 | 3371 | K4 | 8.18 | 7.69 | 7.57 |
| HD 285252 | 58.77730 | 16.99840 | 10844160 | 10856960 | 3371 | K2 | 7.41 | 7.04 | 6.91 |
Note. — The complete version of this table is in the electronic edition of the Journal. The printed edition contains only a sample.
| Star name | Ra | Dec | 3.6 m Flux | 4.5 m Flux | 5.8 m Flux | 8.0 m Flux |
|---|---|---|---|---|---|---|
| (J2000.0) | (J2000.0) | (mJy) | (mJy) | (mJy) | (mJy) | |
| BD+17 455 | 43.81795 | 17.89166 | 384 | 251 | 149 | 65 |
| BD+29 503 | 44.44457 | 29.66151 | 482 | 286 | 166 | 98 |
| HD 18632 | 45.01211 | 7.74987 | 1390 | 800 | 498 | 300 |
| BD+07 499 | 50.12181 | 8.45457 | 462 | 279 | 170 | 99 |
| BD+23 465 | 53.20876 | 23.69213 | 500 | 278 | 157 | 91 |
| HIP 17766 | 57.04950 | 7.14626 | 302 | 156 | 117 | 59 |
| HD 286363 | 58.75592 | 12.48568 | 250 | 143 | 95 | 54 |
| HD 285252 | 58.77703 | 16.99855 | 454 | 297 | 163 | 93 |
| BD+19 650 | 60.91259 | 19.45522 | 233 | 135 | 92 | 50 |
| HIP 19082 | 61.35694 | 19.44221 | 160 | 82 | 64 | 33 |
Note. — [1]The complete version of this table is in the electronic edition of the Journal. The printed edition contains only a sample.]
Note. — [2] A 5 error should be adopted for all IRAC fluxes. As discussed in Section 3.1, even though the formal erros in our IRAC measurements are typically 1, there is a random error floor to the best uncertainty possible with our IRAC observing techniques and data reduction process of 5]
| Star name | Flux24 | 24 | P24 | Flux70 | 70 | P70 | Flux160 | 160 | P160 |
|---|---|---|---|---|---|---|---|---|---|
| (mJy) | (mJy) | (mJy) | (mJy) | (mJy) | (mJy) | (mJy) | (mJy) | (mJy) | |
| BD+17 455 | 9.72 | 0.095 | 10.4 | -0.97 | 3.00 | 1.22 | 21.1 | 12.50 | 0.23 |
| BD+29 503 | 12.2 | 0.093 | 14.0 | -5.07 | 2.82 | 1.64 | 7.8 | 30.60 | 0.31 |
| HD 18632 | 33.8 | 0.171 | 33.1 | 5.96 | 4.31 | 3.90 | 82.9 | 22.50 | 0.74 |
| HD 20430 | 28.1 | 0.097 | 29.3 | 11.10 | 4.58 | 3.45 | |||
| BD+07 499 | 13.3 | 0.096 | 13.8 | 0.81 | 2.98 | 1.62 | -39.3 | 33.00 | 0.31 |
| BD+23 465 | 12.4 | 0.093 | 13.2 | -1.97 | 2.37 | 1.55 | -20.6 | 36.90 | 0.29 |
| HIP 17766 | 7.89 | 0.080 | 7.31 | -8.01 | 2.55 | 0.85 | -11.0 | 12.60 | 0.16 |
| BD+23 571 | 8.23 | 0.086 | 9.15 | 3.07 | 2.55 | 1.08 | -15.7 | 17.70 | 0.20 |
| HD 286363 | 7.06 | 0.060 | 7.06 | 0.76 | 1.69 | 0.83 | -23.6 | 9.89 | 0.15 |
| HD 285252 | 12.2 | 0.092 | 12.4 | -2.04 | 3.22 | 1.46 | -53.5 | 25.60 | 0.27 |
Note. — The complete version of this table is in the electronic edition of the Journal. The printed edition contains only a sample.
| LDUST/L∗ | Number of stars | 1- | 2- |
|---|---|---|---|
| above limit | |||
| 110-4 | 22 | 5.0 | 12.7 |
| 210-4 | 47 | 2.4 | 6.2 |
| 510-4 | 64 | 1.8 | 4.6 |
| 110-3 | 67 | 1.7 | 4.4 |
| m | m | ||||
|---|---|---|---|---|---|
| Star Name | (AU) | ( M⊕) | (AU) | ( M⊕) | |
| HD 28226 | |||||
| HD 28355 | |||||