Ethynyl (C2H) in massive star formation: Tracing the initial conditions?
Abstract
APEX single-dish observations at sub-millimeter wavelengths toward a sample of massive star-forming regions reveal that C2H is almost omni-present toward all covered evolutionary stages from Infrared Dark Clouds via High-Mass Protostellar Objects to Ultracompact Hii regions. High-resolution data from the Submillimeter Array toward one hot-core like High-Mass Protostellar Object show a shell-like distribution of C2H with a radius of 9000 AU around the central submm peak position. These observed features are well reproduced by a 1D cloud model with power-law density and temperature distributions and a gas-grain chemical network. The reactive C2H radical (ethynyl) is abundant from the onset of massive star formation, but later it is rapidly transformed to other molecules in the core center. In the outer cloud regions the abundance of C2H remains high due to constant replenishment of elemental carbon from CO being dissociated by the interstellar UV photons. We suggest that C2H may be a molecule well suited to study the initial conditions of massive star formation.
1 Introduction
Spectral line surveys have revealed that high-mass star-forming regions are rich reservoirs of molecules from simple diatomic species to complex and larger molecules (e.g., Schilke et al. 1997; Hatchell et al. 1998; Comito et al. 2005; Bisschop et al. 2007). However, there have been rarely studies undertaken to investigate the chemical evolution during massive star formation from the earliest evolutionary stages, i.e., from High-Mass Starless Cores (HMSCs) and High-Mass Cores with embedded low- to intermediate-mass protostars destined to become massive stars, via High-Mass Protostellar Objects (HMPOs) to the final stars that are able to produce Ultracompact Hii regions (UCHiis, see Beuther et al. 2007 for a recent description of the evolutionary sequence). The first two evolutionary stages are found within so-called Infrared Dark Clouds (IRDCs). While for low-mass stars the chemical evolution from early molecular freeze-out to more evolved protostellar cores is well studied (e.g., Bergin & Langer 1997; Dutrey et al. 1997; Pavlyuchenkov et al. 2006; Jørgensen et al. 2007), it is far from clear whether similar evolutionary patterns are present during massive star formation.
To better understand the chemical evolution of high-mass star-forming regions we initiated a program to investigate the chemical properties from IRDCs to UCHiis from an observational and theoretical perspective. We start with single-dish line surveys toward a large sample obtaining their basic characteristics, and then perform detailed studies of selected sources using interferometers on smaller scales. These observations are accompanied by theoretical modeling of the chemical processes. Long-term goals are the chemical characterization of the evolutionary sequence in massive star formation, the development of chemical clocks, and the identification of molecules as astrophysical tools to study the physical processes during different evolutionary stages. Here, we present an initial study of the reactive radical ethynyl (C2H) combining single-dish and interferometer observations with chemical modeling. Although C2H was previously observed in low-mass cores and Photon Dominated Regions (e.g., Millar & Freeman 1984; Jansen et al. 1995), so far it was not systematically investigated in the framework of high-mass star formation.
2 Observations
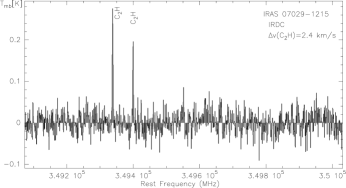
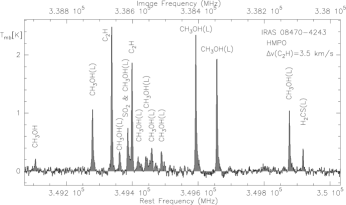
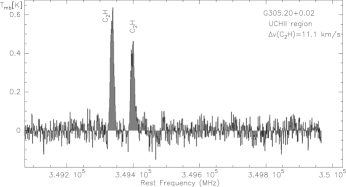
The 21 massive star-forming regions were observed with the Atacama Pathfinder Experiment (APEX) in the 875 m window in fall 2006. We observed 1 GHz from 338 to 339 GHz and 1 GHz in the image sideband from 349 to 350 GHz. The spectral resolution was 0.1 km s-1, but we smoothed the data to 0.9 km s-1. The average system temperatures were around 200 K, each source had on-source integration times between 5 and 16 min. The data were converted to main-beam temperatures with forward and beam efficiencies of 0.97 and 0.73, respectively (Belloche et al., 2006). The average rms was 0.4 K. The main spectral features of interest are the C2H lines around 349.4 GHz with upper level excitation energies of 42 K (line blends of C2H & C2H at 349.338 GHz, and C2H & C2H at 349.399 GHz). The beam size was .
The original Submillimeter Array (SMA) C2H data toward the HMPO 18089-1732 were first presented in Beuther et al. (2005b). There we used the compact and extended configurations resulting in good images for all spectral lines except of C2H. For this project, we re-worked on these data only using the compact configuration. Because the C2H emission is distributed on larger scales (see §3), we were now able to derive a C2H image. The integration range was from 32 to 35 km s-1, and the achieved rms of the C2H image was 450 mJy beam-1. For more details on these observations see Beuther et al. (2005b).
3 Results
The sources were selected to cover all evolutionary stages from IRDCs via HMPOs to UCHiis. We derived our target list from the samples of Klein et al. (2005); Fontani et al. (2005); Hill et al. (2005); Beltrán et al. (2006). Table LABEL:sample lists the observed sources, their coordinates, distances, luminosities and a first order classification into the evolutionary sub-groups IRDCs, HMPOs and UCHiis based on the previously available data. Although this classification is only based on a limited set of data, here we are just interested in general evolutionary trends. Hence, the division into the three main classes is sufficient.
Figure 1 presents sample spectra toward one source of each evolutionary group. While we see several CH3OH lines as well as SO2 and H2CS toward some of the HMPOs and UCHiis but not toward the IRDCs, the surprising result of this comparison is the presence of the C2H lines around 349.4 GHz toward all source types from young IRDCs via the HMPOs to evolved UCHiis. Table LABEL:sample lists the peak brightness temperatures, the integrated intensities and the FWHM line-widths of the C2H line blend at 349.399 GHz. The separation of the two lines of 1.375 MHz already corresponds to a line-width of 1.2 km s-1. We have three C2H non-detections (2 IRDCs and 1 HMPO), however, with no clear trend with respect to the distances or the luminosities (the latter comparison is only possible for the HMPOs). While IRDCs are on average colder than more evolved sources, and have lower brightness temperatures, the non-detections are more probable due to the relatively low sensitivity of the short observations (§2). Hence, the data indicate that the C2H lines are detected independent of the evolutionary stage of the sources in contrast to the situation with other molecules. When comparing the line-widths between the different sub-groups, one finds only a marginal difference between the IRDCs and the HMPOs (the average of the two groups are 2.8 and 3.1 km s-1). However, the UCHiis exhibit significantly broader line-widths with an average value of 5.5 km s-1.
Intrigued by this finding, we wanted to understand the C2H spatial structure during the different evolutionary stages. Therefore, we went back to a dataset obtained with the Submillimeter Array toward the hypercompact Hii region IRAS 18089-1732 with a much higher spatial resolution of (Beuther et al., 2005b). Albeit this hypercompact Hii region belongs to the class of HMPOs, it is already in a relatively evolved stage and has formed a hot core with a rich molecular spectrum. Beuther et al. (2005b) showed the spectral detection of the C2H lines toward this source, but they did not present any spatially resolved images. To recover large-scale structure, we restricted the data to those from the compact SMA configuration (§2). With this refinement, we were able to produce a spatially resolved C2H map of the line blend at 349.338 GHz with an angular resolution of (corresponding to an average linear resolution of 7700 AU at the given distance of 3.6 kpc). Figure 2 presents the integrated C2H emission with a contour overlay of the 860 m continuum source outlining the position of the massive protostar. In contrast to almost all other molecular lines that peak along with the dust continuum (Beuther et al., 2005b), the C2H emission surrounds the continuum peak in a shell-like fashion.
4 Discussion and Conclusions
To understand the observations, we conducted a simple chemical modeling of massive star-forming regions. A 1D cloud model with a mass of 1200 M☉, an outer radius of 0.36 pc and a power-law density profile ( with ) is the initially assumed configuration. Three cases are studied: (1) a cold isothermal cloud with K, (2) K, and (3) a warm model with a temperature profile with and a temperature at the outer radius of 44 K. The cloud is illuminated by the interstellar UV radiation field (IRSF, Draine 1978) and by cosmic ray particles (CRP). The ISRF attenuation by single-sized m silicate grains at a given radius is calculated in a plane-parallel geometry following van Dishoeck (1988). The CRP ionization rate is assumed to be s-1 (Spitzer & Tomasko, 1968). The gas-grain chemical model by Vasyunin et al. (2008) with the desorption energies and surface reactions from Garrod et al. (2007) is used. Gas-phase reaction rates are taken from RATE 06 (Woodall et al., 2007), initial abundances, were adopted from the “low metal” set of Lee et al. (1998).
Figure 3 presents the C2H abundances for the three models at two different time steps: (a) 100 yr, and (b) in a more evolved stage after yr. The C2H abundance is high toward the core center right from the beginning of the evolution, similar to previous models (e.g., Millar & Nejad 1985; Herbst & Leung 1986; Turner et al. 1999). During the evolution, the C2H abundance stays approximately constant at the outer core edges, whereas it decreases by more than three orders of magnitude in the center, except for the cold K model. The C2H abundance profiles for all three models show similar behavior.
The chemical evolution of ethynyl is determined by relative removal rates of carbon and oxygen atoms or ions into molecules like CO, OH, H2O. Light ionized hydrocarbons CH (n=2..5) are quickly formed by radiative association of C+ with H2 and hydrogen addition reactions: C+ CH CH CH. The protonated methane reacts with electrons, CO, C, OH, and more complex species at later stage and forms methane. The CH4 molecules undergo reactive collisions with C+, producing C2H and C2H. An alternative way to produce C2H is the dissociative recombination of CH into CH3 followed by reactions with C+. Finally, C2H and C2H dissociatively recombine into CH, C2H, and C2H2. The major removal for C2H is either the direct neutral-neutral reaction with O that forms CO, or the same reaction but with heavier carbon chain ions that are formed from C2H by subsequent insertion of carbon. At later times, depletion and gas-phase reactions with more complex species may enter into this cycle. At the cloud edge the interstellar UV radiation instantaneously dissociates CO despite its self-shielding, re-enriching the gas with elemental carbon.
The transformation of C2H into CO and other species proceeds efficiently in dense regions, in particular in the “warm” model where endothermic reactions result in rich molecular complexity of the gas (see Fig. 3). In contrast, in the “cold” 10 K model gas-grain interactions and surface reactions become important. As a result, a large fraction of oxygen is locked in water ice that is hard to desorb ( K), while half of the elemental carbon goes to volatile methane ice ( K). Upon CRP heating of dust grains, this leads to much higher gas-phase abundance of C2H in the cloud core for the cold model compared to the warm model. The effect is not that strong for less dense regions at larger radii from the center.
Since the C2H emission is anti-correlated with the dust continuum emission in the case of IRAS 18089-1732 (Fig. 2), we do not have the H2 column densities to quantitatively compare the abundance profiles of IRAS 18089-1732 with our model. However, data and model allow a qualitative comparison of the spatial structures. Estimating an exact evolutionary time for IRAS 18089-1732 is hardly possible, but based on the strong molecular line emission, its high central gas temperatures and the observed outflow-disk system (Beuther et al., 2004b, a, 2005b), an approximate age of yr appears reasonable. Although dynamical and chemical times are not necessarily exactly the same, in high-mass star formation they should not differ to much: Following the models by McKee & Tan (2003) or Krumholz et al. (2007), the luminosity rises strongly right from the onset of collapse which can be considered as a starting point for the chemical evolution. At the same time disks and outflows evolve, which should hence have similar time-scales. The diameter of the shell-like C2H structure in IRAS 18089-1732 is (Fig. 2), or 9000 AU in radius at the given distance of 3.6 kpc. This value is well matched by the modeled region with decreased C2H abundance (Fig. 3). Although in principle optical depths and/or excitation effects could mimic the C2H morphology, we consider this as unlikely because the other observed molecules with many different transitions all peak toward the central submm continuum emission in IRAS 18089-1732 (Beuther et al., 2005b). Since C2H is the only exception in that rich dataset, chemical effects appear the more plausible explanation.
The fact that we see C2H at the earliest and the later evolutionary stages can be explained by the reactive nature of C2H: it is produced quickly early on and gets replenished at the core edges by the UV photodissociation of CO. The inner “chemical” hole observed toward IRAS 18089-1732 can be explained by C2H being consumed in the chemical network forming CO and more complex molecules like larger carbon-hydrogen complexes and/or depletion.
The data show that C2H is not suited to investigate the central gas cores in more evolved sources, however, our analysis indicates that C2H may be a suitable tracer of the earliest stages of (massive) star formation, like N2H+ or NH3 (e.g., Bergin et al. 2002; Tafalla et al. 2004; Beuther et al. 2005a; Pillai et al. 2006). While a spatial analysis of the line emission will give insights into the kinematics of the gas and also the evolutionary stage from chemical models, multiple C2H lines will even allow a temperature characterization. With its lowest transitions around 87 GHz, C2H has easily accessible spectral lines in several bands between the 3 mm and 850 m. Furthermore, even the 349 GHz lines presented here have still relatively low upper level excitation energies ( K), hence allowing to study cold cores even at sub-millimeter wavelengths. This prediction can further be proved via high spectral and spatial resolution observations of different C2H lines toward young IRDCs.
References
- Belloche et al. (2006) Belloche, A., Parise, B., van der Tak, F. F. S., et al. 2006, A&A, 454, L51
- Beltrán et al. (2006) Beltrán, M. T., Brand, J., Cesaroni, R., et al. 2006, A&A, 447, 221
- Bergin et al. (2002) Bergin, E. A., Alves, J., Huard, T., & Lada, C. J. 2002, ApJ, 570, L101
- Bergin & Langer (1997) Bergin, E. A. & Langer, W. D. 1997, ApJ, 486, 316
- Beuther et al. (2007) Beuther, H., Churchwell, E. B., McKee, C. F., & Tan, J. C. 2007, in Protostars and Planets V, ed. B. Reipurth, D. Jewitt, & K. Keil, 165–180
- Beuther et al. (2004a) Beuther, H., Hunter, T. R., Zhang, Q., et al. 2004a, ApJ, 616, L23
- Beuther et al. (2005a) Beuther, H., Zhang, Q., Greenhill, L. J., et al. 2005a, ApJ, 632, 355
- Beuther et al. (2004b) Beuther, H., Zhang, Q., Hunter, T. R., et al. 2004b, ApJ, 616, L19
- Beuther et al. (2005b) Beuther, H., Zhang, Q., Sridharan, T. K., & Chen, Y. 2005b, ApJ, 628, 800
- Bisschop et al. (2007) Bisschop, S. E., Jørgensen, J. K., van Dishoeck, E. F., & de Wachter, E. B. M. 2007, A&A, 465, 913
- Comito et al. (2005) Comito, C., Schilke, P., Phillips, T. G., et al. 2005, ApJS, 156, 127
- Draine (1978) Draine, B. T. 1978, ApJS, 36, 595
- Dutrey et al. (1997) Dutrey, A., Guilloteau, S., & Guelin, M. 1997, A&A, 317, L55
- Faúndez et al. (2004) Faúndez, S., Bronfman, L., Garay, G., et al. 2004, A&A, 426, 97
- Fontani et al. (2005) Fontani, F., Beltrán, M. T., Brand, J., et al. 2005, A&A, 432, 921
- Garrod et al. (2007) Garrod, R. T., Wakelam, V., & Herbst, E. 2007, A&A, 467, 1103
- Hatchell et al. (1998) Hatchell, J., Thompson, M. A., Millar, T. J., & MacDonald, G. H. 1998, A&AS, 133, 29
- Herbst & Leung (1986) Herbst, E. & Leung, C. M. 1986, MNRAS, 222, 689
- Hill et al. (2005) Hill, T., Burton, M. G., Minier, V., et al. 2005, MNRAS, 363, 405
- Jansen et al. (1995) Jansen, D. J., van Dishoeck, E. F., Black, J. H., Spaans, M., & Sosin, C. 1995, A&A, 302, 223
- Jørgensen et al. (2007) Jørgensen, J. K., Bourke, T. L., Myers, P. C., et al. 2007, ApJ, 659, 479
- Klein et al. (2005) Klein, R., Posselt, B., Schreyer, K., Forbrich, J., & Henning, T. 2005, ApJS, 161, 361
- Krumholz et al. (2007) Krumholz, M. R., Klein, R. I., & McKee, C. F. 2007, ApJ, 656, 959
- Lee et al. (1998) Lee, H.-H., Roueff, E., Pineau des Forets, G., et al. 1998, A&A, 334, 1047
- McKee & Tan (2003) McKee, C. F. & Tan, J. C. 2003, ApJ, 585, 850
- Millar & Freeman (1984) Millar, T. J. & Freeman, A. 1984, MNRAS, 207, 405
- Millar & Nejad (1985) Millar, T. J. & Nejad, L. A. M. 1985, MNRAS, 217, 507
- Pavlyuchenkov et al. (2006) Pavlyuchenkov, Y., Wiebe, D., Launhardt, R., & Henning, T. 2006, ApJ, 645, 1212
- Pillai et al. (2006) Pillai, T., Wyrowski, F., Carey, S. J., & Menten, K. M. 2006, A&A, 450, 569
- Schilke et al. (1997) Schilke, P., Groesbeck, T. D., Blake, G. A., & Phillips, T. G. 1997, ApJS, 108, 301
- Spitzer & Tomasko (1968) Spitzer, L. J. & Tomasko, M. G. 1968, ApJ, 152, 971
- Tafalla et al. (2004) Tafalla, M., Myers, P. C., Caselli, P., & Walmsley, C. M. 2004, A&A, 416, 191
- Turner et al. (1999) Turner, B. E., Terzieva, R., & Herbst, E. 1999, ApJ, 518, 699
- van Dishoeck (1988) van Dishoeck, E. F. 1988, in Rate Coefficients in Astrochemistry. Proceedings of Conference in UMIST, United Kingdom, 1987. Eds, T.J. Millar, D.A. Williams, ed. T. J. Millar & D. A. Williams, 49
- Vasyunin et al. (2008) Vasyunin, A. I., Semenov, D., Henning, T., et al. 2008, ApJ, in press
- Vig et al. (2007) Vig, S., Ghosh, S. K., Ojha, D. K., & Verma, R. P. 2007, A&A, 463, 175
- Woodall et al. (2007) Woodall, J., Agúndez, M., Markwick-Kemper, A. J., & Millar, T. J. 2007, A&A, 466, 1197
| Name | Type | R.A. | Dec. | Ref. | |||||
|---|---|---|---|---|---|---|---|---|---|
| J2000 | J2000 | kpc | log(L⊙) | K | K km s-1 | km s-1 | |||
| IRAS07029 | IRDC | 07:05:11.1 | -12:19:02 | 1.0 | b | 0.21 | 0.52 | (1) | |
| IRAS08477 | IRDC | 08:49:32.9 | -44:10:47 | 1.8 | b | 0.23 | 0.76 | (2,3) | |
| IRAS09014 | IRDC | 09:03:09.8 | -47:48:28 | 1.3 | b | – | – | – | (2,3) |
| IRAS13039 | IRDC | 13:07:07.0 | -61:24:47 | 2.4 | b | – | – | – | (2,3) |
| IRAS14000 | IRDC | 14:03:36.6 | -61:18:28 | 5.6 | b | 0.38 | 1.13 | (2,3) | |
| IRAS08211 | HMPO | 08:22:52.3 | -42:07:57 | 1.7 | 3.5 | 0.38 | 0.85 | (2,3) | |
| IRAS08470 | HMPO | 08:48:47.9 | -42:54:22 | 2.2 | 4.2 | 1.85 | 6.81 | (3) | |
| IRAS08563 | HMPO | 08:58:12.5 | -42:37:34 | 1.7 | 3.2 | 1.08 | 3.30 | (2,3) | |
| IRAS09131 | HMPO | 09:14:55.5 | -47:36:13 | 1.7 | 3.4 | 0.23 | 0.50 | (2,3) | |
| IRAS09209 | HMPO | 09:22:34.6 | -51:56:26 | 6.4 | 4.1 | – | – | – | (2,3) |
| IRAS09578 | HMPO | 09:59:31.0 | -57:03:45 | 1.7 | 3.9 | 0.21 | 0.64 | (3) | |
| IRAS10123 | HMPO | 10:14:08.8 | -57:42:12 | 0.9/3.0c | 3.4/4.4c | 0.17a | 0.46 | (2,3) | |
| IRAS10184 | HMPO | 10:20:14.7 | -58:03:38 | 5.4 | 5.5 | 0.41 | 1.68 | (3) | |
| IRAS10276 | HMPO | 10:29:30.1 | -57:26:40 | 5.9 | 4.9 | 0.24a | 0.67 | (3) | |
| IRAS10295 | HMPO | 10:31:28.3 | -58:02:07 | 5.0 | 5.8 | 0.69 | 3.45 | (3) | |
| IRAS10320 | HMPO | 10:33:56.4 | -59:43:53 | 9.1 | 5.4 | 0.85 | 3.48 | (3) | |
| G294.97 | UCHii | 11:39:09.0 | -63:28:38 | 1.3/5.8c | 3.9/5.3c | 0.31 | 0.78 | (4) | |
| G305.20 | UCHii | 13:11:12.3 | -62:44:57 | 3.0/6.8c | 5.1/6.1c | 0.44 | 5.21 | (4) | |
| G305.37 | UCHii | 13:12:36.3 | -62:33:39 | 3.0/6.8c | d | 1.24 | 6.28 | (4) | |
| G305.561 | UCHii | 13:14:25.8 | -62:44:32 | 4.0 | 5.1 | 0.94 | 4.71 | (4,5) | |
| IRAS14416 | UCHii | 14:45:22.0 | -59:49:39 | 2.8 | 5.1 | 1.24 | 6.19 | (6) |
Ref.: (1) Klein et al. (2005), (2) Fontani et al. (2005), (3) Beltrán et al. (2006), (4) Hill et al. (2005), (5) Faúndez et al. (2004), (6) Vig et al. (2007).
a For these sources we list the parameters of the C2H line
blend at 349.338 GHz, for all other sources it is the C2H line at
349.399 GHz.
b Since the IRDCs are per default not detected at short wavelengths, they are no IRAS source and we cannot derive a luminosity.
c Near and far distances and corresponding luminosities.
d No IRAS counterpart, hence no luminosity estimate.