Coronae of Young Fast Rotators
Abstract
AB Dor, Speedy Mic and Rst 137B are in their early post-T Tauri evolutionary phase ( 100 Myr), at the age of fastest rotation in the life of late-type stars. They straddle the coronal saturation-supersaturation boundary first defined by young stars in open clusters. High resolution Chandra X-ray spectra have been analysed to study their coronal properties as a function of coronal activity parameters Rossby number, and a coronal temperature index. Plasma emission measure distributions as a function of temperature show broad peaks at K. Differences between stars suggest that as supersaturation is reached the DEM slope below the temperature of peak DEM becomes shallower, while the DEM drop-off above this temperature becomes more pronounced. A larger sample comprising our three targets and 22 active stars studied in the recent literature reveals a general increase of plasma at toward the saturated-supersaturated boundary but a decline beyond this among supersaturated stars. All three of the stars studied in detail here show lower coronal abundances of the low FIP elements Mg, Si and Fe, relative to the high FIP elements S, O and Ne, as compared to the solar mixture. The coronal Fe abundances of the stellar sample are inversely correlated with , declining slowly with rising , but with a much more sharp decline at . For dwarfs the Fe abundance is also well-correlated with Rossby number. Coronal O abundances appear lower than photospheric expectations by up to dex, but with no obvious trends with activity indices. The coronal O/Fe ratios for dwarfs show a clear increase with decreasing Rossby number, apparently reaching saturation at [O/Fe]=0.5 at the coronal supersaturation boundary. Similar increases in O/Fe with increasing coronal temperature and are seen. The range in O/Fe variations attributable to outer atmosphere chemical fractionation in our sample is about a factor of 10.
1 Introduction
In low-mass main sequence (MS) stars, internal structure is determined primarily by stellar mass rather than age. In contrast, surface activity as manifested in X-rays, at least for late-type dwarfs, seems to scale directly with rotation and by consequence with age, but is only weakly dependent on mass (Skumanich, 1972; Hempelmann et al., 1995; Stauffer et al., 1997). Observations suggest that, compared to the Sun, stars of higher rotation rate show a more intense X-ray emission that reaches a maximum of about at rotation rates of about =2-4.5d (Stauffer et al., 1997). Beyond this rate lies the ”saturated” regime where the X-ray luminosity is independent of rotation. This behaviour persists until rotation rates of about 0.5d (Prosser et al., 1996; Randich, 1998; Stȩpień et al., 2001), at which point the X-ray luminosity is seen in open cluster stars to decrease again. This regime is referred to as “supersaturated” (Prosser et al., 1996; Randich, 1998).
Although a number of different explanations have been invoked in order to explain the saturation and supersaturation phenomenon (e.g., Jardine & Unruh, 1999; Jardine, 2004; Ryan et al., 2005), there is as yet no widely accepted theoretical descripton. Existing studies pointing to supersaturation are based on relatively crude diagnostics such as the ratio of X-ray to bolometric luminosity, . Issues such as how coronal thermal structure or chemical composition anomalies might change in the transition between the saturated and supersaturated regimes have not yet been addressed.
Chandra and XMM-Newton high-resolution X-ray spectra allow us to resolve spectral lines of a number of elements in the coronae of active stars, and thus to probe these questions with greater acuity than was possible with low resolution instruments. Despite the growing number of high-resolution X-ray studies of late-type stars, there are as yet few studies on the fastest-rotating so-called supersaturated stars.
In this paper, using Chandra High Energy Transmission Grating spectrograph (HETGS) observations, we present a comparative analysis of the coronal X-ray spectra of three late-type dwarfs of similar age (probably 30-100 Myr; see §2) rotating at, nominally, saturated and supersatured rates. Our main aims are to investigate differences in thermal structure and chemical composition as a function of the “Rossby number” dynamo activity index (Durney & Latour, 1978; Noyes et al., 1984) in the supposedly saturated and supersaturated regimes.
We first describe the three stars and briefly review earlier work (§2), then in §3 we report on the Chandra observations and data reduction. The methods used for a differential emission measure analysis together with results obtained are shown in §4. In §5 and §6 we discuss our results on the coronal abundances and temperature structure and report our conclusions in §7. Note that the results for AB Dor we present here were reported by García-Alvarez et al. (2005) to which we refer the reader for further details.
2 Program Stars
Our sample stars have been chosen to represent late-type dwarfs at an early evolutionary phase ( 100 Myr) during which they attain their fastest rotation rates.
2.1 AB Dor
AB Doradus (HD 36705) is a young, relatively bright (V=6.9) and rapidly rotating late-type star with spectral type K0-2 V. It is an example of the very active cool stars that are just evolving onto the main sequence. In recent years there have been a controversy over the age of AB Dor with two rather different estimates for its age: a first one of the order of 50 Myr (e.g.; Zuckerman et al. (2004) 50 Myr; Lopez-Santiago et al. (2006) 50 Myr; Janson et al. (2007) 50-100 Myr) and a second one of about 100-125Myr (e.g.; Luhman et al. (2005) 75-125 Myr; Ortega et al. (2007) 100-140 Myr). The main physical parameters of AB Dor are shown in Table 1. AB Dor has been extensively observed in the ultraviolet (Rucinski et al., 1995; Moos et al., 2000; Vilhu et al., 2001) and X-rays (Pakull, 1981; Vilhu et al., 1987; Collier Cameron et al., 1988; Mewe et al., 1996; Kuerster et al., 1997; Maggio et al., 2000; Güdel et al., 2001).
The photospheric abundances of AB Dor and its hosting cluster, the Pleiades, are relatively well studied (e.g.; Vilhu et al., 1987; King et al., 2000; Boesgaard, 1989; Cayrel et al., 1985; Schuler et al., 2004). All these studies reported a solar-like photospheric mixture.
A low coronal iron abundance, [Fe/H]=-0.95, found by Mewe et al. (1996) using simultaneous observations with EUVE and ASCA, was confirmed by Güdel et al. (2001) using XMM-Newton data. Sanz-Forcada et al. (2003) reported coronal abundances for AB Dor based on XMM-Newton and Chandra spectra showing a similar Fe depletion. García-Alvarez et al. (2005) found similar results for AB Dor but no evidence for enhancements of very low FIP ( eV) elements, such as Na, Al and Ca, suggested by previous works.
2.2 Rst 137B
Rst 137B is a common-proper-motion companion of AB Dor, at a separation of , with spectral type M3-M5. Rst 137B was first discovered in X-rays from an Einstein High Resolution Imager observation (Vilhu & Linsky, 1987). It is a strong X-ray and UV source, with the observed emission at both wavelengths lying close to the saturation levels defined by young and/or rapidly rotating stars (Vilhu & Linsky, 1987; Vilhu et al., 1989). Martin & Brandner (1995) confirmed, based on the existing data (space velocities, rotation, emission line strengths, lithium) the evolutionary status intermediate between T Tauri stars and Pleiades stars for Rst 137B. Collier-Cameron & Foing (1997) concluded that the relative magnitudes and V(RI)c colours of AB Dor and Rst 137B are consistent with both stars having a common evolutionary age that is no greater than that of the Pleiades. This age makes Rst 137B to be an order of magnitude younger than the majority of flare stars in the solar neighborhood. Further evidence for its youth are provided by its intense Ca II emission (Innis et al., 1988), high X-ray luminosity of log Lx/L-3 (Vilhu & Linsky, 1987), and high projected angular velocity (v sin i= 50 Vilhu et al., 1991), which is comparable to that of the most rapidly rotating M dwarfs in the Pleaides cluster (Stauffer & Hartmann, 1987). Lim (1993) estimated a rotational period of based on projected rotation velocity and spectral type. Important physical parameters of Rst 137B are listed in Table 1.
2.3 Speedy Mic
Attention was drawn to BO Mic by Bromage et al. (1992), who reported what turned out to be the largest stellar flare observed during the EUV all-sky-survey of ROSAT. This single young K-dwarf is one of the most active solar neighbourhood stars (Singh et al., 1999), with an X-ray to bolometric luminosity ratio of =-3.07. It can reach a value of during flares (Makarov, 2003). BO Mic is usually nicknamed “Speedy Mic” due to it fast rotation ( days (Cutispoto et al., 1997), v sin i= 132 (Barnes, 2005)). The main physical parameters of Speedy Mic are listed in Table 1. Montes et al. (2001) have shown that Speedy Mic, like AB Dor, is indeed a member of the Local Association. Barnes et al. (2001) confirmed the presence of H transients, first reported by (Jeffries, 1993). These transients are thought to be the result of clouds of cool material, analogous to solar prominences passing in front of the stellar disc. Singh et al. (1999) found significantly subsolar coronal Fe abundances, based on ASCA observations, in accordance with observations of other active stars. Nordström et al. (2004) derived a solar-like metallicity ([Fe/H]=0.03) for Speedy Mic from photometric indices (since the same study found AB Dor to be depleted in Fe by a factor of three compared to solar and in contradiction to the solar composition found from high resolution spectroscopy we place only limited weight on this result).
3 Observations
The Chandra HETGS observation of AB Dor, Speedy Mic and Rst 137B were carried out using the Advanced CCD Imaging Spectrometer (ACIS-S). All the observations employed the detector in its standard instrument configuration. Rst 137B was observed simultaneously and serendipitously during the AB Dor observations. Two observations one day apart were obtained for Speedy Mic. These were summed resulting in an exposure time of 70ks. The observations of the three targets are summarized in Table 1.
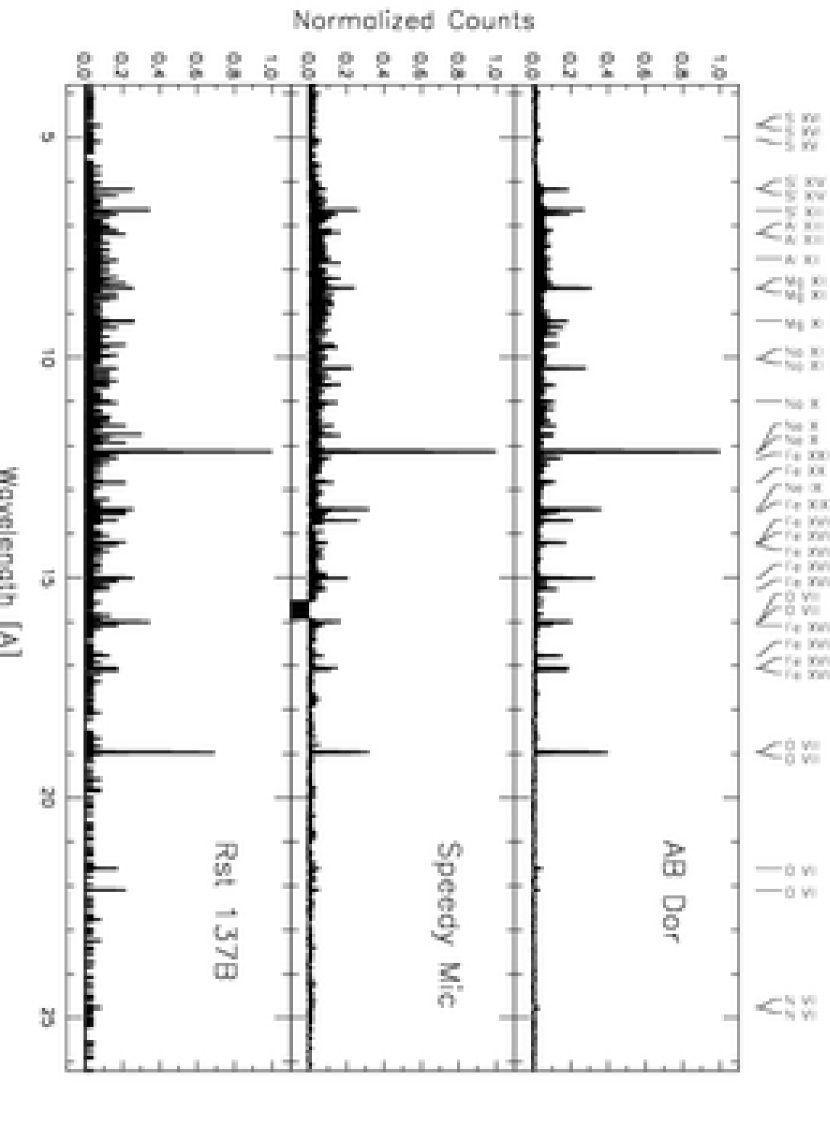
Fig. 1 shows the Chandra X-ray spectra of AB Dor, Speedy Mic and Rst 137B in the wavelength range 4-26 Å, which contains the prominent lines of N, O, Ne, Na, Mg, Al, Si, S and Fe. The strongest coronal lines are identified. These spectra show a remarkable similarity of lines, both in terms of which lines are prominent, from H- and He-like ions and the broad range of charge states of Fe, and in their relative intensities. Ne X is the strongest line observed in the spectrum of the three targets. The spectrum of Rst 137B, although similar to the other two stars, shows comparatively stronger O and Si lines. We also observe that in Speedy Mic and Rst 137B the Fe lines are comparatively weaker than their counterparts in AB Dor.
4 Analysis
Pipeline-processed (CXC software version 6.3.1) photon event lists were reduced using the CIAO software package version 3.2, and were analyzed using the IDL222Interactive Data Language, Research Systems Inc.-based PINTofALE333Available from http://hea-www.harvard.edu/PINTofALE software suite (Kashyap & Drake, 2000). The analysis we have performed consisted of line identification and fitting, reconstruction of the plasma emission measure distribution including allowance for blending of the diagnostic lines used, and finally, determination of the element abundances.
4.1 Photometry
Before commencing spectral analysis, we first checked for flare activity that could affect not only the shape of the differential emission measures (DEMs) but might also be accompanied by detectable changes in the chemical composition of the plasma that dominate the disk-averaged spectra (e.g.; Favata et al., 2000; Maggio et al., 2000; Güdel et al., 2001). Light curves for AB Dor, Speedy Mic and Rst 137B observations were derived from the dispersed photons only and excluded the 0th order, which could be affected by pileup. Events were then binned at 100s intervals. The resulting light curves are illustrated in Fig. 2. Note that all the light curves are relatively flat and devoid of significant flare activity, excepting the moderate event on AB Dor midway through the observation. We conclude that AB Dor, Speedy Mic and Rst 137B observations are representative of the stars during times of relative quiescence, and therefore treat the observations in their entirety for the remainder of the analysis.
4.2 Spectroscopy
Spectral line fluxes for AB Dor, Speedy Mic and Rst 137B were measured by fitting modified Lorentzian or Moffat (“beta profile”) functions which represents the Chandra transmission grating instrumental profile to within photon counting statistics for lines of the order of a few 1000 counts or less (Drake, 2004). Table 2 shows the measured fluxes of the emission lines identified and used in this analysis.
4.3 Differential Emission Measure and Coronal Abundances
Our method for obtaining the differential emission measure (DEM) has been described in detail in earlier works (García-Alvarez et al., 2005) and is described here only in brief. A given line flux depends on plasma temperature and on the abundance of the element in question. The ratio of two emission lines from ions of the same element is independent of the abundance of the chosen element. We have therefore devised a method that uses line ratios instead of line fluxes directly.
We use a Markov-Chain Monte-Carlo analysis using a Metropolis algorithm (MCMC[M]) on the set of supplied line flux ratios (Kashyap & Drake, 1998) to estimate the DEM. Our basic set of diagnostics comprises the H-like/He-like resonance line flux ratios for the elements O, Ne, Mg, and Si, line ratios involving Fe XVII, Fe XVIII and Fe XXI resonance lines, and measurements of the continuum flux at points in the spectrum that are essentially free of lines. These continuum values serve both to constrain the emission at high temperatures and to determine the absolute normalization of the DEM. The set of lines include the brightest lines in stellar coronal spectra and are easily measured in essentially all well-exposed Chandra grating observations of stellar coronae, such that star-to-star variations in diagnostic lines used can be avoided. The emission measure distribution and abundance analysis employed the CHIANTI database version 4.2 (Dere et al., 2001) and the ionization balance of Mazzotta et al. (1998), as implemented in the PINTofALE software package (Kashyap & Drake, 2000). Hidden blends were corrected for based on the prediction of blending lines in the CHIANTI database using the methods described in García-Alvarez et al. (2005).
The MCMC[M] method yields the emission measure distribution over a pre-selected temperature grid, where the DEM is defined for each T bin. In our case, a set of temperatures , with =0.1, define the DEM(Tn)=. The derived DEM(Tn) is reliable over a certain temperature range only if we have lines with contribution function G() G(). Based on the lines we use in our analysis we are able to obtain a well-constrained DEM(Tn) between =6.2 (the coolest peak formation temperature given by the resonance line O VII is =6.3) and =7.5 (the hottest peak formation temperature given by the resonance line S XVI is =7.4); larger uncertainties are obtained outside that range. Our final DEMs are reported as volume emission measures at the star. We have adopted distances =14.9 pc, =44.4 pc and =14.9 pc for AB Dor, Speedy Mic and Rst 137B respectively (Perryman et al., 1997).
4.4 Abundances
Once the DEM has been established, we can evaluate the abundances of any elements for which we have lines with measured fluxes. We derived values for the coronal abundances of the elements O, Ne, Mg, Si, S, and Fe. Na was also studied although only upper limits were obtained owing to the weakness of the line features within our spectral bandpass; S was also not detected in Speedy Mic and RST 137B. In cases where there was more than one line for a given element, the weighted average of the abundance determinations from each of the individual lines was adopted.
According to previous studies in the literature, the photospheric abundances for AB Dor and Speedy Mic are similar to the solar ones (see §2.1 and §2.3). There are no photospheric abundance measurements available for Rst 137B. However, its physical association with AB Dor (see §2.2) presents a very plausible case for its abundances being solar-like. We therefore adopt the mixture of Asplund et al. (2005) for comparing all coronal abundance results. The Asplund et al. (2005) solar chemical composition shows a downward revision by 25-35% of the abundances of light elements such as C, N, O and Ne compared with values from earlies studies (e.g. Grevesse & Sauval, 1998). The use of these new values would increase the derived stellar coronal abundances of light elements relative to those obtained by using the solar chemical composition from earlies studies. In other words, the observed trends in any coronal abundance FIP and inverse-FIP effects (Brinkman et al., 2001) will be slightly shallower and slightly steeper respectively if one uses the new solar chemical composition reported by Asplund et al. (2005). One exception to the Asplund et al. (2005) mixture might be the element Ne. Drake & Testa (2005) have recently found Ne/O to be enhanced by an average factor of 2.7 compared to the Asplund et al. (2005) ratio in the coronae of approximately 20 nearby and mostly active stars. Based on these results, we have assumed a Ne abundance revised upward by 0.43 dex with respect to Asplund et al. (2005). We discuss this in more detail in §6.2.
We also used the temperature-insensitive abundance ratio diagnostics of Drake et al. (2007a) as an additional check on our values obtained using the DEM. These are ratios formed by combining two sets of lines of two different elements, constructed such that the combined emissivity curves of each set have essentially the same temperature dependence. The resulting ratio of measured line fluxes then yields directly the ratio of the abundances of the relevant elements, independent from the atmospheric temperature structure. Results are shown in Table 4.
5 Results
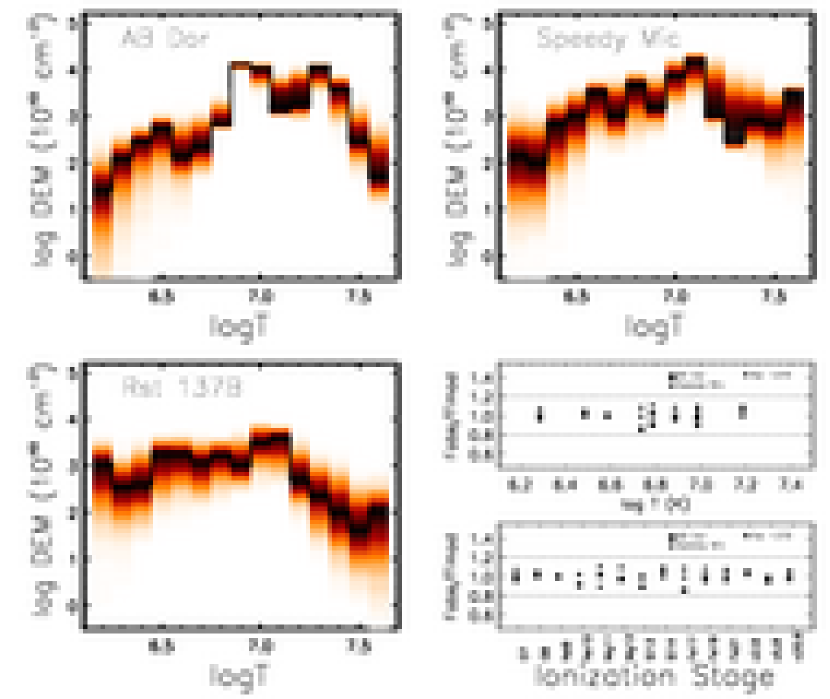
In order to verify the propriety of our DEM and abundance techniques we have compared observed and modeled line fluxes vs ionic species and (the temperature of maximum emissivity) in Fig 3 (bottom right panel). All the predicted line fluxes based on our final models are within 10 % or so of the observed values.
5.1 Temperature Structure
Fig. 3 illustrates the reconstructed DEMs for our three stars AB Dor, Speedy Mic and Rst 137B. Although the DEMs for the three targets peak around [K]7.0-7.1, the overall shapes are slightly different. The DEM for AB Dor shows a primary peak at that extents to . The DEM for Speedy Mic has a less pronounced peak around –7.1 and shows a sharper decrease for . Finally, the DEM for Rst 137B is relatively flat, peaking at –7.1 and showing a smooth steep decrease for higher temperatures.
5.1.1 Comparison with Previous Work
As noted by García-Alvarez et al. (2005), the DEM for AB Dor is comparable with that reported recently by Sanz-Forcada et al. (2003) based on XMM-Newton and Chandra observations. These authors obtained a slightly smoother increase in emission measure with rising temperature for , but a similar peak at and sharp decrease for the higher temperatures, . Similar DEM shapes have been derived based on EUVE and ASCA observations of AB Dor obtained in 1993 November by Rucinski et al. (1995) and Mewe et al. (1996); these authors also note that the results are quite sensitive to the coronal abundances adopted.
Singh et al. (1999) estimated the DEM for Speedy Mic using a 6th order Chebyshev polynomial method applied to an ASCA observation. While ASCA spectra alone do not possess much temperature resolution, the single broad DEM peaking at and also showing some evidence for plasma up to temperatures , is qualitatively similar to our result.
To our knowledge, there exist no other DEM analyses of Rst 137B by other authors with which to compare our temperature structure results. In general, the very limited information from earlier observations indicates that the DEMs themselves are not subject to large secular changes for these active stars.
There are no striking features to the DEMs of any of these stars that distinguish them from those of similar fast rotators. Other examples, such PZ Tel (rotation period d) and YY Gem (d), show DEMs that peak at with and extension indicating significant plasma at temperatures a factor of 2 or so higher (Stelzer et al., 2002; Argiroffi et al., 2004). These characteristics are slightly more similar to those of AB Dor than Speedy Mic and Rst 137B.
5.2 Coronal Abundances
Our results for the element abundances of AB Dor, Speedy Mic and Rst 137B are summarized in Table 3. We only list statistical uncertainties here. Details on methods used for the formal error estimates are given by García-Alvarez et al. (2005). The abundance ratios derived from temperature-insensitive line ratios (see §4.4) are listed in Table 4. Within expected uncertainty ranges these values are in agreement with, and provide verification for, the ones derived from the DEMs (Table 3), with the exception of the ratios involving Fe. As noted by Drake et al. (2007a), however, these ratios are likely to exhibit larger systematic errors owing to a less optimum coincidence of the different line contribution functions as a function of temperature. In Fig. 4 we have plotted the derived abundances, relative to the adopted stellar photospheric values (essentially the mixture of Asplund et al. (2005), with the exception of Ne for which we adopt the Drake & Testa (2005) value, as discussed earlier), in order of element FIP.
All three stars show some evidence for what has become know as an “inverse-FIP effect”, with depletion of the low FIP elements (10 eV) relative to photospheric values (e.g. Brinkman et al., 2001). We also note a slightly lower Ne abundance with respect to the Ne/O ratio of Drake & Testa (2005) for all three stars; this is most pronounced for Rst 137B and AB Dor. It can be seen from comparison of the Ne/O ratios obtained from DEM modelling and temperature-insensitive line diagnostics (Table 4) that the former method tends to arrive at a slightly lower Ne abundance than the latter. Uncertainties in both methods are of order 0.1 dex (see also Drake et al., 2007b), and the current discrepency is not beyond the bounds of the systematic errors of the two approaches. A comparison between the results from these methods in general is given in García-Alvarez et al. (2005).
The coronal abundances derived for AB Dor are in good agrement with those reported in the literature (see García-Alvarez et al., 2005, and references therein). The coronal abundances derived for Speedy Mic are in reasonable agrement with the only ones reported in the literature for this object (Singh et al., 1999). The latter values were obtained using low spectral resolution ASCA observations. To our knowledge, there are no other coronal abundance studies of Rst 137B for comparison.
Despite Mg, Fe and Si having very similar FIP, Speedy Mic and Rst 137B show much lower Fe abundances than Si and Mg compared with AB Dor. This effect has also been seen in other coronal abundance studies, as summarised by Drake (2003) who suggested gravitational settling of the heavier Fe ions as a possible explanation. We discuss this further below.
6 Coronal Temperature Structure and Chemical Composition in the Saturation-Supersaturation Regime
6.1 Temperature Structure
It has been especially emphasised in the context of the solar corona that derived DEMs can be quite sensitive to the lines used for their derivation and to the uncertainties in the atomic data used. The best way to investigate systematically any trends in temperature structure with activity is therefore to use DEMs derived from observations made with the same instrumentation and line set. Our sample of three stars severely limits any such discussion, though two possible trends are apparent.
The slopes in the derived DEMs on the low temperature side of their maxima follow very approximately the relation DEM, DEM and DEM for AB Dor, Speedy Mic and Rst 137B respectively. This trend is in the direction of decreasing rotation period, and Rossby number (see below). Furthermore, it is apparent that the the amount of plasma present at falls off in the same order. Combined, the impression is that the ratio of material at hot () and cooler () temperatures tends to decrease with increasing saturation.
In order to compare these sparse, but systematically derived, results with those of other stars, we have computed the temperature-sensitive index , which we define as the ratio of the DEM in the “high” temperature range (=6.9-7.6) to the total DEM (=6.2-7.6), for a larger sample of rapid rotators culled from analyses in the literature. While a fairly coarse representation of DEM, this temperature index should be quite insensitive to the details of the different methods and data used to derive it. The sample of stars investigated is listed in Table 5, together with their relevant properties.
Since we are studing stars of different spectral type, it is also instructive to use the Rossby number—the ratio of the rotational period to the convective turnover time —instead of the rotational period in order to compare the behaviour of their coronal structure and chemical composition. Durney & Latour (1978) showed that the Rossby number is closely related to the dynamo number for a fluid and is expected to scale directly with the generation of magnetic flux. Noyes et al. (1984) first demonstrated the tight correlation between the Ca II H and K chromospheric activity indicators and stellar Rossby number, and the correlation also holds through to coronal activity indicators such as X-ray luminosity (see, e.g. Randich, 1998). The ratio is a function of stellar mass, and saturation will start to be seen at progressively longer rotation periods for stars with lower masses. According to Randich (1998), supersaturated stars from open cluster data have Rossby numbers log (Randich, 1998). Therefore, Speedy Mic and Rst 137B are in principle included in this range, while AB Dor sits near the saturated-supersaturated boundary region (see Table 1).
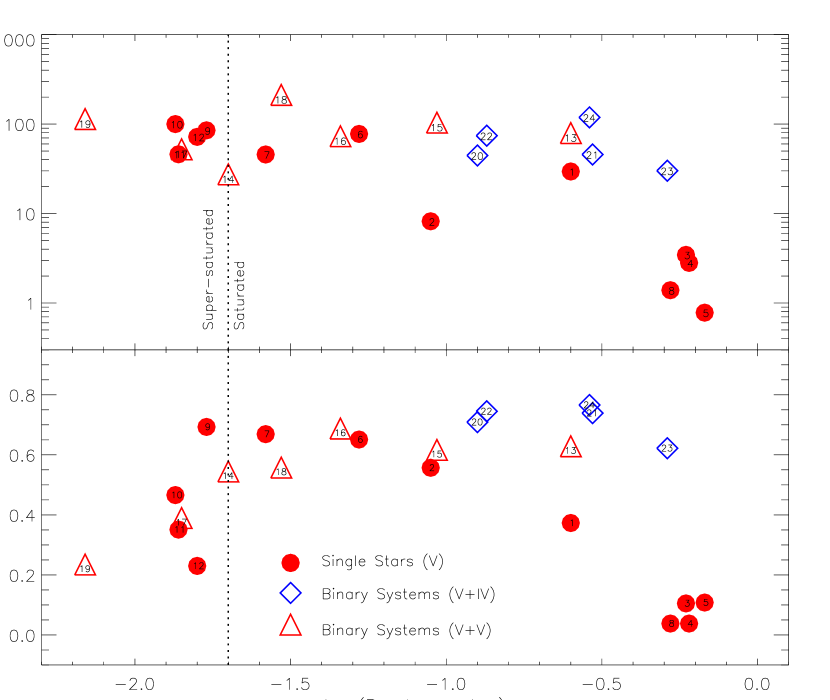
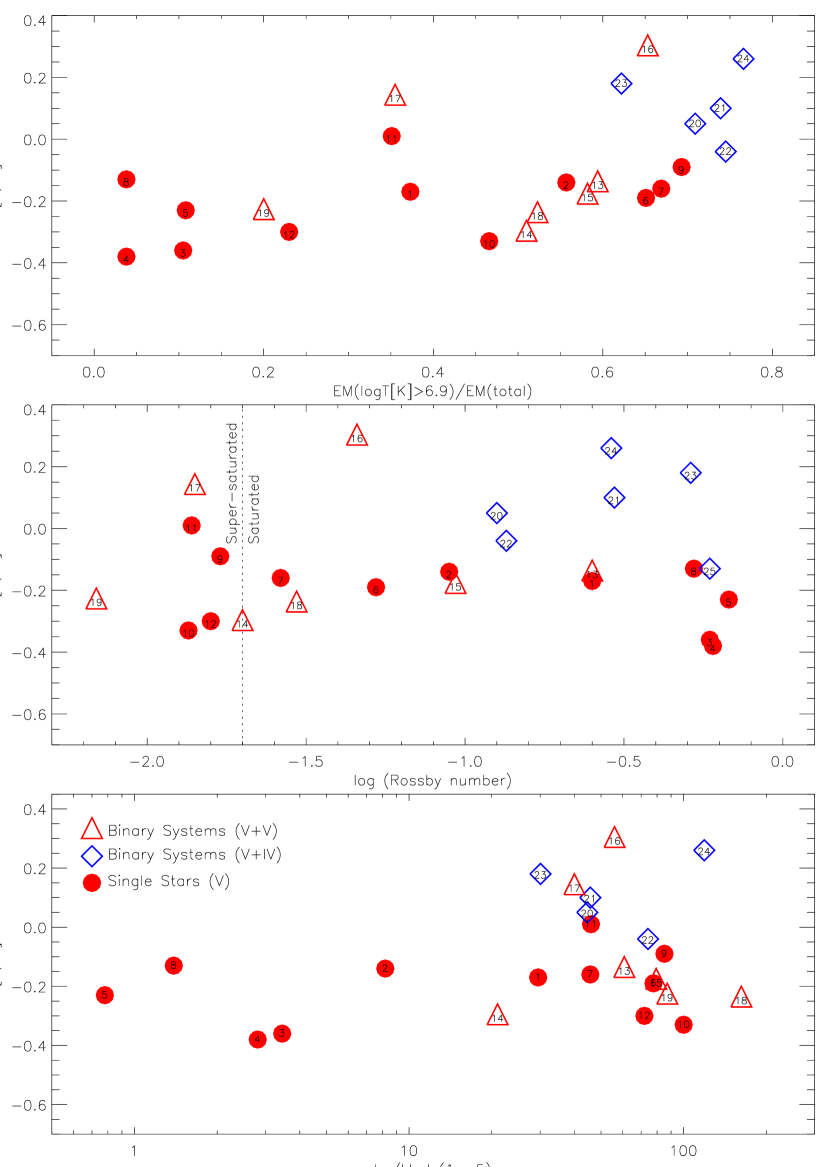
In Fig 5 we show both (upper panel) and (lower panel) vs Rossby number for the sample of stars in Table 1. The values for this sample do not exhibit any evidence for the supersaturation effect, although a very clear saturation plateau at the canonical value is readily apparent. This lack of supersaturation signature in field stars was pointed out by Randich (1998), and also characterises the sample of young cluster and field stars studied recently by Jeffries & Maxted (2005). Thus, while Speedy Mic and Rst 137B are within the regime of supersaturation, their indices are representative of the canonical saturated regime.
Despite the lack of supersaturation signature in , the lower panel of Fig 5 indicates different behaviour in thermal structure. As the Rossby number decreases and approaches the saturated-supersaturated boundary region, the emission measure at the “high” temperature range increases relative to the total emission measure. However, once the supersaturated region is reached this trend inverts, showing a decline in the emission measure of plasma at high temperatures. Thus, the supersaturation boundary that is apparent through a decline in past a critical Rossby number of in some open clusters (Prosser et al., 1996; Randich, 1998), but appears not to be present in field stars, does seem to be marked in the latter sample by this transition to a somewhat cooler dominant corona.
Randich (1998) suggested, as a possible explanation for supersaturation in Lx, that very rapid rotation could lead to a substantially higher coronal temperature and to the shift of the DEM out of the ROSAT passband. However, our DEM results for AB Dor, Speedy Mic and Rst 137B, in addition to the indices for the sample of stars in Table 5, show little evidence for substantial amounts of plasma at temperatures higher than =7.1; the opposite trend is observed and essentially rules out this hypothesis. Marino et al. (2003) reached a similar conclusion for the supersaturated star VXR45 based on an XMM-Newton observation.
Since the stars in our sample do not exhibit obvious supersaturation characteristics, any clear significance of the results in the context of other hypotheses attempting to explain the supersaturation phenomenon is not obvious. The rate of magnetic energy dissipation in the coronae of our saturated and supersaturated stars, as gauged by the X-ray to bolometric luminosity, is essentially the same; rather, it is a fairly subtle difference in the properties of this dissipation that gives rise to different coronal temperatures.
We also note that rapid rotation can give rise to a significant reduction in the effective surface gravity at lower stellar latitudes; in this context, the shift in plasma toward cooler temperatures in the supersaturated regime goes contrary to expected scaling of increasing coronal temperature with decreasing surface gravity for hydrostatic models (e.g. Jordan & Montesinos, 1991). However, direct X-ray spectroscopic evidence based on Chandra HETG observations of AB Dor suggests that very active stellar coronae are indeed pole-dominated, as has been hinted by the presence of large polar starspots (Drake et al., 2007a), in which case the effects of centrifugal forces would be lessened to some degree.
One further plausible culprit for influencing coronal plasma temperature in otherwise similar stars is the chemical composition through its influence on the radiative loss function. As we discuss below, there are some quite wide variations in composition within the sample of stars condidered. However, none of these appear to show a significant correlation with coronal temperature past the saturation-supersaturation boundary.
6.2 Coronal Abundances
In order to search for trends in coronal abundances with activity parameters, we have also compared results derived here with other results obtained for slightly “slower” rotators by ourselves and other workers. These results are summarised in Table 5. Elements considered are O, Mg, Si and Fe. While other elements, such as S and Ar, are also very interesting for abundance studies based on FIP or other parameters, the He-like and H-like ions are not easily detected in cooler coronae and it is difficult to accrue a meaningful sample from the current literature. We do not discuss Ne here as we found its behaviour to follow closely that of O in the star sample considered here; this is consistent with the study of Drake & Testa (2005) who found that a ratio Ne/O by number represented well a sample of 21 mostly active stars.
All abundances are expressed relative to the solar mixture recommended by Asplund et al. (2005), in the usual spectroscopic bracket notation. In the following discussion it should, as usual, be borne in mind that the underlying stellar photospheric abundances can differ substantially from solar values; more important are differences relative to the solar mixture (ie cases where, for elements A and B, [A/B]). We note cases where this is relevant in the apppropriate points in the discussion below.
6.2.1 [Fe/H]
The Table 5 sample confirms nicely the trend of coronal [Fe/H] with activity indices. A relationship between Fe abundance and activity was first suggested by Drake et al. (1997) and Drake (1998) based on early ASCA and EUVE results, and has since been further fleshed-out based on Chandra and XMM-Newton observations of varied samples (e.g. Audard et al., 2003; Güdel, 2004), as well as a study of solar-like stars covering a range of activity (Telleschi et al., 2005). In Figure 6 we illustrate coronal [Fe/H] for the sample as a function of , Rossby number, and the DEM temperature-sensitive index . The latter relation shows an obvious, albeit scattered, correlation of decreasing [Fe/H] with increasing hot emission measure fraction, as expected based on the earlier work cited above. Coronal temperature might be regarded only as a proxy indicator of stellar activity—it is observed to correlate well with for example (Schmitt, 1990)—and the trends of [Fe/H] with and Rossby number are indeed more direct and interesting.
The relation with shows a clear trend of declining iron abundance with increasing activity level, with a break in behaviour at between shallow and steep declines at low and higher activity levels, respectively. Can any of this trend be attributed to underlying stellar Fe abundances? Among thin disk stars, age metallicity effects would act in the opposite direction to that observed: younger, more active stars should have higher, not lower, metal abundances. Moreover, the age spread for stars considered here (a few Gyr or less) is also small for large metallicity differences to be present. It is possible, however, that some of the binaries could belong to the thick disk population for which lower metallicities would not be unusual.
In the crowded region, stellar metallicity might also be expected to play a role in the large variation of coronal [Fe/H]. However, the strong trend here toward lower coronal metallicity with higher is shared among single stars and binary stars of both evolved and unevolved type. Of the single dwarfs, noteable objects with large differences in coronal [Fe/H] are AB Dor and its companion Rst 137B, and the group of intermediate activity stars Cet, Eri, Ori and UMa. All these stars have measured photospheric metallicities within dex of solar (see Table 6). In the middle of the range lie the young Pleiades Moving Group G dwarfs 47 Cas B and EK Dra, whose photospheric compositions are not expected to deviate from local cosmic values. EK Dra then appears to have an unmodified coronal Fe abundance, while that of 47 Cas B might be very slightly depleted. The factor of 3 difference in coronal [Fe/H] of these stars cannot be attributed to photospheric abundance differences and must be the result of chemical fractionation in the outer atmospheres of the more active stars in which Fe is quite strongly depleted.
The relation with Rossby number also supports the above conclusion. A similar correlation among active dwarfs was reported earlier by Singh et al. (1999) based on low resolution ASCA spectra. The dwarf single and binary stars follow the clear trend of decreasing Fe abundance with increasing activity (decreasing Rossby number) elucidated as a function of , but here four of the RS CVn-type binaries are separated from the group (HR 1099, UX Ari, VY Ari and II Peg). It is tempting to ascribe this to lower photospheric Fe abundances: II Peg has been studied in detail by Berdyugina et al. (1998) and Ottmann et al. (1998) who found [M/H], and , repsectively, while the subgiant of the HR 1099 binary appears quite Fe-poor in the Li study by Randich et al. (1994) (though this latter study estimated [Fe/H]=0 for the G dwarf secondary). However, Ottmann et al. (1998) found essentially solar Fe for VY Ari. The reason for the separation of these RS CVn-type stars from the group in the [Fe/H] vs. Rossby number plot then appears to be the result of the different convection zone parameters of these somewhat evolved stars: while it works well for dwarfs, Rossby number is not a fundamental scaling agent for the coronal Fe content of stars of different luminosity class.
Beyond the supersaturation limit, there appears to be a greater scatter in [Fe/H] among dwarfs than at larger Rossby number. The data appear to be suggestive of a sharper drop in [Fe/H] as this limit is reached. However, since the M dwarfs AD Leo, EV Lac, and YY Gem all lie above the earlier type active K-dwarfs Speedy Mic and Rst 137B in this plot, the spread here might also be attributed to spectral type, and consequently to differences in convection zone parameters.
6.2.2 [O/H] and [O/Fe]
Search for trends in O abundance with stellar activity indicators carries the potential for systematic errors correlated with the index being examined. The available O feature in stellar X-ray spectra are the He-like and H-like resonance whose emissivity functions peak at T=6.3 and 6.5, respectively. As noted above, dominant plasma temperatures increase with increasing activity, and lie at in active stars. Errors in understanding DEMs at lower temperatures where significant O VII and O VIII flux can originate then have the potential to skew abundance-activity relations.
Additionally, owing to the different contributions to metal enrichment of the Galaxy through its history, comparison of O and Fe abundances is further complicated by unknown or uncertain intrinsic metallicity, and even whether stars belong to thin or thick disk populations. Bensby et al. (2004) show that local thick disk stars have higher [O/Fe] by dex than those of the local thin disk at moderate metal deficiencies ([Fe/H]); superimposed on both is the usual trend of increasing [O/Fe] with declining [Fe/H]. This should not be a problem for our young, single stars, but must be borne in mind when considering the active binaries whose ages are much less certain.
We illustrate [O/H] as a function of the temperature index , and Rossby number in Figure 7. If the RS CVn stars are excluded, there is a weak trend in the first of these of increasing [O/H] with increasing . A similar trend in Ne abundance is also apparent in the literature survey of Güdel (2004)—as expected based on the constancy of the Ne/O ratio noted earlier. Is this temperature trend a result of systematic error, underlying stellar composition, or fractionation? The relation with shows the single stars to scatter about [O/H], with the RS CVn-type binaries lying systematically above this; dwarf binaries are instead scattered over a much larger range. We emphasise that we have referred the [O/H] values to the solar value recommended by Asplund et al. (2004); were we to adopt that of Grevesse & Sauval (1998), the above values would be dex lower. The photospheric O abundances for the G dwarfs Ori and UMa are by differential analysis (ie essentially free from modelling systematic errors) essentially solar yet have coronae apparently deficient in O by factors of more than 2; it seems difficult to escape the conclusion that O must be depleted in the coronae of these stars. Similar conclusions were reached by Wood & Linsky (2006) in a detailed study of lower activity K dwarfs.
It is plausible that some of the range in [O/H] is due to underlying stellar composition. In the cases of II Peg and V851 Cen, photospheric evidence suggests mild metal paucity. Were these to be thick disk objects of near-solar metallicity the survey of Bensby et al. (2004) suggests an abundance [O/H] would not be too unreasonable.
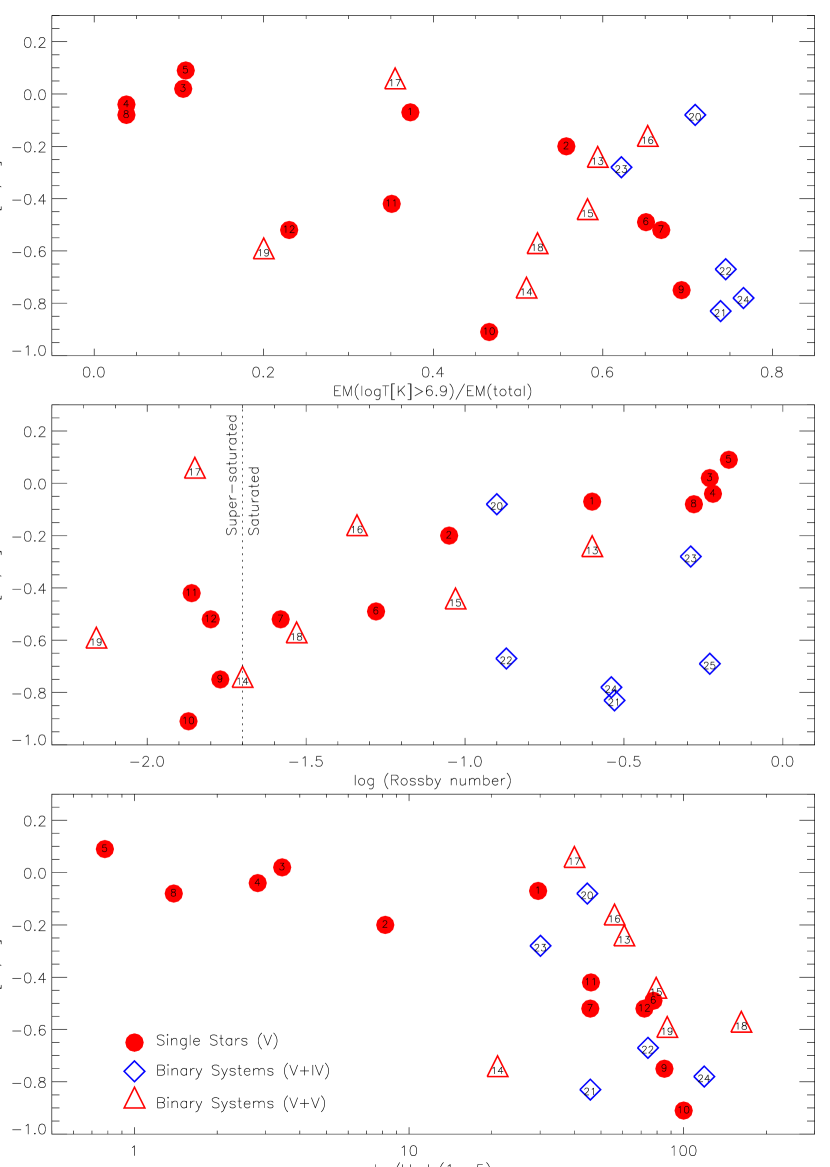
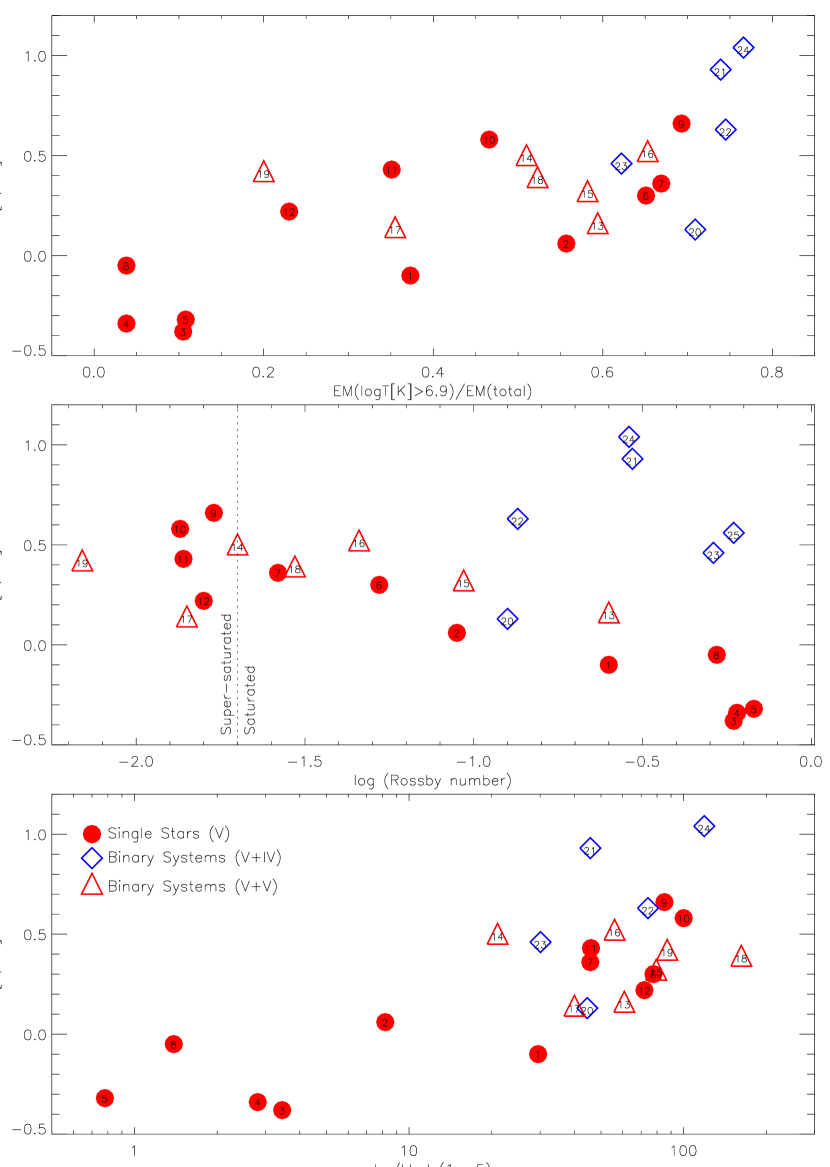
The [O/Fe] ratio to some extent alleviates scatter due to global metallicity differences between stars; these are illustrated in Figure 8. The strong trends with all three activity indices are readily apparent; similar trends in [O/Fe] with coronal temperature were also noted for RS CVn-types and a mixed sample by Audard et al. (2003) and Güdel (2004), respectively. Most remarkable is the tight relation with Rossby number in which the single and active binary dwarfs follow essentially the same increase in [O/Fe] with decreasing Rossby number. The trend is seen to break at the supersaturation limit, beyond which there is no further increase and some suggestion that [O/Fe] either saturates or perhaps declines slightly.
The RS CVn-type binaries, with the exception of AR Lac, show the same conspicuous separation in [O/Fe] as they do in both [Fe/H] and [O/H], only exacerbated by the ratio combination. As a function of , UX Ari and II Peg stand a factor of above the scatter among the most active dwarf stars, and an order of magnitude above the dwarfs of equivalent Rossby number. We conclude that the physical underpinning of these observations must depend strongly on spectral type, and in particular on luminosity class. It is also possible that the different behavior of the RS CVn-types is somehow a result of the influence of their binarity on chemical fraction processes. That coronal plasma temperature is not the key underlying factor is demonstrated by the recent study of coronal abundances in giant stars by García-Alvarez et al. (2006): these stars have similar coronal temperatures to the active dwarfs and RS CVn-types, yet exhibit either unmodified or low [O/Fe] ratios typical of a solar-like FIP effect.
If we exclude possible contributions to the observed range in coronal O/Fe from intrinsic stellar scatter, coronal activity differences among the sample appear to give rise to a variation in O/Fe by a factor of 10.
While it is premature to speculate on fractionation mechanisms based on the dataset considered here, it seems possible that the Alvèn wave pondermotive force model considered by Laming (2004) offers some potential here. Laming (2004) found that the fractionation effect produced was quite strongly dependent on the wave propagation and reflection properties of the chromosphere and lower corona, and on the Alfvénic turbulence frequency spectrum—one might expect both of these to be dependent on spectral type, rotation rate, and perhaps also tidal distortion.
6.3 [Mg/Fe] and [Si/Fe]
Pursuit of these ratios is potentially important: any coronal fractionation between the Mg-Si-Fe trio is interesting because these elements have very similar FIPs. Evidence that Fe appears systematically low relative to Si and Mg in some stars was discussed by Drake (2003), who suggested this as a possible diagnostic of gravitational settling of the twice as heavy Fe relative to lighter Mg and Si. Acting against relative settling of heavier ions is mixing by flows and turbulence, and kinetic effects such as thermal diffusion that act in a temperature gradient to pull heavier ions toward hotter temperatures. Constraints on, or measurements of, gravitational settling might then provide useful insights into coronal loop and plasma flow properties.
As in the case of [O/Fe] noted above, ratios of the -elements Mg and Si to that of Fe are also prone to scatter and systematic bias as a result of Galactic chemical evolution. Further systematic errors are possible in the evaluation of the Si/Fe ratio owing to the different temperatures over which the dominant Fe lines (weighted largely by Fe XVII at , though higher charge states are often detected) and Si He-like and H-like lines () are formed.
Among our sample studied here, there are no obvious trends of Mg/Fe or Si/Fe with activity parameters, except perhaps an indication of declining Mg/Fe with coronal temperature index . One conspicuous outlier is II Peg, which has both Mg/Fe and Si/Fe of nearly three times the solar value; as noted earlier in the context of its high O/Fe ratio, its mild photospheric metal deficiency suggests that this might at least in part be explained by enhanced photospheric -elements. The ratios in the other stars are also skewed toward values larger than unity, though by only 0.1 dex or so. This also could simply reflect photospheric values: Allende Prieto et al. (2004) note that the Sun appears deficient by roughly 0.1 dex in O, Si, Ca, in addition to some other less abundant elements compared to its immediate neighbors with similar iron abundances.
Such a skew might also be due simply to systematic errors of measurement rather than other mechanisms such as gravitational settling. However, as we noted earlier, we find Speedy Mic and Rst 137B to have larger coronal Mg/Fe and Si/Fe ratios than AB Dor from a study involving the same lines and analysis techniques that should minimise systematic errors. These results suggest that some fractionation is at work.
Disentangling all the possible contributions to the observed Mg/Fe and Si/Fe ratios is well beyond our current study and requires more detailed photospheric abundances. More detailed investigation of these ratios in a wider sample of stars would be well-motivated.
7 Conclusions
AB Dor, Speedy Mic and Rst 137B represent young ( 100 Myr) rapidly rotating (P12 hr) late-type stars lying at the saturated-supersaturated corona boundary region. Based on an analysis of high resolution Chandra X-ray spectra of these stars and subsequent comparison with results for other active stars culled from the literature we draw the following conclusions.
-
1.
The temperature structures of AB Dor, Speedy Mic and Rst 137B all peak at [K]7.0-7.1, though the overall DEM shapes are slightly different. If the DEM trends observed here in only three stars can be generalised, they hint that as supersaturation is reached the DEM slope below the temperature of peak DEM becomes shallower, while the DEM drop-off above this temperature becomes more pronounced.
-
2.
In the context of the larger stellar sample, we observe that in dwarf single and binary stars coronal thermal structure shows an increase in the emission of plasma at high temperatures () as the Rossby number decreases and approaches the saturated-supersaturated boundary. However, once the supersaturated region is reached this trend inverts; supersaturated stars maintain a smaller fraction of coronal plasma at and above 10 million K than stars of higher Rossby number. This result is consistent with the tentative generalised DEM behaviour outlined in (1).
-
3.
All three of the stars studied in detail here show evidence for an inverse of the solar-like FIP effect, with smaller coronal abundances of the low FIP elements Mg, Si and Fe, relative to the high FIP elements S, O and Ne. This is consistent with existing coronal abundance studies of other active stars.
-
4.
The stellar sample shows that coronal Fe abundance is inversely correlated with , and for dwarfs is also well-correlated with Rossby number. The Fe abundance is seen to decline slowly with rising , but declines sharply at .
-
5.
Coronal O abundances average at values of [O/H]. Comparison of coronal and photospheric values for some of the sample suggests that active stellar coronae are in general slightly depleted in O relative to their photospheres.
-
6.
The are no obvious trends of O abundance with activity indicators. Derived coronal O abundances are perhaps very weakly correlated with the coronal temperature index with hotter coronae possibly exhibiting larger O abundances. RS CVn-type binaries exhibit systematically larger O abundances than dwarfs; this could be partially due to galactic evolutionary differences in [O/Fe] between dwarf and RS CVn samples.
-
7.
The coronal O/Fe ratio for dwarfs shows a strong trend of increasing O/Fe with decreasing Rossby number, and appears to saturate at the supersaturation boundary with a value of [O/Fe]. Similar correlations are seen with O/Fe increasing as a function of coronal temperature index, as revealed in earlier work, and with increasing . The range in O/Fe variations attributable to differences in coronal properties among the sample is about a factor of 10.
References
- Allende Prieto et al. (2004) Allende Prieto, C., Barklem, P. S., Lambert, D. L., & Cunha, K. 2004, A&A, 420, 183
- Argiroffi et al. (2004) Argiroffi, C., Drake, J. J., Maggio, A., Peres, G., Sciortino, S., & Harnden, F. R. 2004, ApJ, 609, 925
- Asplund et al. (2005) Asplund, M., Grevesse, N., & Sauval, A. J. 2005, in ASP Conf. Ser. 336: Cosmic Abundances as Records of Stellar Evolution and Nucleosynthesis, 25
- Asplund et al. (2004) Asplund, M., Grevesse, N., Sauval, A. J., Allende Prieto, C., & Kiselman, D. 2004, A&A, 417, 751
- Audard et al. (2003) Audard, M., Güdel, M., Sres, A., Raassen, A. J. J., & Mewe, R. 2003, A&A, 398, 1137
- Audard et al. (2004) Audard, M., Telleschi, A., Güdel, M., Skinner, S. L., Pallavicini, R., & Mitra-Kraev, U. 2004, ApJ, 617, 531
- Ball et al. (2007) Ball, B., García-Alvarez, D., Drake, J. J., Lin, L., & Kashyap, V. L. 2007, ApJ, submitted
- Barnes (2005) Barnes, J. R. 2005, MNRAS, 364, 137
- Barnes et al. (2001) Barnes, J. R., Collier Cameron, A., James, D. J., & Donati, J.-F. 2001, MNRAS, 324, 231
- Bensby et al. (2004) Bensby, T., Feltzing, S., & Lundström, I. 2004, A&A, 415, 155
- Berdyugina et al. (1998) Berdyugina, S. V., Berdyugin, A. V., Ilyin, I., & Tuominen, I. 1998, A&A, 340, 437
- Boesgaard (1989) Boesgaard, A. M. 1989, ApJ, 336, 798
- Brinkman et al. (2001) Brinkman, A. C., et al. 2001, A&A, 365, L324
- Bromage et al. (1992) Bromage, G. E., Kellett, B. J., Jeffries, R. D., Innis, J. L., Matthews, L., Anders, G. J., & Coates, D. W. 1992, in ASP Conf. Ser. 26: Cool Stars, Stellar Systems, and the Sun, 80
- Cayrel et al. (1985) Cayrel, R., Cayrel de Strobel, G., & Campbell, B. 1985, A&A, 146, 249
- Collier Cameron et al. (1988) Collier Cameron, A., Bedford, D. K., Rucinski, S. M., Vilhu, O., & White, N. E. 1988, MNRAS, 231, 131
- Collier-Cameron & Foing (1997) Collier-Cameron, A. & Foing, B. H. 1997, The Observatory, 117, 218
- Cutispoto et al. (1997) Cutispoto, G., Kurster, M., Pagano, I., & Rodono, M. 1997, Informational Bulletin on Variable Stars, 4419, 1
- Dere et al. (2001) Dere, K. P., Landi, E., Young, P. R., & Del Zanna, G. 2001, ApJS, 134, 331
- Drake (1998) Drake, J. J. 1998, ApJ, 496, L33
- Drake (2003) Drake, J. J. 2003, Advances in Space Research, 32, 945
- Drake (2004) —. 2004, Chandra News
- Drake et al. (2001) Drake, J. J., Brickhouse, N. S., Kashyap, V., Laming, J. M., Huenemoerder, D. P., Smith, R., & Wargelin, B. J. 2001, ApJ, 548, L81
- Drake et al. (2007a) Drake, J. J., Chung, S.-M., Kashyap, V. L., & García-Alvarez, D. 2007a, ApJ, submitted
- Drake et al. (2007b) Drake, J. J., Laming, J. M., Lin, L., & Kashyap, V. L. 2007b, ApJ, submitted
- Drake et al. (1997) Drake, J. J., Laming, J. M., & Widing, K. G. 1997, ApJ, 478, 403
- Drake & Smith (1993a) Drake, J. J. & Smith, G. 1993a, ApJ, 412, 797
- Drake & Smith (1993b) —. 1993b, ApJ, 412, 797
- Drake & Testa (2005) Drake, J. J. & Testa, P. 2005, Nature, 436, 525
- Durney & Latour (1978) Durney, B. R. & Latour, J. 1978, Geophysical and Astrophysical Fluid Dynamics, 9, 241
- Favata et al. (2000) Favata, F., Reale, F., Micela, G., Sciortino, S., Maggio, A., & Matsumoto, H. 2000, A&A, 353, 987
- Güdel et al. (2001) Güdel, M., Audard, M., Briggs, K., Haberl, F., Magee, H., Maggio, A., Mewe, R., Pallavicini, R., & Pye, J. 2001, A&A, 365, L336
- García-Alvarez et al. (2006) García-Alvarez, D., Drake, J. J., Ball, B., Lin, L., & Kashyap, V. L. 2006, ApJ, 638, 1028
- García-Alvarez et al. (2005) García-Alvarez, D., Drake, J. J., Lin, L., Kashyap, V. L., & Ball, B. 2005, ApJ, 621, 1009
- Gehren et al. (1999) Gehren, T., Ottmann, R., & Reetz, J. 1999, A&A, 344, 221
- Grevesse & Sauval (1998) Grevesse, N. & Sauval, A. J. 1998, Space Science Reviews, 85, 161
- Güdel (2004) Güdel, M. 2004, A&A Rev., 12, 71
- Güdel et al. (2001) Güdel, M., Audard, M., Magee, H., Franciosini, E., Grosso, N., Cordova, F. A., Pallavicini, R., & Mewe, R. 2001, A&A, 365, L344
- Hempelmann et al. (1995) Hempelmann, A., Schmitt, J. H. M. M., Schultz, M., Ruediger, G., & Stepien, K. 1995, A&A, 294, 515
- Huenemoerder et al. (2003) Huenemoerder, D. P., Canizares, C. R., Drake, J. J., & Sanz-Forcada, J. 2003, ApJ, 595, 1131
- Huenemoerder et al. (2001) Huenemoerder, D. P., Canizares, C. R., & Schulz, N. S. 2001, ApJ, 559, 1135
- Huenemoerder et al. (2006) Huenemoerder, D. P., Testa, P., & Buzasi, D. L. 2006, ApJ, 650, 1119
- Innis et al. (1988) Innis, J. L., Coates, D. W., & Thompson, K. 1988, MNRAS, 233, 887
- Jardine (2004) Jardine, M. 2004, A&A, 414, L5
- Jardine & Unruh (1999) Jardine, M. & Unruh, Y. C. 1999, A&A, 346, 883
- Janson et al. (2007) Janson, M., Brandner, W., Lenzen, R., Close, L., Nielsen, E., Hartung, M., Henning, T. & Bouy, H. 2007, A&A, 462, 615
- Jeffries (1993) Jeffries, R. D. 1993, MNRAS, 262, 369
- Jeffries & Maxted (2005) Jeffries, R. D. & Maxted, P. F. L. 2005, Astronomische Nachrichten, 326, 944
- Jordan & Montesinos (1991) Jordan, C. & Montesinos, B. 1991, MNRAS, 252, 21P
- Kashyap & Drake (1998) Kashyap, V. & Drake, J. J. 1998, ApJ, 503, 450
- Kashyap & Drake (2000) —. 2000, Bulletin of the Astronomical Society of India, 28, 475
- King et al. (2000) King, J. R., Soderblom, D. R., Fischer, D., & Jones, B. F. 2000, ApJ, 533, 944
- Kuerster et al. (1997) Kuerster, M., Schmitt, J. H. M. M., Cutispoto, G., & Dennerl, K. 1997, A&A, 320, 831
- Laming (2004) Laming, J. M. 2004, ApJ, 614, 1063
- Lim (1993) Lim, J. 1993, ApJ, 405, L33
- Lopez-Santiago et al. (2006) López-Santiago, J., Montes, D., Crespo-Chacón, I. & Fernández-Figueroa, M. J. 2006, ApJ, 643, 1160
- Luhman et al. (2005) Luhman, K. L., Stauffer, J. R., & Mamajek, E. E. 2005, ApJ, 628, L69
- Maggio et al. (2004) Maggio, A., Drake, J. J., Kashyap, V., Harnden, Jr., F. R., Micela, G., Peres, G., & Sciortino, S. 2004, ApJ, 613, 548
- Maggio et al. (2000) Maggio, A., Pallavicini, R., Reale, F., & Tagliaferri, G. 2000, A&A, 356, 627
- Makarov (2003) Makarov, V. V. 2003, AJ, 126, 1996
- Marino et al. (2003) Marino, A., Micela, G., Peres, G., & Sciortino, S. 2003, A&A, 407, L63
- Martin & Brandner (1995) Martin, E. L. & Brandner, W. 1995, A&A, 294, 744
- Mazzotta et al. (1998) Mazzotta, P., Mazzitelli, G., Colafrancesco, S., & Vittorio, N. 1998, A&AS, 133, 403
- Mewe et al. (1996) Mewe, R., Kaastra, J. S., White, S. M., & Pallavicini, R. 1996, A&A, 315, 170
- Montes et al. (2001) Montes, D., López-Santiago, J., Gálvez, M. C., Fernández-Figueroa, M. J., De Castro, E., & Cornide, M. 2001, MNRAS, 328, 45
- Moos et al. (2000) Moos, H. W., et al. 2000, ApJ, 538, L1
- Morel et al. (2003) Morel, T., G., M., Favata, F., Katz, D., & Pilliteri, I. 2003, A&A
- Naftilan et al. (1992) Naftilan, S. A., Sandmann, W. S., & Pettersen, B. R. 1992, PASP, 104, 1045
- Nordström et al. (2004) Nordström, B., Mayor, M., Andersen, J., Holmberg, J., Pont, F., Jørgensen, B. R., Olsen, E. H., Udry, S., & Mowlavi, N. 2004, A&A, 418, 989
- Noyes et al. (1984) Noyes, R. W., Hartmann, L. W., Baliunas, S. L., Duncan, D. K., & Vaughan, A. H. 1984, ApJ, 279, 763
- Ortega et al. (2007) Ortega, V. G. and Jilinski, E. and de La Reza, R. & Bazzanella, B. 2007, MNRAS, 377, 441
- Osten et al. (2003) Osten, R. A., Ayres, T. R., Brown, A., Linsky, J. L., & Krishnamurthi, A. 2003, ApJ, 582, 1073
- Ottmann et al. (1998) Ottmann, R., Pfeiffer, M. J., & Gehren, T. 1998, A&A, 338, 661
- Pakull (1981) Pakull, M. W. 1981, A&A, 104, 33
- Perryman et al. (1997) Perryman, M. A. C., et al. 1997, A&A, 323, L49
- Prosser et al. (1996) Prosser, C. F., Randich, S., Stauffer, J. R., Schmitt, J. H. M. M., & Simon, T. 1996, AJ, 112, 1570
- Randich (1998) Randich, S. 1998, in ASP Conf. Ser. 154: Cool Stars, Stellar Systems, and the Sun, 501
- Randich et al. (1994) Randich, S., Giampapa, M. S., & Pallavicini, R. 1994, A&A, 283, 893
- Robrade & Schmitt (2005) Robrade, J. & Schmitt, J. H. M. M. 2005, A&A, 435, 1073
- Rocha-Pinto et al. (2004) Rocha-Pinto, H. J., Flynn, C., Scalo, J., Hänninen, J., Maciel, W. J., & Hensler, G. 2004, A&A, 423, 517
- Rucinski et al. (1995) Rucinski, S. M., Mewe, R., Kaastra, J. S., Vilhu, O., & White, S. M. 1995, ApJ, 449, 900
- Ryan et al. (2005) Ryan, R. D., Neukirch, T., & Jardine, M. 2005, A&A, 433, 323
- Sanz-Forcada et al. (2004) Sanz-Forcada, J., Favata, F., & Micela, G. 2004, A&A, 416, 281
- Sanz-Forcada et al. (2006) —. 2006, A&A, 445, 673
- Sanz-Forcada et al. (2003) Sanz-Forcada, J., Maggio, A., & Micela, G. 2003, A&A, 408, 1087
- Schmitt (1990) Schmitt, J. H. M. M. 1990, Advances in Space Research, 10, 115
- Schuler et al. (2004) Schuler, S. C., King, J. R., Hobbs, L. M., & Pinsonneault, M. H. 2004, ApJ, 602, L117
- Singh et al. (1999) Singh, K. P., Drake, S. A., Gotthelf, E. V., & White, N. E. 1999, ApJ, 512, 874
- Skumanich (1972) Skumanich, A. 1972, ApJ, 171, 565
- Stauffer & Hartmann (1987) Stauffer, J. R. & Hartmann, L. W. 1987, ApJ, 318, 337
- Stauffer et al. (1997) Stauffer, J. R., Hartmann, L. W., Prosser, C. F., Randich, S., Balachandran, S., Patten, B. M., Simon, T., & Giampapa, M. 1997, ApJ, 479, 776
- Stȩpień et al. (2001) Stȩpień, K., Schmitt, J. H. M. M., & Voges, W. 2001, A&A, 370, 157
- Stelzer et al. (2002) Stelzer, B., Burwitz, V., Audard, M., Güdel, M., Ness, J.-U., Grosso, N., Neuhäuser, R., Schmitt, J. H. M. M., Predehl, P., & Aschenbach, B. 2002, A&A, 392, 585
- Telleschi et al. (2005) Telleschi, A., Güdel, M., Briggs, K., Audard, M., Ness, J.-U., & Skinner, S. L. 2005, ApJ, 622, 653
- Varenne & Monier (1999) Varenne, O. & Monier, R. 1999, A&A, 351, 247
- Vilhu et al. (1989) Vilhu, O., Ambruster, C. W., Neff, J. E., Linsky, J. L., Brandenburg, A., Ilyin, I. V., & Shakhovskaya, N. I. 1989, A&A, 222, 179
- Vilhu et al. (1987) Vilhu, O., Gustafsson, B., & Edvardsson, B. 1987, ApJ, 320, 850
- Vilhu et al. (1991) Vilhu, O., Gustafsson, B., & Walter, F. M. 1991, A&A, 241, 167
- Vilhu & Linsky (1987) Vilhu, O. & Linsky, J. L. 1987, PASP, 99, 1071
- Vilhu et al. (2001) Vilhu, O., Muhli, P., Mewe, R., & Hakala, P. 2001, A&A, 375, 492
- Wood & Linsky (2006) Wood, B. E. & Linsky, J. L. 2006, ApJ, 643, 444
- Zuckerman et al. (2004) Zuckerman, B., Song, I., & Bessell, M. S. 2004, ApJ, 613, L65
Tables
| Star | Sp.Tp. | dist. | B-V | Teff | sin | log Lx/Lbol | log NR | ObsID | Date | Exp | |
|---|---|---|---|---|---|---|---|---|---|---|---|
| [pc] | [hr] | [K] | [km s-1] | [ks] | |||||||
| AB Dor | K2V | 14.9 | 0.80 | 12 | 5250 | 93 | -3 | -1.58 | 16 | 1999-10-09 | 52.3 |
| Speedy Mic | K3V | 44.4 | 0.94 | 9 | 4750 | 132 | -3 | -1.77 | 2536/3491 | 2002-04-26/27 | 35.0/35.1 |
| Rst 137B | M2V | 14.9 | 1.60 | 9 | 3250 | 50 | -3 | -1.87 | 16 | 1999-10-09 | 52.3 |
| Ion | AB Dor | Speedy Mic | Rst 137B | Transition (upper lower) | |||
|---|---|---|---|---|---|---|---|
| [Å] | [Å] | [K] | [10-14erg cm-2 s-1] | [10-14erg cm-2 s-1] | [10-14erg cm-2 s-1] | ||
| 4.733 | S XVI | 7.40 | |||||
| 5.032 | 5.039 | S XV | 7.20 | ||||
| 6.177 | 6.180 | Si XIV | 7.20 | ||||
| 6.186 | Si XIV | 7.20 | |||||
| 6.647 | 6.648 | Si XIII | 7.00 | ||||
| 8.422 | 8.425 | Mg XII | 7.00 | ||||
| 8.419 | Mg XII | 7.00 | |||||
| 9.173 | 9.169 | Mg XI | 6.80 | ||||
| 10.998 | 11.003 | Na X | 6.70 | ||||
| 12.133 | 12.132 | Ne X | 6.80 | ||||
| 12.137 | Ne X | 6.80 | |||||
| 12.283 | 12.285 | Fe XXI | 7.00 | ||||
| 13.433 | 13.447 | Ne IX | 6.60 | ||||
| 13.508 | 13.504 | Fe XIX | 6.90 | ||||
| 14.208 | 14.208 | Fe XVIII | 6.90 | ||||
| 14.203 | Fe XVIII | 6.90 | |||||
| 14.263 | 14.267 | Fe XVIII | 6.90 | ||||
| 15.013 | 15.015 | Fe XVII | 6.75 | ||||
| 16.008 | 16.007 | O VIII | 6.50 | ||||
| 16.006 | O VIII | 6.50 | |||||
| 18.973 | 18.973 | O VIII | 6.50 | ||||
| 18.967 | O VIII | 6.50 | |||||
| 21.607 | 21.602 | O VII | 6.30 | ||||
| 24.777 | 24.779 | N VII | 6.30 | ||||
| 24.785 | N VII | 6.30 |
| Elementaafootnotemark: | FIPbbfootnotemark: | AB Dor | Speedy Mic | Rst 137B |
|---|---|---|---|---|
| Na/H | 5.14 | -0.42ccfootnotemark: | -0.20ccfootnotemark: | |
| Mg/H | 7.65 | -0.51 0.03 | -0.70 0.07 | -0.58 0.08 |
| Fe/H | 7.87 | -0.52 0.04 | -0.75 0.07 | -0.91 0.08 |
| Si/H | 8.15 | -0.46 0.03 | -0.60 0.06 | -0.63 0.07 |
| S/H | 10.36 | -0.32 0.11 | ||
| O/H | 13.62 | -0.16 0.04 | -0.09 0.08 | -0.33 0.10 |
| Ne/H | 21.56 | -0.25 0.03 | -0.15 0.07 | -0.49 0.08 |
| Abundance | AB Dor | AB Doraafootnotemark: | Speedy Mic | Speedy Micaafootnotemark: | Rst 137B | Rst 137Baafootnotemark: |
|---|---|---|---|---|---|---|
| N/O | +0.37 0.09 | |||||
| O/Ne | -0.08 0.11 | +0.090.07 | -0.01 0.18 | +0.060.15 | +0.10 0.19 | +0.160.18 |
| Ne/Mg | +0.28 0.04 | +0.260.06 | +0.56 0.16 | +0.550.14 | +0.05 0.19 | +0.090.16 |
| Ne/Fe | +0.52 0.03 | +0.270.07 | +0.80 0.13 | +0.600.14 | +0.55 0.17 | +0.420.16 |
| Mg/Si | -0.06 0.04 | -0.050.06 | -0.08 0.14 | -0.100.13 | +0.01 0.26 | +0.050.15 |
| Mg/Fe | -0.19 0.05 | -0.010.07 | -0.19 0.28 | -0.050.14 | +0.21 0.35 | +0.330.16 |
| Si/S | -0.14 0.12 | -0.140.14 |
aAbundance ratios using from the DEM-reconstructions.
| ID | Single Star | SpTy (V) | Prot | log NR | log Lx/Lbol | EMlow | [Fe/H] | [O/H] | [Si/H] | [Mg/H] | [Ne/Fe] | Ref |
| 1 | EK Dra | G0V | 2.75 | -0.60 | -3.53 | .627 | -0.08 | -0.10 | -0.09 | +0.11 | +0.19 | [15] |
| 2 | 47 Cas B | G1V | 1.00 | -1.05 | -4.09 | .443 | -0.21 | -0.09 | -0.14 | -0.13 | +0.43 | [15] |
| 3 | Uma | G1V | 4.70 | -0.23 | -4.46 | .895 | +0.08 | -0.22 | -0.05 | +0.21 | -0.20 | [15] |
| 4 | Ori | G1V | 5.10 | -0.22 | -4.55 | .962 | -0.01 | -0.22 | -0.10 | +0.03 | -0.04 | [15] |
| 5 | Cet | G5V | 9.20 | -0.17 | -5.11 | .892 | +0.12 | -0.05 | +0.09 | +0.34 | +0.03 | [15] |
| 6 | PZ Tel | K0V | 0.94 | -1.28 | -3.11 | .349 | -0.49 | -0.19 | -0.55 | -0.46 | +0.56 | [1] |
| 7 | AB Dor | K2V | 0.51 | -1.58 | -3.34 | .331 | -0.52 | -0.16 | -0.46 | -0.51 | +0.67 | [5] |
| 8 | Eri | K2V | 11.03 | -0.28 | -4.86 | .962 | -0.08 | -0.13 | -0.17 | -0.10 | +0.32 | [13] |
| 9 | Speedy Mic | K3V | 0.38 | -1.77 | -3.07 | .307 | -0.75 | -0.09 | -0.60 | -0.70 | +1.00 | This work |
| 10 | Rst 137B | M2V | 0.37 | -1.87 | -3.00 | .534 | -0.91 | -0.33 | -0.63 | -0.58 | +0.82 | This work |
| 11 | AD Leo | M3V | 2.70 | -1.86 | -3.34 | .649 | -0.42 | +0.01 | -0.13 | -0.34 | +0.62 | [10] |
| 12 | EV Lac | M4V | 4.38 | -1.80 | -3.14 | .773 | -0.52 | -0.30 | -0.32 | -0.61 | +0.52 | [12] |
| ID | Binary Syst. | SpTy (V+V) | Prot | log NR | log Lx/Lbol | EMlow | [Fe/H] | [O/H] | [Si/H] | [Mg/H] | [Ne/Fe] | Ref |
| 13 | TZ CrB | F6V/G0V | 1.14 | -0.60 | -3.22 | .406 | -0.28 | -0.17 | -0.05 | +0.05 | +0.34 | [11] |
| 14 | 44 Boo | G0V/G5V | 0.28 | -1.70 | -3.67 | .490 | -0.78 | -0.33 | -0.65 | -0.67 | +0.51 | [3] |
| 15 | ER Vul | G0V/G5V | 0.69 | -1.03 | -3.10 | .418 | -0.48 | -0.61 | -0.49 | -0.36 | +0.75 | [3] |
| 16 | SV Cam | G0V/K6V | 0.59 | -1.34 | -3.25 | .347 | -0.20 | +0.27 | -0.12 | -0.04 | +0.64 | [14] |
| 17 | VW Cep | G5V/K0V | 0.25 | -1.85 | -3.40 | .645 | -0.67 | -0.06 | -0.43 | -0.33 | +0.46 | [9] |
| 18 | V471 Tau | K2V/WD | 0.52 | -1.53 | -2.79 | .477 | -0.61 | -0.27 | -0.46 | -0.53 | +0.62 | [5] |
| 19 | YY Gem | M1V/M1V | 0.81 | -2.16 | -3.06 | .800 | -0.63 | -0.26 | -0.36 | -0.65 | +0.71 | [6] |
| ID | Binary Syst. | SpTy (IV+V) | Prot | log NR | log Lx/Lbol | EMlow | [Fe/H] | [O/H] | [Si/H] | [Mg/H] | [Ne/Fe] | Ref |
| 20 | AR Lac | G2IV/K0IV | 1.98 | -0.90 | -3.35 | .291 | -0.08 | +0.05 | -0.18 | +0.16 | +0.52 | [8] |
| 21 | UX Ari | K0IV/G5V | 7.44 | -0.53 | -3.34 | .261 | -0.83 | -0.30 | -0.59 | -0.54 | +1.33 | [3] |
| 22 | HR 1099 | K1IV/G5V | 2.84 | -0.87 | -3.13 | .255 | -0.67 | -0.04 | -0.63 | -0.72 | +1.05 | [4] |
| 23 | V851 Cen | K2IV-III/? | 12.05 | -0.29 | -3.52 | .378 | -0.28 | +0.18 | -0.58 | -0.07 | +0.93 | [13] |
| 24 | II Peg | K2IV-V/? | 6.72 | -0.54 | -2.93 | .234 | -0.78 | +0.26 | -0.30 | -0.34 | +1.36 | [7] |
| 25 | VY Ari | K3IV-V | 13.20 | -0.23 | -0.13 | -0.69 | -0.58 | -0.47 | +0.96 | [2] |
aAbundances relative to solar photospheric values (Asplund
et al. 2005).
References: [1] Argiroffi et al. (2004); [2] Audard et al. (2004); [3] Ball et al. (2007);
[4] Drake et al. (2001); [5] García-Alvarez et al. (2005); [6]
Güdel et al. (2001); [7] Huenemoerder et al. (2001);
[8] Huenemoerder et al. (2003); [9] Huenemoerder et al. (2006); [10] Maggio et al. (2004);
[11] Osten et al. (2003);
[12] Robrade & Schmitt (2005); [13] Sanz-Forcada et al. (2004); [14] Sanz-Forcada et al. (2006);
[15] Telleschi et al. (2005).
| ID | Single Star | [Fe/H] | [O/H] | [Si/H] | [Mg/H] | Ref |
| 1 | EK Dra | +0.13 | [9] | |||
| 2 | 47 Cas B | (-0.05 | [7]) | |||
| 3 | Uma | +0.10 | +0.02 | +0.12 | +0.13 | [1] |
| 4 | Ori | +0.04 | +0.15 | +0.18 | +0.24 | [1] |
| 5 | Cet | -0.36 | -0.03 | -0.22 | -0.26 | [1] |
| 6 | PZ Tel | (-0.58 | [7]) | |||
| 7 | AB Dor | +0.10 | +0.07 | +0.05 | [11] | |
| 8 | Eri | -0.17 | -0.05 | -0.08 | -0.20 | [1] |
| 9 | Speedy Mic | (+0.03 | [7]) | |||
| 10 | Rst 137B | +0.10 | +0.07 | +0.05 | [4] | |
| 11 | AD Leo | -0.11 | +0.00 | [6] | ||
| 12 | EV Lac | |||||
| ID | Binary Syst. | [Fe/H] | [O/H] | [Si/H] | [Mg/H] | Ref |
| (V+V) | ||||||
| 13 | TZ CrB | |||||
| 14 | 44 Boo | (-0.41 | [7]) | |||
| 15 | ER Vul | (-0.29 | [7]) | |||
| 16 | SV Cam | |||||
| 17 | VW Cep | |||||
| 18 | V471 Tau | +0.18 | +0.20 | [10] | ||
| 19 | YY Gem | |||||
| ID | Binary Syst. | [Fe/H] | [O/H] | [Si/H] | [Mg/H] | Ref |
| (IV+V) | ||||||
| 20 | AR Lac | +0.01 | +0.10 | +0.01 | [3] | |
| 21 | UX Ari | (-1.33 | [7]) | |||
| 22 | HR 1099 | (-1.25 | [7]) | |||
| 23 | V851 Cen | -0.18 | -0.01 | +0.10 | [5] | |
| 24 | II Peg | -0.16 | -0.13 | -0.13 | [8] | |
| 25 | VY Ari | -0.03 | -0.04 | +0.04 | [8] |
aAbundances relative to solar photospheric values (Asplund
et al. 2005).
References: [1] Allende Prieto et al. (2004); [2] Drake & Smith (1993b);
[3] Gehren et al. (1999); [4] King et al. (2000); [5] Morel et al. (2003);
[6] Naftilan et al. (1992); [7] Nordström et al. (2004) [based on photometric
indices and liable to much larger uncertainties, especially for
binaries]; [8] Ottmann et al. (1998); [9] Rocha-Pinto et al. (2004);
[10] Varenne & Monier (1999); [11] Vilhu et al. (1987).