Chandra unveils a binary Active Galactic Nucleus in Mrk 463
Abstract
We analyse Chandra, XMM-Newton and HST data of the double-nucleus Ultraluminous Infrared Galaxy (ULIRG), Mrk 463. The Chandra detection of two luminous ( and erg cm-2 s-1), unresolved nuclei in Mrk 463 indicates that this galaxy hosts a binary AGN, with a projected separation of kpc ( arcsec). While the East nucleus was already known to be a Seyfert 2 (and this is further confirmed by our Chandra detection of a neutral iron line), this is the first unambiguous evidence in favour of the AGN nature of the West nucleus. Mrk 463 is therefore the clearest case so far for a binary AGN, after NGC 6240.
keywords:
galaxies: active - galaxies: Seyfert - X-rays: individual: Mrk463 - X-rays: individual: Mrk463E - X-rays: individual: Mrk463W1 Introduction
If, as commonly believed, galaxies merge hierarchically and all galactic bulges contain supermassive Black Holes (BHs), the formation of binary/multiple BHs should be therefore inevitable (e.g. Milosavljević & Merritt, 2001; Haiman & Quataert, 2004). Interestingly, the presence of binary supermassive BHs has been also invoked to account for many important aspects of the AGN phenomenon (see Komossa, 2003, for a review), i.e. the formation of the molecular torus (key ingredient of the Unified models), the difference between radio-loud and radio-quiet AGN, the distortions and the bendings in radio jets, and the random orientations of the radio jets and bi-conical narrow-line regions with respect to the rotational axes of the host galaxy disk. Furthermore, coalescing binary BHs are expected to be the most powerful sources of gravitational waves.
However, observational evidence for binary BHs is so far very rare. The first clear-cut example was found in the Ultraluminous Infrared Galaxy (ULIRG: Sanders & Mirabel, 1996), NGC 6240 (Komossa et al., 2003). The active nature of the two nuclei is unambiguous and their projected distance ( kpc) remains the shortest measured so far for such a system. A second, close binary AGN ( kpc) was later claimed in Arp 299 (Ballo et al., 2004). A system with a larger projected distance between the nuclei ( kpc) was then found in the galactic pair ESO 509-IG066 (Guainazzi et al., 2005b). Finally, Evans et al. (2007) revealed the AGN nature of the companion of the FRII radio source 3C 321.
Mrk 463 (z=0.0504) is an ULIRG with a double nucleus, Mrk 463W and Mrk 463E, and tidal tails due to a recent merger between two spiral galaxies (Mazzarella et al., 1991, and references intherein). The Eastern nucleus is commonly classified as a Seyfert 2 (e.g. Shuder & Osterbrock, 1981; Hutchings & Neff, 1989), with broad optical lines detected in polarized light (Miller & Goodrich, 1990). On the other hand, the nature of the Western nucleus is ambiguous: a Seyfert 2, a LINER or a powerful starbust galaxy are all possible (e.g. Shuder & Osterbrock, 1981; Mazzarella et al., 1991). In the X-rays, Mrk 463 was not detected by Ginga ( erg s-1: Awaki & Koyama, 1993), but it was detected in the soft X-rays by Einstein and ROSAT (Polletta et al., 1996). ASCA revealed a very absorbed spectrum (Ueno et al., 1996), confirmed by BeppoSAX, together with the detection of a strong iron line (Landi & Bassani, 2001). These results were further refined by the XMM-Newton observation (Imanishi & Terashima, 2004).
In this paper, we present a Chandra observation of Mrk 463, where the two nuclei are spatially resolved for the first time in the X-rays, performing a detailed comparison with HST optical and near infrared (NIR) data.
2 Observations and data reduction
In the following, errors correspond to the 90% confidence level for one interesting parameter (), where not otherwise stated. The adopted cosmological parameters are km s-1 Mpc-1, and (i.e. the default ones in xspec 12.3.1: Arnaud, 1996). At the distance of Mrk 463, 1 arcsec corresponds to 986 pc. In all the fits, the Galactic column density along the line of sight to Mrk 463 is included ( cm-2: Dickey & Lockman, 1990).
2.1 X-rays: Chandra and XMM-Newton
Mrk 463 was observed by Chandra on 2004, June 11 (obsid 4913), with the Advanced CCD Imaging Spectrometer (ACIS: Garmire et al., 2003). Data were reduced with the Chandra Interactive Analysis of Observations (CIAO: Fruscione et al., 2006) 3.4 and the Chandra Calibration Data Base (CALDB) 3.4.1 software, adopting standard procedures, for a final net exposure time of about 49 ks. Images were corrected for known aspect offsets, reaching a nominal astrometric accuracy of 0.6 arcsec (at the 90 per cent confidence level). Three extraction regions were used for the Chandra data: two circular regions with radius of 2 arcsec centered at the hard X-ray nuclei and a circular region with radius of 7 arcsec, encompassing all the soft X-ray extended emission, but excluding the two previous regions. Spectra were re-binned to have at least 25 counts in each bin, in order to use the statistics. Local fits were also performed in the 5.5-7.0 keV energy range with the unbinned spectra, using the Cash (1976) statistics, in order to better assess the presence of the iron lines and measure their properties. We refer the reader to Guainazzi et al. (2005a) for details on this kind of analysis.
Mrk 463 was observed by XMM-Newton on 2001, December 22 (obsid 0094401201), with the EPIC CCD cameras, the pn (Strüder et al., 2001) and two MOS (Turner et al., 2001), operated in Full Frame and Medium Filter. These data were already presented by Imanishi & Terashima (2004), but we reduced them with the latest software and calibration files in order to do a better comparison with the Chandra spectrum. Source extraction radii and screening for intervals of flaring particle background were performed with SAS 7.1.0 (Gabriel et al., 2004) via an iterative process which leads to a maximization of the Signal-to-Noise Ratio (SNR), similarly to what described in Piconcelli et al. (2004). After this process, the net exposure time was of about 21, 25 and 26 ks for pn, MOS1 and MOS2 respectively, adopting extraction radii of 28 arcsec for all the cameras. The background spectra were extracted from source-free circular regions with a radius of 50 arcsec. Pattern 0 to 4 were used for the pn spectrum, while MOS spectra include patterns 0 to 12. Spectra were binned in order to oversample the instrumental resolution by at least a factor of 3 and to have no less than 30 counts in each background-subtracted spectral channel.
2.2 Optical and NIR: HST
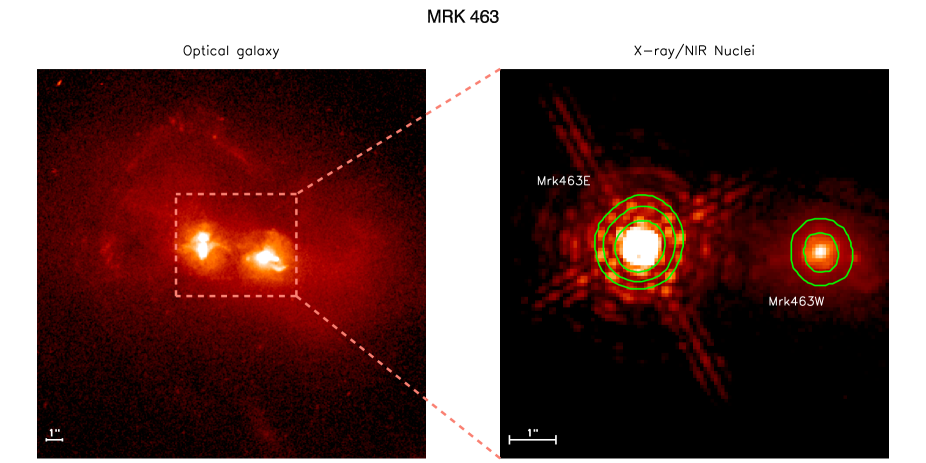
HST observations were retrieved from the Multimission Archive at STScI and processed through the standard on-the-fly reprocessing system. Mrk 463 was observed with WFPC2, NICMOS and with various optical and NIR filters, as part of different observational programs. We use NIR observations with NICMOS-NIC2 (NIR filters F110W, F160W, F207M) from program GO 7213. We also use optical observations with WFPC2 from program GO 5982 (F814W filter), GO 6301 (F588N and FR533N filters). The images from GO 6301 are combined to remove cosmic rays using the task crrej in IRAF, and bad columns were removed using fixpix. For the F814W filter (left panel of fig. 1), only one exposure was taken. Therefore, in order to remove cosmic rays and hot pixels, we run an iterative process using the tasks cosmicrays and fixpix to identify cosmic rays and hot pixels and then ‘fix’ the image.
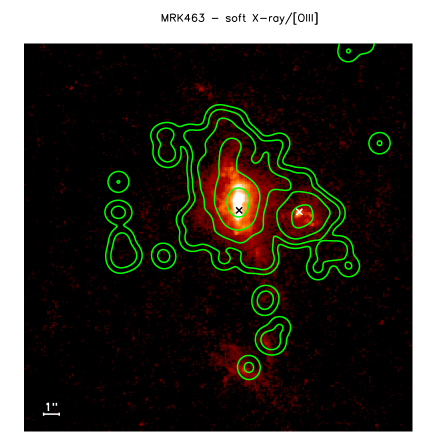
The image taken with the ramp filter FR533N is centered at the redshifted wavelength of the [O iii] emission line, while the F588N filter only includes the nearby continuum emission. The image with F588N is then rescaled to match the continuum emission detected with the FR533N filter, and the continuum emission is subtracted in order to obtain a ‘pure’ [O iii] image (Fig. 2).
We measure the NIR flux of the nuclei from the NICMOS images by performing aperture photometry using the task radprof. The aperture radius is set at pixels from the PSF center (corresponding to ) for the brightest sources (e.g. E nucleus in F207M), and closer to the center ( pixels) for the faintest (e.g. W nucleus in F110W). The background was measured in an annulus of 1 pixel width, as close as possible to the nucleus, just outside the aperture radius. Errors on the measurements depend on the contrast between the brightness of the nucleus and the surrounding background. We estimate that errors are of the order of 5% (corresponding to the NICMOS photometric calibration error) for the brightest sources and up to 40% for the W nucleus in F110W. We convert the counts measured inside the aperture into total counts of the PSF using aperture corrections derived by performing similar aperture photometry on appropriate synthetic PSFs obtained with the TinyTim software. The counts are then converted into physical units using the PHOTFLAM keyword in the image header as a first order approximation. The PHOTFLAM keyword assumes a source with a flat continuum slope (, with ). Thus, in presence of steep spectral slopes, the conversion may be incorrect. By using the task bandpar in SYNPHOT we iteratively derive the slope of the nuclei, and recalculate the value of PHOTFLAM corresponding to the measured slope,
The NIR filters on HST/NICMOS are similar but not equivalent to the standard J, H and K filters used in ground based telescopes (Barker et al., 2007). In order to compare our measurements with K-band magnitudes published in the literature, we measure the flux of the nuclei in the NICMOS F207M image, inside an aperture of radius (corresponding to 13.25 pixels). In this case the background is measured far away from the nuclei, at a distance of . We then convert the fluxes measured from the HST image to K-band magnitudes using the task calcphot in SYNPHOT. The observations were performed before the cryo-cooler installation on NICMOS, therefore we modify the default settings of the task to make use of the correct system throughput tables for the time of the observations.
3 Imaging analysis
The high energy ( keV) Chandra image of Mrk 463 clearly shows the presence of two bright, unresolved nuclei. Their positions are coincident with the two nuclei detected in the HST NIR image (Fig. 1): Mrk 463E (K mag) and Mrk 463W (K mag), separated by arcsec. The soft X-ray ( keV) Chandra image still presents two nuclei and some extended emission, which seems more clearly related to the brightest Mrk 463E. The shape of the soft X-ray emission closely resembles the Narrow Line Region (NLR), mapped by the [O iii] emission (Fig. 2). This is a very common property of Seyfert 2 galaxies and suggests a common origin in a gas photoionized by the AGN emission (see e.g. Bianchi et al., 2006).
4 Spectral analysis
The Chandra spectra of the two nuclei are typical of Compton-thin Seyfert 2 galaxies: they are strongly absorbed, with a soft excess component in the low energy band (see upper panels of Fig. 3). They are well fitted by two powerlaws with the same photon index, one of which absorbed by a column density of a few cm-2. A number of strong emission lines are also required for the East spectrum, while only emission from Ne x K is detected in the West spectrum, which has a poorer SNR (see Table 1). Interestingly, the soft excess in source E is further absorbed by a local column density of the order of cm-2, even if with large uncertainty. The spectrum of the extended emission (which excludes the nuclei) is fully consistent with the soft X-ray emission from the nuclei, being well fitted by a simple powerlaw and a couple of emission lines (see lower left panel of Fig. 3 and Table 1).
| Chandra | XMM-Newton | |||
| Mrk 463E | Mrk 463W | Extended | Mrk 463E+W | |
| NH,1 ( cm-2) | ||||
| NH,2 ( cm-2) | – | |||
| F6.4 | ∗ | – | ||
| EW6.4 (eV) | ∗ | ∗ | – | |
| /dof | 25/29 | 9/10 | 13/12 | 76/94 |
| – | ||||
| – | ||||
| Fluxes of other emission lines | ||||
| O vii K (rif) (0.568 keV) | – | – | – | |
| O viii K (0.654 keV) | – | – | ||
| O vii RRC (0.739 keV) | – | – | – | |
| Fe xvii 3d-2p (0.826 keV) | – | |||
| Ne ix K (rif) (0.914 keV) | – | – | ||
| Ne x K (1.022 keV) | ||||
| Ne x K (1.211 keV) | – | – | – | |
| Mg xi K (rif) (1.342 keV) | – | – | – | |
| Si xiii K (rif) (1.853 keV) | – | – | ||
| Ar xvii K (rif) (3.123 keV) | – | – | – | |
| Ar xvii K (3.680 keV) | – | – | – | |
| Ca xx K (4.070 keV) | – | – | – | |
| Unid. ( keV) | – | – | – | |
| Fe xxvi (6.96 keV) | ∗ | – | – | |


The 2-10 keV absorption-corrected luminosities strongly indicate that both nuclei are AGN, being and erg s-1, much larger than observed in Starburst galaxies and LINERs (e.g. and erg s-1: González-Martín et al., 2006). In addition, the presence of a strong iron line (EW eV) is clearly detected in the local fit of the brightest nucleus, while the upper limit found for the other source is largely consistent with what expected for an AGN (see Table 1).
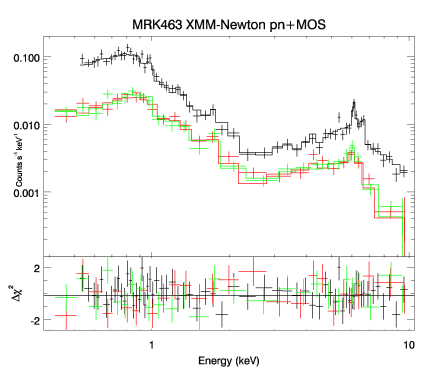
The XMM-Newton spectrum comprises the sum of the two nuclei and the extended emission. Indeed, the best fit is what expected from a Compton-thin Seyfert 2, with a strong Fe K line at high energies and several emission lines from lighter metals in the soft X-rays. The column density of the absorber is intermediate between the two measured separately for the two nuclei with Chandra. The 0.5-2 and 2-10 keV fluxes are consistent, within errors, with the sum of all the contributions measured with Chandra. The neutral iron line flux is larger than the one observed for nucleus East, suggesting the intriguing possibility that the remaining flux comes from an otherwise undetected iron line flux in nucleus West. However, the first two fluxes are consistent within errors and so nothing conclusive can be said in this respect.
As found in the Chandra data, the soft X-ray emission is dominated by a wealth of emission lines from ionised metals. The much better quality of the XMM-Newton data allows us to detect the O vii RRC, a clear signature of photoionisation (see e.g. Guainazzi & Bianchi, 2007, and references intherein). Finally, a strong Fe xxvi line is detected (as already reported by Imanishi & Terashima, 2004), confirming the one observed in the Chandra East nucleus (although, in the latter case, the centroid energy is marginally inconsistent with 6.96 keV and may be blended with Fe xxv). Emission lines from ionised iron are common in Seyfert 2s and may originate in a more ionised phase of the circumnuclear gas photoionised by the nuclear continuum (see e.g. Bianchi et al., 2005).
5 Discussion
The detection in the Chandra data of two luminous ( and erg cm-2 s-1), unresolved nuclei in Mrk 463 strongly suggests that this galaxy hosts a binary AGN. While the East nucleus was already known to be a Seyfert 2 (and this is further confirmed by our Chandra detection of a neutral iron line), this is the first unambiguous evidence in favour of the AGN nature of the West nucleus. These results make Mrk 463 the best bona-fide binary AGN, only after NGC 6240, where strong neutral iron lines are detected in both nuclei. The projected separation between the two nuclei is kpc, again larger only than the one measured in NGC 6240.
Fig. 4 shows the NIR spectrum of the two nuclei, using the HST data. In the same figure, we also plotted the HST NIR spectrum of two typical Seyfert 2 galaxies taken from Alonso-Herrero et al. (2003), re-normalized to the 2.1 m flux of the two nuclei. The spectrum of Mrk 463E is reasonably well fitted by that of Mrk 573, a Compton-thick source (Guainazzi et al., 2005a), while Mrk 463W better fits that of a Compton-thin source, NGC 5252 (N cm-2: Risaliti et al., 2002). Even if the column densities of these Seyfert 2s do not match those of the nuclei of Mrk 463 (and, in principle, they may vary), this comparison still supports that one of the nuclei is more obscured than the other, as found in the X-rays. More direct information on the dust absorption in Mrk 463E and its relation to the X-ray obscuration could come, in principle, from IR spectroscopy. Indeed, the optical depth of the 3.4 m carbonaceous dust absorption feature allowed Imanishi (2002) to estimate a dust extinction . With the standard Galactic gas-to-dust ratio (see e.g. Maiolino et al., 2001, and references therein), this value would correspond to cm2, which is a factor of lower than our X-ray measure. However, such an inconsistency between dust extinction and X-ray absorption is very common in AGN (Maiolino et al., 2001) and so a direct comparison between the two is difficult to interpret.

Adopting the reddening-corrected fluxes reported by Mazzarella & Boroson (1993), we get [O iii] luminosities of and erg s-1 for nucleus E and W, respectively. Therefore, with respect to the unabsorbed 2-10 keV X-ray luminosities derived in our Chandra analysis, Mrk 463W has , which is in agreement with unobscured or Compton-thin Seyfert galaxies (e.g. Panessa et al., 2006). On the other hand, Mrk 463E has , making it X-ray under-luminous, unless it is Compton-thick, but this is quite unlikely given the low EW of the iron line. Indeed, ULIRG are often found to be X-ray under-luminous, but it is unclear whether it is an intrinsic property of AGN in ULIRG or it is due to the larger amount of dust available in these systems (e.g. Brandt et al., 1997; Imanishi & Terashima, 2004). The interesting point here is that only one of the two active nuclei of this ULIRG is X-ray under-luminous and it is the one which presents an excess with respect to the other in IR () and [O iii] () emission, in comparison with the ratio of their intrinsic X-ray luminosities, which is only 4. It is important to note here that almost all of the IR emission of Mrk 463E comes from the AGN, since any compact nuclear starbursts in this source are energetically insignificant, as found on the basis of the analysis of its IR spectrum (Imanishi, 2002; Armus et al., 2004).
However, it must be noted that the [O iii], IR and X-ray observations are not simultaneous and care must be taken when comparing them, without taking into account the source’s intrinsic variability. With respect to the 1990 IR observations taken by Mazzarella et al. (1991), Mrk 463E has dimmed by 0.55 magnitudes and Mrk 463W by 0.13 magnitudes during the HST observation, taken 7 years later. While we do not have any evidence that any of the two nuclei varied in the X-rays (we have only the Chandra observation analysed in this paper where the nuclei are resolved, and their combined X-ray flux is consistent with the one measured by ASCA and XMM-Newton), it is clearly possible that much (if not all) of the X-ray under-luminosity of Mrk 463E may be due to the comparison of two different states of the source.
On the basis of 16 optical binary candidates, Mortlock et al. (1999) estimated that the typical separation where the galactic nuclei become active during a merging process (the so-called ‘activation radius’) lies between 50 and 100 kpc. Their model also predicts that, when the merger becomes more stable, at distances around 10 kpc, the nuclei should ‘turn-off’ again, due to the end of the inflow of gas supplied by the merger in the previous phase. However, it is interesting to note that, with the possible exception of AM1211-465 (Jiménez-Bailón et al., 2007), all the binary AGN found in the X-rays have instead small apparent separation distances, less than kpc.
Moreover, as already noted by Guainazzi et al. (2005b), all the AGN pairs observed so far are found to be heavily obscured in the X-rays, if not Compton-thick, and the two nuclei in Mrk 463 confirm this trend. Even if based on small numbers, this result is in agreement with the idea that merging of galaxies may trigger the presence of a large amount of gas in the nuclear environment. Since obscuration may prevent a correct classification in other bands, hard X-ray observations are indeed the most effective probes to find these elusive systems, which are expected to be abundant if our understanding of the formation and evolution of galaxies and AGN is correct.
Acknowledgements
SB, EP and GM acknowledge financial support from ASI (grant I/088/06/0). We thank the anonymous referee for useful suggestions.
References
- Alonso-Herrero et al. (2003) Alonso-Herrero A., Quillen A. C., Rieke G. H., Ivanov V. D., Efstathiou A., 2003, AJ, 126, 81
- Armus et al. (2004) Armus L., et al., 2004, ApJS, 154, 178
- Arnaud (1996) Arnaud K. A., 1996, in ASP Conf. Ser. 101: Astronomical Data Analysis Software and Systems V, p. 17
- Awaki & Koyama (1993) Awaki H., Koyama K., 1993, Advances in Space Research, 13, 221
- Ballo et al. (2004) Ballo L., Braito V., Della Ceca R., Maraschi L., Tavecchio F., Dadina M., 2004, ApJ, 600, 634
- Barker et al. (2007) Barker E., Barker E., Barker E., Barker E., 2007, ”NICMOS Instrument Handbook”, Version 10.0, (Baltimore: STScI)
- Bianchi et al. (2006) Bianchi S., Guainazzi M., Chiaberge M., 2006, A&A, 448, 499
- Bianchi et al. (2005) Bianchi S., Matt G., Nicastro F., Porquet D., Dubau J., 2005, MNRAS, 357, 599
- Brandt et al. (1997) Brandt W. N., Fabian A. C., Takahashi K., Fujimoto R., Yamashita A., Inoue H., Ogasaka Y., 1997, MNRAS, 290, 617
- Cash (1976) Cash W., 1976, A&A, 52, 307
- Dickey & Lockman (1990) Dickey J. M., Lockman F. J., 1990, ARA&A, 28, 215
- Evans et al. (2007) Evans D. A., et al., 2007, ArXiv e-prints, 712
- Fruscione et al. (2006) Fruscione A., et al.., 2006, in Presented at the Society of Photo-Optical Instrumentation Engineers (SPIE) Conference, Vol. 6270, Observatory Operations: Strategies, Processes, and Systems. Edited by Silva, David R.; Doxsey, Rodger E.. Proceedings of the SPIE, Volume 6270, pp. 62701V (2006).
- Gabriel et al. (2004) Gabriel C., et al., 2004, in ASP Conf. Ser. 314: Astronomical Data Analysis Software and Systems (ADASS) XIII, p. 759
- Garmire et al. (2003) Garmire G. P., Bautz M. W., Ford P. G., Nousek J. A., Ricker G. R., 2003, in X-Ray and Gamma-Ray Telescopes and Instruments for Astronomy. Edited by Joachim E. Truemper, Harvey D. Tananbaum. Proceedings of the SPIE, Volume 4851, p. 28-44
- González-Martín et al. (2006) González-Martín O., Masegosa J., Márquez I., Guerrero M. A., Dultzin-Hacyan D., 2006, A&A, 460, 45
- Guainazzi & Bianchi (2007) Guainazzi M., Bianchi S., 2007, MNRAS, 374, 1290
- Guainazzi et al. (2005a) Guainazzi M., Matt G., Perola G. C., 2005a, A&A, 444, 119
- Guainazzi et al. (2005b) Guainazzi M., Piconcelli E., Jiménez-Bailón E., Matt G., 2005b, A&A, 429, L9
- Haiman & Quataert (2004) Haiman Z., Quataert E., 2004, in Astrophysics and Space Science Library, Vol. 308, Supermassive Black Holes in the Distant Universe, Barger A. J., ed., pp. 147–+
- Hutchings & Neff (1989) Hutchings J. B., Neff S. G., 1989, AJ, 97, 1306
- Imanishi (2002) Imanishi M., 2002, ApJ, 569, 44
- Imanishi & Terashima (2004) Imanishi M., Terashima Y., 2004, AJ, 127, 758
- Jiménez-Bailón et al. (2007) Jiménez-Bailón E., Loiseau N., Guainazzi M., Matt G., Rosa-González D., Piconcelli E., Santos-Lleó M., 2007, A&A, 469, 881
- Komossa (2003) Komossa S., 2003, in American Institute of Physics Conference Series, Vol. 686, The Astrophysics of Gravitational Wave Sources, Centrella J. M., ed., pp. 161–174
- Komossa et al. (2003) Komossa S., Burwitz V., Hasinger G., Predehl P., Kaastra J. S., Ikebe Y., 2003, ApJ, 582, L15
- Landi & Bassani (2001) Landi R., Bassani L., 2001, A&A, 379, 855
- Maiolino et al. (2001) Maiolino R., Marconi A., Salvati M., Risaliti G., Severgnini P., Oliva E., La Franca F., Vanzi L., 2001, A&A, 365, 28
- Mazzarella & Boroson (1993) Mazzarella J. M., Boroson T. A., 1993, ApJS, 85, 27
- Mazzarella et al. (1991) Mazzarella J. M., Soifer B. T., Graham J. R., Neugebauer G., Matthews K., Gaume R. A., 1991, AJ, 102, 1241
- Miller & Goodrich (1990) Miller J. S., Goodrich R. W., 1990, ApJ, 355, 456
- Milosavljević & Merritt (2001) Milosavljević M., Merritt D., 2001, ApJ, 563, 34
- Mortlock et al. (1999) Mortlock D. J., Webster R. L., Francis P. J., 1999, MNRAS, 309, 836
- Panessa et al. (2006) Panessa F., Bassani L., Cappi M., Dadina M., Barcons X., Carrera F. J., Ho L. C., Iwasawa K., 2006, A&A, 455, 173
- Piconcelli et al. (2004) Piconcelli E., Jimenez-Bailón E., Guainazzi M., Schartel N., Rodríguez-Pascual P. M., Santos-Lleó M., 2004, MNRAS, 351, 161
- Polletta et al. (1996) Polletta M., Bassani L., Malaguti G., Palumbo G. G. C., Caroli E., 1996, ApJS, 106, 399
- Risaliti et al. (2002) Risaliti G., Elvis M., Nicastro F., 2002, ApJ, 571, 234
- Sanders & Mirabel (1996) Sanders D. B., Mirabel I. F., 1996, ARA&A, 34, 749
- Shuder & Osterbrock (1981) Shuder J. M., Osterbrock D. E., 1981, ApJ, 250, 55
- Strüder et al. (2001) Strüder L., et al., 2001, A&A, 365, L18
- Turner et al. (2001) Turner M. J. L., et al., 2001, A&A, 365, L27
- Ueno et al. (1996) Ueno S., Koyama K., Awaki H., Hayashi I., Blanco P. R., 1996, PASJ, 48, 389