On the Evolution of the Dense Core Mass Function
Abstract
The mass distributions of dense cores in star-forming regions are measured to have a shape similar to the initial mass function of stars. This has been generally interpreted to mean that the constituent cores will form individual stars or stellar systems at a nearly constant star formation efficiency. This article presents a series of numerical experiments evolving distributions of dense cores into stars to quantify the effects of stellar multiplicity, global core fragmentation, and a varying star formation efficiency. We find that the different evolutionary schemes have an overall small effect on the shape of the resultant distribution of stars. Our results imply that at the current level of observational accuracy the comparison between the mass functions of dense cores and stars alone is insufficient to discern between different evolutionary models. Observations over a wide range of mass scales including the high or low-mass tails of these distributions have the largest potential for discerning between different core evolutionary schemes.
Subject headings:
stars: formation — ISM: clouds — ISM: structure1. Motivation
The mass of a star is the single most important parameter in determining how it will interact with its environment, how long it will live, and the nature of its death. Therefore the distribution of masses of newly formed stars—the initial mass function (IMF)—has far reaching implications for the evolution of the cosmos. The IMF is usually assumed to be universal, with a shape described by a power-law above (see Scalo 1986, 2005; Kroupa 2002), and a log-normal below (see Chabrier 2003).
Stars form from molecular clouds, and therefore their nature and characteristics define the initial conditions for star formation. The hierarchical density and velocity structure of molecular clouds is indicative of supersonic turbulence (Larson 1981; Falgarone & Phillips 1990; Williams et al. 2000). However, cold, dense regions of quiescent gas, or “cores,” found within Galactic clouds are believed to be the sites of future low-mass star formation (Myers et al. 1983; Benson & Myers 1989; Ladd et al. 1991).
A large 1.3 mm continuum survey of dense cores in the Ophiuchus star-forming region by Motte et al. (1998) revealed a core mass distribution with a declining power-law slope similar to the IMF. This led the authors to conclude that the cores observed in thermal dust emission are the direct progenitors of individual stars or stellar systems. The dense core mass function (DCMF) in other regions has also exhibited similarities to the IMF (e.g., Testi & Sargent 1998; Johnstone et al. 2001; Reid & Wilson 2006; Enoch et al. 2007; Nutter & Ward-Thompson 2007). Cores in the Pipe Nebula identified through dust extinction show a turnover at masses about a factor of 3 higher than the IMF of the Trapezium cluster leading to the interpretation that cores evolve with a nearly constant star formation efficiency of % (Alves et al. 2007).
As first suggested by Vazquez-Semadeni (1994), the density probability distribution function (PDF) in isothermal turbulent flows is expected to be log-normal (see Elmegreen & Scalo 2004, for a review) providing theoretical means to produce the low-mass end of the DCMF. The power-law tail of the DCMF can also be explained in terms of post-shock gas within a turbulent medium (Padoan & Nordlund 2002), or by deviations from isothermality (Scalo et al. 1998). In addition, the star formation efficiency of cores is theoretically expected to be nearly constant and lie between 30%–50% if outflows from protostars are the primary mediating factor (Matzner & McKee 2000).
These results support a one-to-one or nearly one-to-one relationship between dense cores and the future stars to form from them. However, the similarity of the DCMF to the IMF remains the only piece of observational evidence for this kind of relationship. Meanwhile, there are several reasons to think that this one-to-one relationship may not hold.
It is clear that some dense cores must fragment to produce the large fraction of observed multiple stellar systems (Duquennoy & Mayor 1991; Goodwin et al. 2007), and it is possible that several fragments per core may be necessary to explain close binary systems (Sterzik et al. 2003; Goodwin & Kroupa 2005). Unfortunately, most observations of pre-stellar cores are limited to spatial resolutions orders of magnitude greater than characteristic binary separations.
It is also difficult to determine what fraction of cores identified in survey data will evolve into stars. In a recent study of cores in the Pipe Nebula, Lada et al. (2007) found that the majority of cores are gravitationally unbound, with only the highest mass cores appearing destined to form stars. The most massive core in the Pipe Nebula, Barnard 59, is the sole active core in the nebula and harbors an association of young stars (Brooke et al. 2007).
Despite these open questions, the intriguing similarity between the DCMF and the IMF remains. Given the numerous ways in which a core could possibly evolve into a young star or stars, we construct numerical simulations in an attempt to quantify the effects of different core evolution scenarios on the resultant stellar IMF. We follow this introduction with an outline of our methods and results in § 2. Section 3 discusses difficulties in comparing astronomical datasets and expands upon our results in consideration of observational constraints. We then conclude in § 4 and present a brief look toward future studies.
2. Simulated Evolution of the DCMF
2.1. The Models
There are several mechanisms by which dense cores may form from more diffuse molecular gas including ambipolar diffusion (Mouschovias 1991), thermal fragmentation (Jeans 1961; Larson 1985), turbulent fragmentation (Padoan et al. 1997), or through triggering events (see, e.g., Elmegreen 1998). Padoan & Nordlund (2002) derive a functional form for the PDF of dense cores created by turbulent fragmentation that is in good agreement with observations.
All our simulations begin with a DCMF generated from the PDF of their Equation 24. The role of turbulence in creating dense cores is still under question (see, e.g., Kirk et al. 2007). However, the results of our experiments do not depend critically on the validity of turbulent fragmentation since it is the difference between the DCMF and the IMF that we are testing here, not the correctness of any particular formulation of the DCMF. We can thus take advantage of the convenient analytical form for the DCMF provided by this formalism.
The simulations begin with a DCMF having a log-normal peak at , a dispersion dex, and a power-law tail at masses greater than a few with an index (), nearly equal to the Salpeter slope of the IMF (1.35; Salpeter 1955). This shape is achieved using an Alfvén Mach number, , a kinetic temperature, K, an average particle density, cm-3, and , where is the turbulent energy spectrum.
The models evolve cores with masses from to 3.0 in increments of dex according to the prescriptions described below. Each core mass bin maps to a stellar probability distribution created numerically through 1000 repetitions. The stellar probability distributions generated from each core mass bin multiplied by the corresponding value of the core PDF sum to create the final IMF. The characterizing parameters of the final stellar distributions are , , and , analogous to the DCMF.
One-to-One: This simple model serves as a comparison model for other evolutionary schemes and is labeled ref. Each core forms a single star with constant star formation efficiency . This creates an IMF with the precise shape of the DCMF but shifted in by dex.
Variable Star Formation Efficiency: This model called sfevar evolves each core into a single star with uniformly random .
Multiplicity: These models explore two different multiplicity scenarios motivated by observations. For model mult1, each core is converted into a single, binary, triple or quadruple system with a probability of 57%, 37%, 4% and 1% respectively to produce stellar systems with multiplicity in accord with solar-type field stars (Duquennoy & Mayor 1991). The system components are assigned uniformly random mass ratios and then scaled such that the total mass in the system equals the total core mass multiplied by a constant .
A mass dependency is embedded in model mult2 where only binaries are considered, and the probability for binarity increases linearly with mass from 10% for core masses to 100% for core masses . The mass ratio between pairs is uniformly random.
Fragmentation: Two different fragmentation schemes are explored by these models. For model fragpdf, each core is fragmented into smaller cores repeatedly with masses drawn from the initial core mass PDF until no mass remains in the original core. This model mimics further turbulent fragmentation of observed cores. Model fraguni follows this same prescription, but draws the masses of fragments randomly with uniform probability between 0 and the mass of the original core.
Composite: The composite model, comp, combines the evolutionary formulas of all the above models. It applies a random star formation efficiency, a mult1 multiplicity scheme, and fragmentation according to model fragpdf.
2.2. Results
Table 1 reports the results from all our models. All stellar distributions begin with a DCMF having , dex, and . The slopes of the stellar distributions are derived from power-law fits at masses greater than , where the peaks and widths are measured directly.
| Model | |||
|---|---|---|---|
| (dex) | () | ||
| Control Model | |||
| ref | 1.3 | 0.37 | 0.39 |
| Variable SFE Model | |||
| sfevar | 1.3 | 0.48 | 0.63 |
| Multiplicity Models | |||
| mult1 | 1.3 | 0.46 | 0.29 |
| mult2 | 1.3 | 0.40 | 0.42 |
| Fragmentation Models | |||
| fragpdf | 2.0 | 0.34 | 0.30 |
| fraguni | 1.3 | 0.51 | 0.23 |
| Composite Model | |||
| comp | 2.0 | 0.53 | 0.34 |
A variable star formation efficiency does not change the power-law slope of the resulting stellar distribution from the initial DCMF. The peak mass of the stellar distribution, is lower than by the expected factor of 2, and the spread in SFE broadens the distribution by 0.11 dex.
Figure 1 shows the results of multiplicity models mult1 and mult2 in red and blue, respectively. Model ref is shown for reference. The effect of stellar multiplicity has a negligible effect on the power-law portion of the IMF for either model. The creation of low-mass companions in model mult1 broadens the peak of the IMF by 0.09 dex and also shifts toward lower mass by % in comparison to model ref.
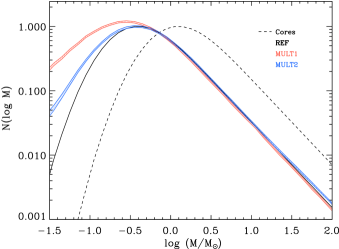
The redistribution of mass takes place mostly in the self-similar part of the DCMF for model mult2. Therefore there is little change in the overall shape of the resultant IMF. The mean binary fraction for all stars created in model mult2 is %.
The results of our fragmentation models are shown graphically in Figure 2. Again, model ref is shown for reference. The cores of model fragpdf fragment into smaller cores with masses preferentially near . Therefore the higher mass cores have a higher number of fragments—up to for the most massive cores. This creates a narrower stellar distribution with a significantly higher peak compared to model ref and a steeper power-law slope by in the index.
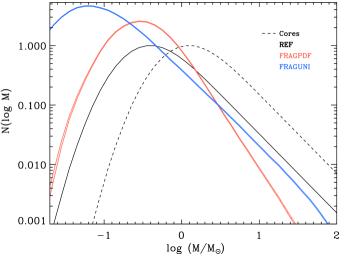
The stellar distribution of model fraguni has a power-law tail identical to the DCMF. The downward turn of the blue curve at the high-mass end in Figure 2 is due to the limited mass range over which we applied this fragmentation scheme. The randomly assigned fragment masses do not change the self-similar part of the stellar distribution, but the excess of low-mass stars generated by cores spanning the entire DCMF widens the resultant IMF by 0.14 dex. The mean number of fragments per core in this scheme is .
The composite model, comp, combines stellar multiplicity, core fragmentation, and a random star formation efficiency. While the preferred mass of the fragmentation creates a steep power-law tail as in model fragpdf, the broader peak due to multiplicity and a variable SFE create a shape consistent with the original core PDF over a wider mass range than fragpdf (see Figure 3 below).
3. Discussion
3.1. Observational Difficulties
The different core evolution schemes produce stellar distributions that are clearly discernible in our theoretical modeling. But these simulated data offer the luxury of complete control. When comparing real, astronomical datasets of cores and stars, several difficulties arise.
3.1.1 Obtaining a Representative Sample of Cores
The unbiased identification of an ensemble of dense cores within molecular clouds that will definitively form stars is a difficult task. Many automated core or clump finding algorithms exist that produce reasonable results from dust continuum, dust extinction or molecular line data (e.g. Stutzki & Guesten 1990; Williams et al. 1994). However, these methods offer no measure of systematic errors in identifying bona fide pre-stellar cores which may dominate the Poisson errors assumed in analyses.
Once a core forms a protostar, it is not clear how the mass of the remaining core is relevant to the IMF. Cores with embedded stars can therefore be excluded from an ensemble with the use of sensitive infrared observations, e.g., using Spitzer (Evans et al. 2003). The remaining starless cores, however, may not all form stars in the future.
Recent studies of the Perseus star-forming region show that starless cores tend to be less massive than cores with stars (although there exist many low-mass cores that harbor embedded sources) (see Jørgensen et al. 2007; Hatchell et al. 2007). This could mean that many of the low-mass cores included in their samples are transient structures or perhaps still accreting material. Molecular line data can supplement dust maps to determine the gravitational boundedness of cores, and hence the likelihood of them eventually forming stars. In a study of the Pipe nebula cores, Lada et al. (2007) find that only the % most massive cores are gravitationally bound, and Johnstone et al. (2000) find that a majority of cores in Ophiuchus are stable against gravity. However, molecular line studies of NGC 1333 and Ophiuchus find that cores in those regions extending down to masses of are likely to be bound (Walsh et al. 2007; André et al. 2007).
Low-mass, starless cores that appear gravitationally unbound might also be bound by external pressure, and are therefore potentially stellar precursors. In this case, the possibility of different evolutionary timescales for different cores in the sample may need to be considered (see Clark et al. 2007, for details).
3.1.2 Comparing DCMFs to the IMF
It is impossible to measure a DCMF for an ensemble of cores as well as an IMF for the stars that formed from them. Variations in the DCMF (e.g., compare Motte et al. 1998 Nutter & Ward-Thompson 2007) and the IMF (Chabrier 2003) from region to region therefore must be considered when comparing these distributions. Moreover, the total number of stars to form from a distribution of dense cores can never be measured directly. This means that the height of, or total area under, the stellar IMF cannot be used to discern between core evolution models.
Observations of cores in star forming regions are currently limited to samples of less than a few hundred (e.g., Enoch et al. 2007; Nutter & Ward-Thompson 2007; Alves et al. 2007). Using our core PDF, we generate simulated data for a sample of 300 cores. This number was chosen to give a number of stars per dex bin near the peak of the DCMF comparable to modern-day observations.
Figure 3 shows the comparison between these simulated observations and numerous results from our models. The errors on the simulated data correspond to from counting statistics. The synthetic IMFs are rescaled by a multiplicative factor and shifted by an additive factor in that produces the lowest value between and in . All synthetic IMFs produce values less than one except model fragpdf for which .
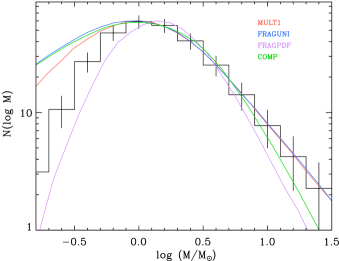
Our models produce the largest variation in the parameters and , while only mass dependent core evolution affects . Fragmentation affects the width of the IMF and tends to lower the characteristic mass of the IMF compared to a simple one-to-one core evolution scenario. Variation in the SFE broadens the IMF while the mean SFE for an ensemble of cores affects the characteristic mass of the IMF. Additionally, mass dependency may exist in either core fragmentation or in the SFE of cores. Therefore there is significant degeneracy between the nature of fragmentation and SFE in determining the shape of the IMF.
To break this degeneracy, accurate measurements of DCMFs and the IMF over orders of magnitude in mass must be made, where the most leverage is achieved at the high and low-mass ends of these distributions. This data must then be supplemented with independent observations, such as comparisons between the total mass in cores and total mass in stars to constrain the SFE, or spatial correlation functions of stars and cores to constrain the fragmentation.
3.2. Observational Constraints
The SFE of dense cores in Perseus has been recently determined to be between 10%–15% (Jørgensen et al. 2007). This result implies that the horizontal shift between measured DCMFs and the stellar IMF should be a factor of order 10. However, our models show that it is not the SFE alone that contributes to the horizontal shift between DCMFs and the IMF; fragmentation can also contribute.
The SFE in model mult1 derived by direct comparison of the DCMF and IMF appears % lower than the true SFE of due merely to the minimal fragmentation required to reproduce the observed multiplicity of field stars in the Galaxy. For model fraguni the apparent SFE drops to . Fragmentation effects could therefore lead to an underestimation of the SFE by as much as 40% for a given measured DCMF. Alternatively, it is shown through model mult2 that the opposite systematic effect could be an issue if higher mass stars preferentially form multiple systems; i.e., an overestimation of the inferred SFE from a measured DCMF.
Without considering the possibility of core fragmentation, the horizontal shifts between measured DCMFs and the IMF imply SFEs of % in Ophiuchus (Motte et al. 1998; André et al. 2007), to % in the Pipe Nebula (Alves et al. 2007), to % in Orion (Nutter & Ward-Thompson 2007). This wide spread may be partially due to a varying degrees of core fragmentation in the different regions. However, it is not clear to what degree this discrepancy is due to observational biases. For instance, the poorer physical resolution of observations toward distant regions may artificially drive the DCMF peak to higher masses because of confusion, thus lowering the inferred SFE.
The number of cores containing multiple embedded protostars within a star-forming region is related to the amount of core fragmentation that has taken place there. From the data of Jørgensen et al. (2007, Table 1), anywhere from 4% to 23% of cores have formed multiple protostars with separations between AU and AU. This is a lower limit to the amount of core fragmentation in Perseus primarily because % of cores are likely to fragment on scales smaller than 1500 AU to produce a multiplicity in accord observations of field stars (Duquennoy & Mayor 1991).
However, for comparison, we calculate from our fragmentation models an upper limit to the number of Perseus cores expected to be observed with multiple protostars. Thirty percent of cores with masses between 0.1 and 4.9 (Kirk et al. 2006) fragment into multiple cores according to the fragpdf model, while 42% of the cores from the fraguni model potentially produce cores with multiple protostars.
4. Conclusions
If the structure and conditions within molecular clouds indeed determine the stellar IMF, the similarity between measured DCMFs and the IMF is likely a reflection of this relationship. It is clear from past studies that some of the cores identified in star-forming regions are the direct progenitors of stars or stellar systems. However, our simulations have shown that the overall shape of the IMF is robust against different core evolution scenarios for core masses between and . In light of the uncertainties in identifying a representative sample of cores in astronomical data, a direct comparison between DCMFs in this mass range and the IMF cannot alone imply any particular evolutionary path from an ensemble of cores to a future generation of stars.
The peak mass in our simulated IMFs, , is affected by both the SFE and the fragmentation scheme adopted. Estimations of the SFE by comparing the turnover in the DCMF to the IMF could be off by as much as % without considering the possibility of core fragmentation (including multiplicity). The widths of our simulated IMFs, , are also affected both by variation in the SFE and fragmentation. Therefore, independent constraints on the SFE (e.g., through comparisons between total core mass and total stellar mass) or fragmentation (e.g., using spatial correlation functions of cores and stars) must be used to discern between these two effects given accurate measurements of DCMFs and the IMF over orders of magnitude in mass.
Differences in the power-law tails of the DCMF and IMF are sensitive to mass dependencies in core evolution. Using a fragmentation scheme with a preferential mass scale we achieve a power-law slope change of , though other fragmentation scenarios produce no noticeable difference.
4.1. Future Studies
The massive clouds identified through m extinction against the Galactic background—infrared dark clouds (IRDCs; Perault et al. 1996; Egan et al. 1998)—offer a promising target list from which to derive DCMFs over a wide mass range extending to higher masses than have been previously measured. These sources, however, are typically distant making individual cores difficult to detect and resolve. ALMA may be needed to produce useful DCMFs from these sources.
To constrain the low-mass end of the DCMF, it is necessary to make sensitive, high-resolution observations of the closest star-forming regions. Current facilities have the resolution to detect individual cores, and instruments such as SCUBA2 may extend considerably the DCMF to lower masses over wide fields. Together with molecular line data and complete surveys of late-type stars and brown dwarfs in a variety of star-forming regions, the statistics at the low-mass ends of DCMFs and IMFs may soon be sufficient to draw detailed conclusions regarding the relationship between the DCMF and the IMF.
References
- Alves et al. (2007) Alves, J., Lombardi, M., & Lada, C. J. 2007, A&A, 462, L17
- André et al. (2007) André, P., Belloche, A., Motte, F., & Peretto, N. 2007, A&A, 472, 519
- Benson & Myers (1989) Benson, P. J. & Myers, P. C. 1989, ApJS, 71, 89
- Brooke et al. (2007) Brooke, T. Y., Huard, T. L., Bourke, T. L., Boogert, A. C. A., Allen, L. E., Blake, G. A., Evans, II, N. J., Harvey, P. M., Koerner, D. W., Mundy, L. G., Myers, P. C., Padgett, D. L., Sargent, A. I., Stapelfeldt, K. R., van Dishoeck, E. F., Chapman, N., Cieza, L., Dunham, M. M., Lai, S.-P., Porras, A., Spiesman, W., Teuben, P. J., Young, C. H., Wahhaj, Z., & Lee, C. W. 2007, ApJ, 655, 364
- Chabrier (2003) Chabrier, G. 2003, PASP, 115, 763
- Clark et al. (2007) Clark, P. C., Klessen, R. S., & Bonnell, I. A. 2007, MNRAS, 379, 57
- Duquennoy & Mayor (1991) Duquennoy, A. & Mayor, M. 1991, A&A, 248, 485
- Egan et al. (1998) Egan, M. P., Shipman, R. F., Price, S. D., Carey, S. J., Clark, F. O., & Cohen, M. 1998, ApJ, 494, L199+
- Elmegreen (1998) Elmegreen, B. G. 1998, in Astronomical Society of the Pacific Conference Series, Vol. 148, Origins, ed. C. E. Woodward, J. M. Shull, & H. A. Thronson, Jr., 150–+
- Elmegreen & Scalo (2004) Elmegreen, B. G. & Scalo, J. 2004, ARA&A, 42, 211
- Enoch et al. (2007) Enoch, M. L., Glenn, J., Evans, II, N. J., Sargent, A. I., Young, K. E., & Huard, T. L. 2007, ApJ, 666, 982
- Evans et al. (2003) Evans, II, N. J., Allen, L. E., Blake, G. A., Boogert, A. C. A., Bourke, T., Harvey, P. M., Kessler, J. E., Koerner, D. W., Lee, C. W., Mundy, L. G., Myers, P. C., Padgett, D. L., Pontoppidan, K., Sargent, A. I., Stapelfeldt, K. R., van Dishoeck, E. F., Young, C. H., & Young, K. E. 2003, PASP, 115, 965
- Falgarone & Phillips (1990) Falgarone, E. & Phillips, T. G. 1990, ApJ, 359, 344
- Goodwin & Kroupa (2005) Goodwin, S. P. & Kroupa, P. 2005, A&A, 439, 565
- Goodwin et al. (2007) Goodwin, S. P., Kroupa, P., Goodman, A., & Burkert, A. 2007, in Protostars and Planets V, ed. B. Reipurth, D. Jewitt, & K. Keil, 133–147
- Hatchell et al. (2007) Hatchell, J., Fuller, G. A., Richer, J. S., Harries, T. J., & Ladd, E. F. 2007, A&A, 468, 1009
- Jeans (1961) Jeans, J. H. 1961, Astronomy and cosmogony (New York: Dover, 1961)
- Johnstone et al. (2001) Johnstone, D., Fich, M., Mitchell, G. F., & Moriarty-Schieven, G. 2001, ApJ, 559, 307
- Johnstone et al. (2000) Johnstone, D., Wilson, C. D., Moriarty-Schieven, G., Joncas, G., Smith, G., Gregersen, E., & Fich, M. 2000, ApJ, 545, 327
- Jørgensen et al. (2007) Jørgensen, J. K., Johnstone, D., Kirk, H., & Myers, P. C. 2007, ApJ, 656, 293
- Kirk et al. (2006) Kirk, H., Johnstone, D., & Di Francesco, J. 2006, ApJ, 646, 1009
- Kirk et al. (2007) Kirk, H., Johnstone, D., & Tafalla, M. 2007, ApJ, 668, 1042
- Kroupa (2002) Kroupa, P. 2002, Science, 295, 82
- Lada et al. (2007) Lada, C. J., Muench, A. A., Rathborne, J. M., Alves, J. F., & Lombardi, M. 2007, ArXiv e-prints, 709
- Ladd et al. (1991) Ladd, E. F., Adams, F. C., Fuller, G. A., Myers, P. C., Casey, S., Davidson, J. A., Harper, D. A., & Padman, R. 1991, ApJ, 382, 555
- Larson (1981) Larson, R. B. 1981, MNRAS, 194, 809
- Larson (1985) —. 1985, MNRAS, 214, 379
- Matzner & McKee (2000) Matzner, C. D. & McKee, C. F. 2000, ApJ, 545, 364
- Motte et al. (1998) Motte, F., Andre, P., & Neri, R. 1998, A&A, 336, 150
- Mouschovias (1991) Mouschovias, T. C. 1991, ApJ, 373, 169
- Myers et al. (1983) Myers, P. C., Linke, R. A., & Benson, P. J. 1983, ApJ, 264, 517
- Nutter & Ward-Thompson (2007) Nutter, D. & Ward-Thompson, D. 2007, MNRAS, 374, 1413
- Padoan et al. (1997) Padoan, P., Jones, B. J. T., & Nordlund, A. P. 1997, ApJ, 474, 730
- Padoan & Nordlund (2002) Padoan, P. & Nordlund, Å. 2002, ApJ, 576, 870
- Perault et al. (1996) Perault, M., Omont, A., Simon, G., Seguin, P., Ojha, D., Blommaert, J., Felli, M., Gilmore, G., Guglielmo, F., Habing, H., Price, S., Robin, A., de Batz, B., Cesarsky, C., Elbaz, D., Epchtein, N., Fouque, P., Guest, S., Levine, D., Pollock, A., Prusti, T., Siebenmorgen, R., Testi, L., & Tiphene, D. 1996, A&A, 315, L165
- Reid & Wilson (2006) Reid, M. A. & Wilson, C. D. 2006, ApJ, 650, 970
- Salpeter (1955) Salpeter, E. E. 1955, ApJ, 121, 161
- Scalo (2005) Scalo, J. 2005, in Astrophysics and Space Science Library, Vol. 327, The Initial Mass Function 50 Years Later, ed. E. Corbelli, F. Palla, & H. Zinnecker, 23–+
- Scalo et al. (1998) Scalo, J., Vazquez-Semadeni, E., Chappell, D., & Passot, T. 1998, ApJ, 504, 835
- Scalo (1986) Scalo, J. M. 1986, Fundam. Cosmic Phys., Vol. 11, Nos. 1 - 3, p. 1 - 278, 11, 1
- Sterzik et al. (2003) Sterzik, M. F., Durisen, R. H., & Zinnecker, H. 2003, A&A, 411, 91
- Stutzki & Guesten (1990) Stutzki, J. & Guesten, R. 1990, ApJ, 356, 513
- Testi & Sargent (1998) Testi, L. & Sargent, A. I. 1998, ApJ, 508, L91
- Vazquez-Semadeni (1994) Vazquez-Semadeni, E. 1994, ApJ, 423, 681
- Walsh et al. (2007) Walsh, A. J., Myers, P. C., Di Francesco, J., Mohanty, S., Bourke, T. L., Gutermuth, R., & Wilner, D. 2007, ApJ, 655, 958
- Williams et al. (2000) Williams, J. P., Blitz, L., & McKee, C. F. 2000, Protostars and Planets IV, 97
- Williams et al. (1994) Williams, J. P., de Geus, E. J., & Blitz, L. 1994, ApJ, 428, 693