A MULTISCALE STUDY OF POLYCYCLIC AROMATIC HYDROCARBON PROPERTIES IN GALAXIES
Abstract
In the present contribution, I summarize a systematic study of ISO and Spitzer mid-IR spectra of Galactic regions and star forming galaxies. This study quantifies the relative variations of the main aromatic features inside spatially resolved objects as well as among the integrated spectra of 50 objects. Our analysis implies that the properties of the PAHs are remarkably universal throughout our sample and at different spatial scales. In addition, the relative variations of the band ratios, as large as one order of magnitude, are mainly controled by the fraction of ionized PAHs. In particular, I show that we can rule out both the modification of the PAH size distribution and the mid-IR extinction, as an explanation of these variations. High values of the ratio are found to be associated with the far-UV illuminated surface of PDRs, at the scale of an interstellar cloud, and associated with star formation activity, at the scale of a galaxy. Using a few well-studied Galactic regions, we provide an empirical relation between the ratio and the ionization/recombination ratio . Finally, I show that these trends are consistent with the detailed modeling of the PAH emission within photodissociation regions, taking into account the radiative transfer, the stochastic heating and the charge exchange between gas and dust.
1 INTRODUCTION
Polycyclic Aromatic Hydrocarbons (PAHs) are large molecules containing 10 to 1000 carbon atoms. They are commonly believed to be the carriers of the ubiquitous broad mid-infrared features, centered around 3.3, 6.2, 7.7, 8.6 and 11.3 (e.g. Allamandola et al., 1999). Due to their small size, these molecules are predomantly excited by single UV-photon events. At solar metallicity, of the total infrared (IR) luminosity is radiated through the aromatic features (e.g. Zubko et al., 2004). On the contrary, PAHs are underabundant in low-metalicity environments (Galliano et al., 2008a, for a complete study).
It has long been surmised that the mid-infrared emission features provide a clear signature of the interaction of far-UV photons with cloud surfaces and hence a probe of the importance of massive star formation in a region (Genzel et al., 1998; Peeters et al., 2004). The present work extends this by studying methodically the mid-infrared spectra of a wide variety of sources at different spatial scales, and investigating the physical origin of the PAH band ratio variations.
2 SYSTEMATIC ANALYSIS OF THE OBSERVED AROMATIC FEATURES
2.1 Sample and Mid-Infrared Spectral Decomposition
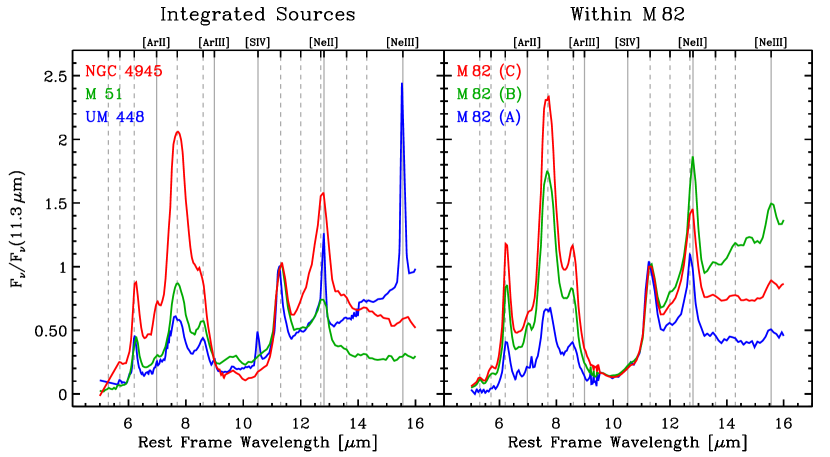
We have constructed a large sample of mid-infrared spectra of Galactic regions (H ii regions, photodissociation regions, planetary nebulae), Magellanic H ii regions, and nearby dwarf, spiral and starburst galaxies. These sources were observed with one of the three following instruments: ISO/CAM, ISO/SWS, Spitzer/IRS. Several of these objects have been spectrally mapped (IC 342, M 17, M 51, M 82, M 83, 30 Doradus, and the Orion bar). Our sources are the merging of the samples presented by Madden et al. (2006) and Galliano et al. (2008a). They present a wide range of properties (metallicity, star formation rates), as well as of spatial scales (resolution of pc in M 17 and the Orion bar, and of kpc in external galaxies). Fig. 1 illustrates the diversity of these properties.
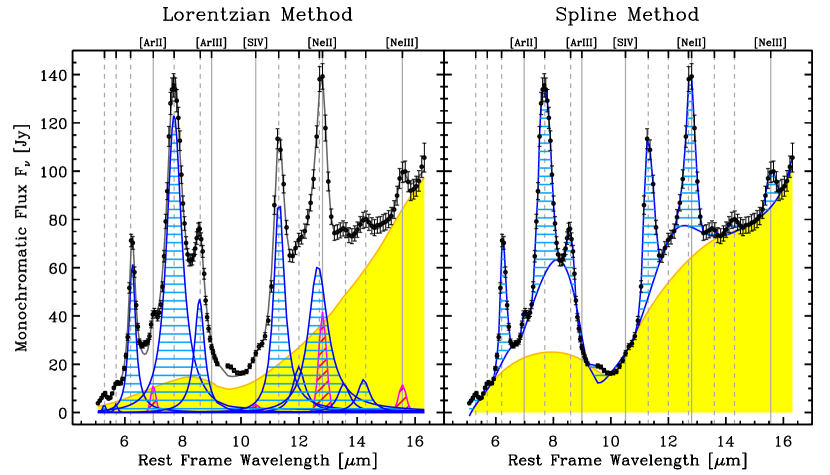
Quantifying the spectral variations demonstrated in Fig. 1 is not straightforward. Indeed, a significant fraction of the power radiated through the aromatic features comes from their wings. Moreover the accurate profile of the bands is uncertain, and has been modeled differently by Boulanger et al. (1998), Li & Draine (2001) and Vermeij et al. (2002). In order to test the robustness of our results, we have systematically analysed our spectra using two different methods (Fig. 2). These methods are described in detail by Galliano et al. (2008b). It is important to note that the Lorentzian method (left panel of Fig. 2) fits Lorentz profiles to the aromatic features, taking into account the flux in their wings. This method is feature-biased, since part of the small grain continuum can artificially be accounted by the wings of the bands. On the contrary, the Spline method (right panel of Fig. 2), which integrates only the tip of the aromatic bands, is continuum-biased.
Although the numerical values of the intensity of a given feature, measured with the two methods are different, our study shows that the order between several intensities is identical with the two methods. It indicates that the respective biases of the methods do not affect the general trends between band intensities. Therefore, in the following of this review, I will present only the results obtained with the first method and refer the reader to Galliano et al. (2008b) for the complete results.
2.2 Correlations Between Aromatic Feature Intensity Ratios
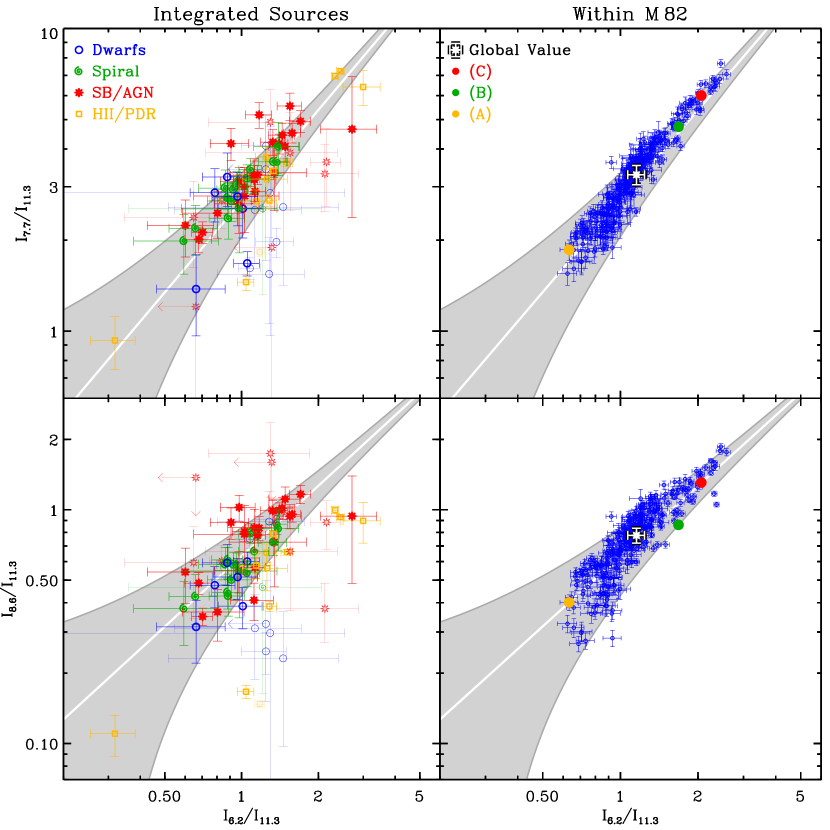
Fig. 3 shows the correlations between several aromatic feature intensity ratios derived from integrated spectra of galaxies and Galactic regions (left panels), as well as from spatially resolved spectra within M 82 (right panels). These figures clearly show that all types of sources and all types of apertures follow the same universal trends. The 6.2, 7.7 and 8.6 features appear to be tied together, while the ratios between these features and the 11.3 band vary by one order of magnitude. The relations involving the 8.6 feature exhibit a larger dispersion, as this band is the weakest of the four considered here, its intensity is significantly affected by the silicate extinction feature, and it is blended with the powerful 7.7 feature. A preliminary version of these correlations was presented by Galliano (2004).
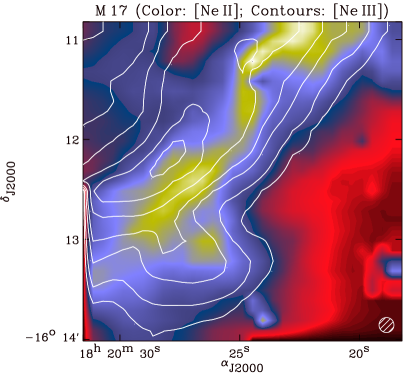
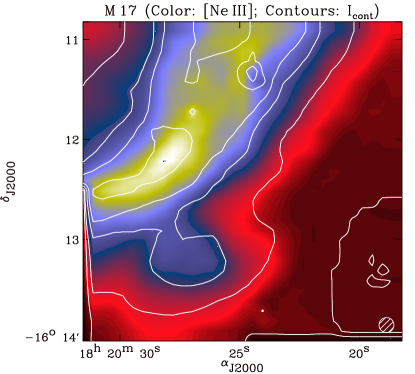
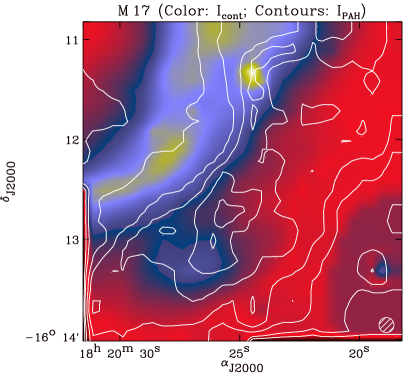
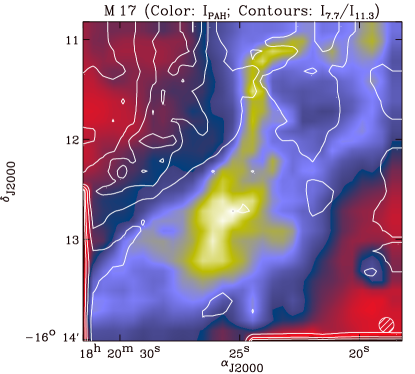
In general, high values of are associated with intense star forming regions. Fig. 4 shows images of several spectral components of the edge-on Galactic photodissociation region (PDR) M 17. On each image, the H ii region is located toward the top-left corner, and the molecular cloud toward the bottom-right corner. The edge-on view of this region allows us to see the different strata of species, as demonstrated by the top left panel of Fig. 4. This panel shows that the Ne iii ions are distributed on a ridge located closer to the H ii region than the Ne ii ions. The top right panel shows that the Ne iii and the very small grain intensity have similar spatial distributions, while the bottom left panel shows that the PAHs are found more deeply inside the cloud, since they undergo photolysis/thermolysis close to the H ii region. Finally, the bottom right panel shows that the ratio peaks in the region where the [Ne iii]15.56μm and the continuum intensity are maximum. Consequently, at the scale of an interstellar cloud, the ratio is maximum at the surface of the far-UV illuminated surface.
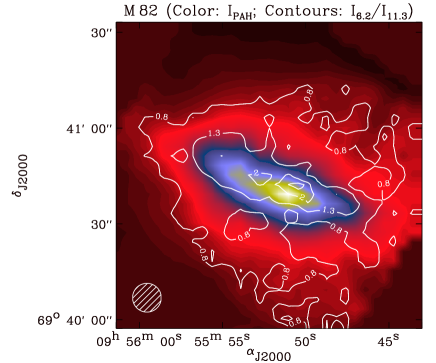
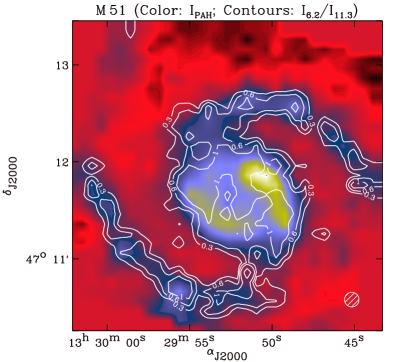
Fig. 5 compares the spatial distributions of the intensity radiated by the aromatic bands to the ratio (following the same trends than ), within two external galaxies, M 82 and M 51. Contrary to Fig. 4, the clouds are not resolved in this case. These images indicate that the ratio is enhanced where the PAH intensity is high, along the spiral arms and in the starburst regions. Therefore, at the scale of a galaxy, the ratio is maximum in massive star forming regions.
3 ORIGIN OF THE AROMATIC FEATURE VARIATIONS IN GALAXIES
3.1 Inventory of the Physical Processes Potentially Affecting the Band Ratios
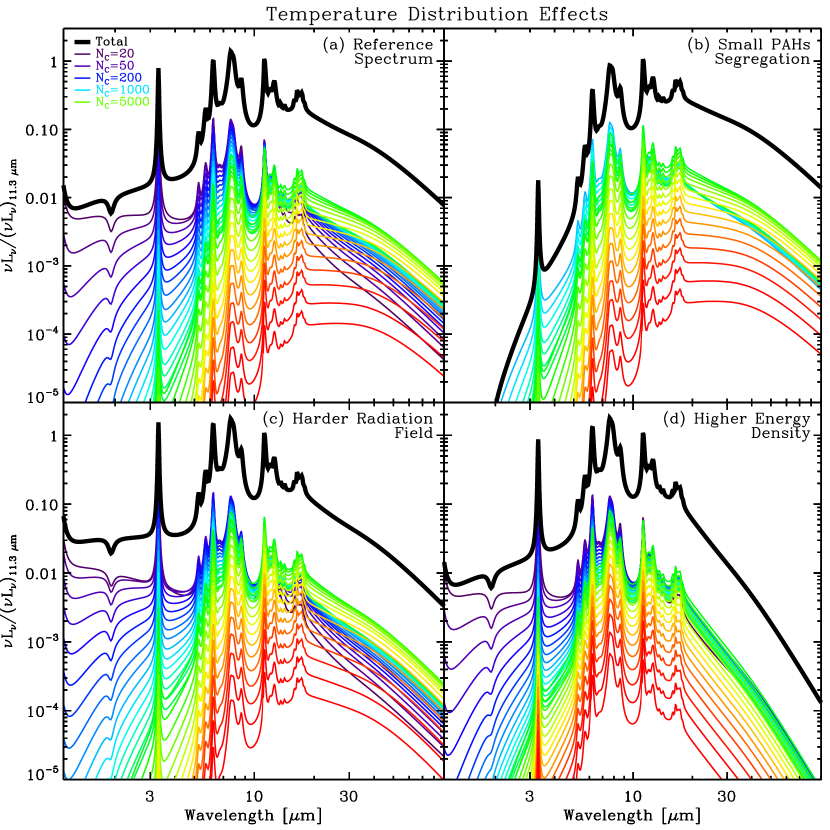
PAHs are stochastically heated, hence their thermal emission spectrum is determined by their temperature distribution. Fig. 6 demonstrates the effects of changing this temperature distribution by varying different parameters. Fig. 6a corresponds to the Galactic diffuse ISM. Fig. 6b shows that the bands around 6.2, 7.7 and 8.6 decrease relative to the 11.3 band, if the small PAHs (smaller than carbon atoms) disappear. Indeed, small PAHs fluctuate up to higher temperatures than larger ones. Hence, their short wavelength features emit more intensely. This case corresponds to environments where the small PAHs would photosublimate preferentially. Fig. 6c shows that by increasing the hardness of the interstellar radiation field (ISRF) or equivalently by increasing the average stellar photon energy, PAHs fluctuate up to higher temperatures, therefore boosting the short wavelength features. Finally, Fig. 6d shows that increasing the radiation density decreases the time that a given PAH spend on average at cool temperatures. However, this effect plays a role only for ISRFs which are times more intense than the Galactic one.
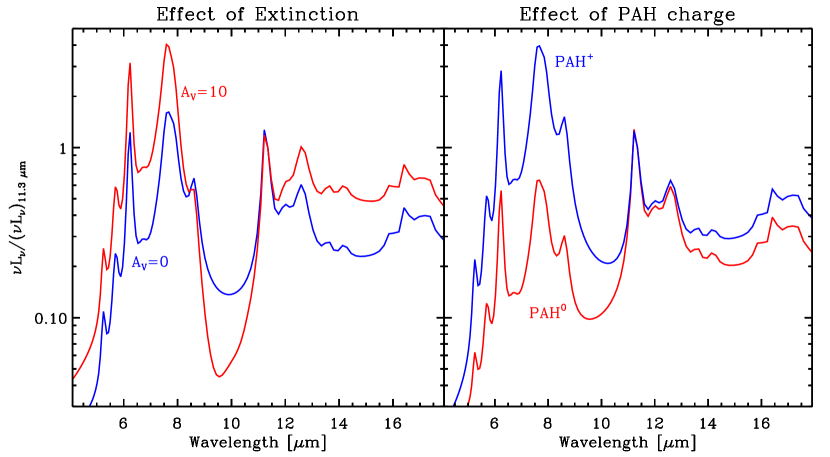
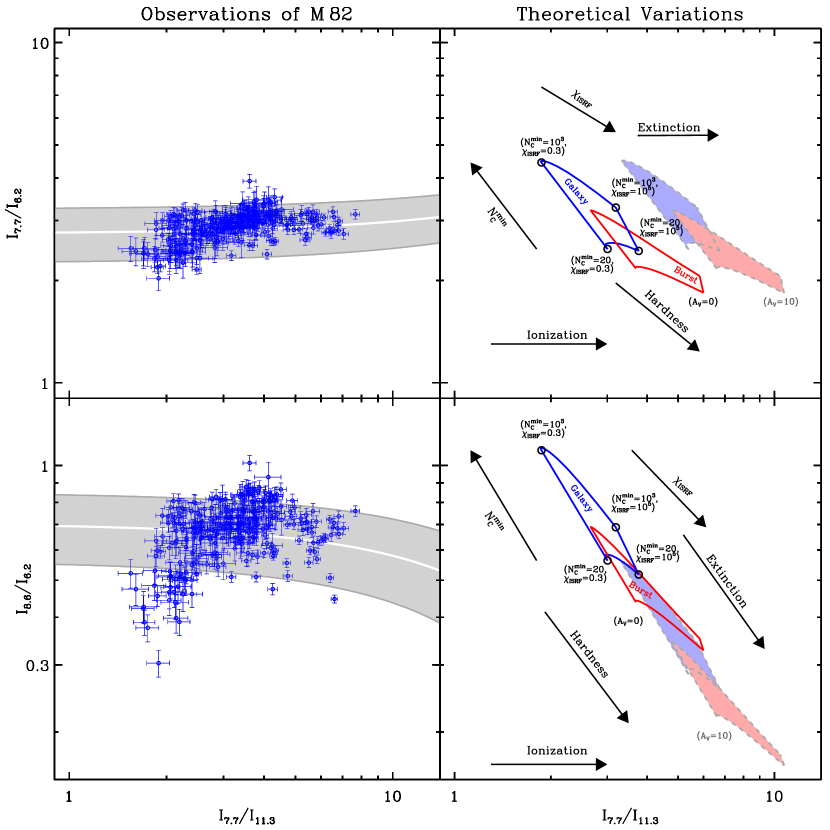
Fig. 7 demonstrates additional effects controling the aromatic feature ratios. First, mid-IR extinction is dominated by a broad silicate feature centered around 9.7. This feature absorbs significantly the 8.6 and 11.3 bands, but has little effect on the 6.2 and 7.7 bands, as shown on the left panel of Fig. 7. Second, the 6 to 9 features are enhanced for charged PAHs (right panel of Fig. 7), since they are attributed to C-C modes, while the 11.3 is attributed to peripheral C-H modes (e.g. Allamandola et al., 1989).
3.2 The Dominant Role of the Fraction of Ionized PAHs
Fig. 8 compares the trend between band ratios observed within M 82 (similar trends are followed by the other sources; Fig. 3) to theoretical trends. The left panels of Fig. 8 are another way to look at Fig. 3. Statistically, the observed and do not show significant variations and are uncorrelated with the . The right panels of Fig. 8 represents the variations of the aromatic features from the models presented in Figs. 6-7. What this figure shows is that the modification of the PAH temperature distribution (Sect. 3.1) is not consistent with our observations, since it would anticorrelate and with . On the other hand, the extinction produces the right trend between and , but it anticorrelates with . Finally, Fig. 8 shows that the only effect which is consistent with the observations is the variation of the fraction of ionized PAHs.
 |
 |
We emphasize that our sample contains mainly moderately obscured star forming galaxies and Galactic regions, where AGNs are under-represented. The effects that have been ruled out here may play a role for peculiar sources like elliptical galaxies (Kaneda et al., 2007), LINERs (Smith et al., 2007) or ULIRGs (Brandl et al., 2006).
4 THE AROMATIC BANDS AS A DIAGNOSTIC TOOL OF THE PHYSICAL CONDITIONS
4.1 Empirical Calibration of the Mid-Infrared Band Ratios
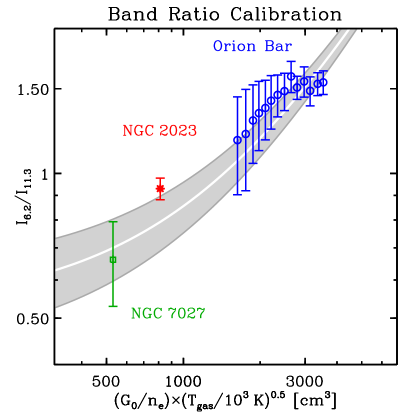
The variations of aromatic feature intensity ratios are mainly controled by the fraction of charged PAHs (Sect. 3.2). This fraction of charged PAHs is directly related to the ionization-to-recombination ratio, , where is the UV field density, is the electron density, and is the gas temperature. Therefore the observed aromatic feature intensities can provide useful constraints on the physical conditions in the region where they are emitting.
 |
 |
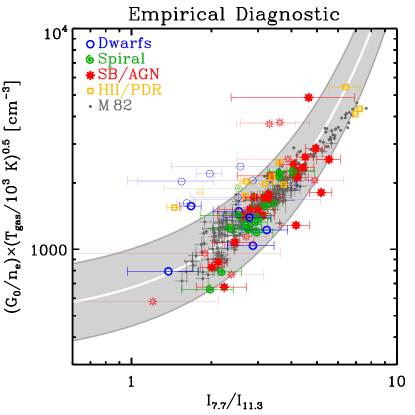
We used the , and values from the literature of a few well-studied sources, in order to provide an empirical calibration of the band ratio (Galliano et al., 2008b). The left panel of Fig. 9 shows this calibration. It demonstrates that the ratio (or the relative fraction of PAH+) is high for either high (proportional to the ionization rate) or low (proportional to the recombination rate). This calibration can be applied to the sources in Fig. 3 (right panel of Fig. 9).
4.2 Detailed PDR Modeling of the Polycylic Aromatic Hydrocarbon Emission
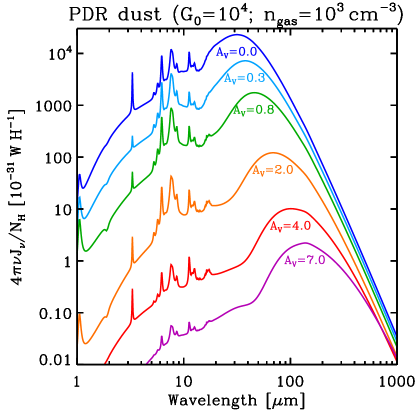
The empirical relation of Fig. 9 can be generalised theoretically, using detailed PDR modeling. The left panel of Fig. 10 shows the dust spectral energy distributions (SEDs) at different points within an homogeneous slab PDR. The radiative transfer of the incident ISRF on the surface of the cloud is solved, in combination with the photoionization, photodissociation and chemical reactions within the cloud, using the PDR model of Kaufman et al. (2006). In particular, this PDR model takes into account the charge transfer between gas and dust, and thus determines the fraction of charged PAHs at each point within the cloud. Using the Draine & Li (2007) absorption efficiencies, we solved the stochastic heating of the PAHs and small grains for each (left panel of Fig. 10; Galliano et al., 2008c).
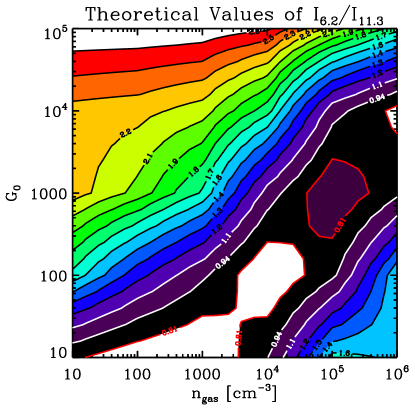
The right panel of Fig. 10 shows the value of the PAH band ratio integrated over each PDR of UV field and density . This type of diagram is usual for PDR gas lines. The originality of this work is to extend it to dust features. This figure is in qualitative agreement with Fig. 9. It shows that the ratio is constant over constant lines. The is high at the top-left corner of the panel, for high and low , where the PAHs are mainly positively charged. The is also high at the botton-right corner of the panel, for low and high , since the PAHs are mainly negatively charged.
The present study has developed the observed mid-IR features as a quantitative tool to probe the physical conditions (e.g. ) in the emitting regions. We expect that this study will be of fundamental value for the interpretation of Spitzer data as well as future Sofia and JWST observations of galaxies in the nearby and early universe.
References
- Allamandola et al. (1999) Allamandola, L. J., Hudgins, D. M., & Sandford, S. A. 1999, ApJ, 511, L115
- Allamandola et al. (1989) Allamandola, L. J., Tielens, G. G. M., & Barker, J. R. 1989, ApJS, 71, 733
- Boulanger et al. (1998) Boulanger, F., Boisssel, P., Cesarsky, D., & Ryter, C. 1998, A&A, 339, 194
- Brandl et al. (2006) Brandl, B. R., Bernard-Salas, J., Spoon, H. W. W., et al. 2006, ApJ, 653, 1129
- Cesarsky et al. (1996) Cesarsky, D., Lequeux, J., Abergel, A., et al. 1996, A&A, 315, L305
- Draine & Li (2007) Draine, B. T. & Li, A. 2007, ApJ, 657, 810
- Galliano (2004) Galliano, F. 2004, PhD thesis, University of Paris XI
- Galliano et al. (2008a) Galliano, F., Dwek, E., & Chanial, P. 2008a, ApJ, 672, 214
- Galliano et al. (2008b) Galliano, F., Madden, S. C., Tielens, A. G. G. M., Peeters, E., & Jones, A. P. 2008b, ApJ accepted, astro-ph/0801.4955
- Galliano et al. (2008c) Galliano, F., Wolfire, M. G., Tielens, A. G. G. M., et al. 2008c, ApJ, in prep.
- Genzel et al. (1998) Genzel, R., Lutz, D., Sturm, E., et al. 1998, ApJ, 498, 579
- Kaneda et al. (2007) Kaneda, H., Onaka, T., & Sakon, I. 2007, ApJ, 666, L21
- Kaufman et al. (2006) Kaufman, M. J., Wolfire, M. G., & Hollenbach, D. J. 2006, ApJ, 644, 283
- Li & Draine (2001) Li, A. & Draine, B. T. 2001, ApJ, 554, 778
- Madden et al. (2006) Madden, S. C., Galliano, F., Jones, A. P., & Sauvage, M. 2006, A&A, 446, 877
- Mathis et al. (1983) Mathis, J. S., Mezger, P. G., & Panagia, N. 1983, A&A, 128, 212
- Peeters et al. (2004) Peeters, E., Spoon, H. W. W., & Tielens, A. G. G. M. 2004, ApJ, 613, 986
- Smith et al. (2007) Smith, J. D. T., Draine, B. T., Dale, D. A., et al. 2007, ApJ, 656, 770
- Vermeij et al. (2002) Vermeij, R., Peeters, E., Tielens, A. G. G. M., & van der Hulst, J. M. 2002, A&A, 382, 1042
- Zubko et al. (2004) Zubko, V., Dwek, E., & Arendt, R. G. 2004, ApJS, 152, 211