Unveiling the Important Role of Groups in the Evolution of Massive Galaxies: Insights from an Infrared Passive Sequence at Intermediate Redshift
Abstract
The most massive galaxies in the Universe are also the oldest. To overturn this apparent contradiction with hierarchical growth models, we focus on the group-scale haloes which host most of these galaxies. Our group sample is selected in redshift space from the CNOC2 redshift survey. A stellar mass selected sample is constructed using IRAC observations. A sensitive Mid InfraRed (MIR) IRAC colour is used to isolate passive galaxies. It produces a bimodal distribution, in which passive galaxies (highlighted by morphological early-types) define a tight MIR colour sequence (Infrared Passive Sequence, IPS). This is due to stellar atmospheric emission from old stellar populations. Significantly offset from the IPS are galaxies where reemission by dust boosts emission at =8µm. We term them InfraRed-Excess galaxies whether star formation and/or AGN activity are present. They include all known morphological late-types. Comparison with EW[OII] shows that MIR colour is highly sensitive to low levels of activity, and allows us to separate dusty-active from passive galaxies at high stellar mass. The fraction of InfraRed Excess galaxies, drops with , such that at a “crossover mass” of . Within our optically-defined group sample there is a strong and consistent deficit in at all masses, but most clearly at . Suppression of star formation must mainly occur in groups. In particular, the observed trend of with can be explained if suppression of galaxies occurs primarily in the group environment. This is confirmed using a mock galaxy catalogue derived from the Millenium Simulation. In this way, the mass-dependent evolution in (downsizing) can be driven solely by structure growth in the Universe, as more galaxies are accreted into group-sized haloes with cosmic time.
Subject headings:
galaxies: statistics — galaxies: evolution — infrared: galaxies — galaxies: photometry — galaxies: high-redshift — galaxies: clusters: general1. Introduction
Perhaps the biggest puzzle of galaxy formation in recent decades has been the early and rapid formation of the most massive galaxies (Bender et al., 1998; Cimatti et al., 2004). This apparently supported the “monolithic collapse” model (Eggen et al., 1962), in contradiction to the standard picture of a Cold Dark Matter (CDM) Universe, in which galaxies grow hierarchically through mergers, along with the dark matter haloes in which they are embedded (e.g. Benson et al., 2002). Observationally, the picture has been embellished by recent galaxy surveys from to . Going to higher galaxy mass and to denser environments, galaxies are older (Kauffmann et al., 2003; Panter et al., 2003; Poggianti et al., 2004; Thomas et al., 2005; Salim et al., 2005) and more likely to have experienced a shorter star forming life which is now truncated (Yamada et al., 2005; Baldry et al., 2006; Pannella et al., 2006; Haines et al., 2007; Bundy et al., 2006; Hopkins et al., 2007). The term downsizing (Cowie et al., 1999) is used to describe the earlier and less extended star formation histories in more massive galaxies.
Recent attempts to explain downsizing trends have examined the ways in which gas heating and cooling depend upon mass and redshift (e.g. Dekel & Birnboim, 2006), and invoked new heating methods such as feedback from Active Galactic Nuclei (AGN, Bower et al., 2006; Croton et al., 2006). Regardless of the physics, a hierarchical Universe can itself supply a natural explanation for dependence of galaxy properties upon stellar mass and upon environment at the same time (De Lucia et al., 2006). As more and more massive galaxies are encorporated into more and more massive haloes, the probability of star formation being truncated is increased. Even in the populous loose group environment the properties of galaxies depend strongly upon environment (e.g. Postman & Geller, 1984; Zabludoff & Mulchaey, 1998; Lewis et al., 2002; Gómez et al., 2003; Balogh et al., 2004; Wilman et al., 2005; Weinmann et al., 2006; Gerke et al., 2007). Thus, evolution in groups can play an important role in driving evolutionary trends.
The fraction of passive galaxies increases steadily and monotonically with increasing stellar mass. It is therefore convenient to quantify downsizing trends by identifying a stellar mass at which the fraction of passive (or red/early-type) galaxies is defined to be exactly 50. This has no physical significance, and so we prefer to call this the “crossover mass” () rather than the “transition mass” (e.g. Bundy et al., 2006). decreases strongly with increasing environmental density (Baldry et al., 2006; Bundy et al., 2006; Haines et al., 2007), with a maximum in the lowest density environments where the red galaxy fraction is 50 (Baldry et al., 2006). The evolution of for the global population, indicates at and at (Hopkins et al., 2007).
These studies, mostly at rest-frame UV to optical wavelengths, are hindered by the strong correlation between galaxy mass and dust attenuation in star-forming galaxies (Giovanelli et al., 1995; Wang & Heckman, 1996; Masters et al., 2003; Brinchmann et al., 2004; Weiner et al., 2007). This correlation may arise directly from the variations of star formation history with mass (Calura et al., 2007) and can lead to confusion between truly passive and dusty star forming galaxies. In some cases light from the youngest stars can be totally removed from the line of sight, not only because their SED peaks at shorter wavelengths where dust attenuation is most effective (e.g. Pierini et al., 2004), but also because the HII regions in which they are embedded can be particularly dusty (Duc et al., 2002; Tuffs et al., 2004). This degeneracy of passive versus dusty star forming galaxies is well known at high redshifts, where a selection of optically red galaxies (Extremely Red Object/Galaxy -ERO/ERG or Distant Red Galaxy - DRG) is more and more likely to select dusty starbursts as one moves to even higher redshift (from at (Cimatti et al., 2002; Lotz et al., 2008) to at (Papovich et al., 2006), with an increasing contribution from increasingly active infrared-bright galaxies (Caputi et al., 2006; Daddi et al., 2007)).
Even in the local Universe the optical red sequence (e.g. Bower et al., 1992) is contaminated with star-forming galaxies and some AGN. These “interlopers” can be identified using optical or UV colour-colour diagrams or high signal to noise emission line measurements (e.g. Wolf et al., 2005; Haines et al., 2007). However the dust emission really stands out in the infrared where the absorbed energy (mainly non-ionizing UV photons) is re-emitted (Popescu et al., 2000, and references therein). of red-sequence galaxies (by number density) are 24µm-bright, corresponding to star-forming galaxies and AGN-host galaxies (Davoodi et al., 2006).
At shorter wavelengths (3-12µm) strong emission features exist in the presence of star formation (Phillips et al., 1984; Roche et al., 1991). However they are usually absent in the more highly ionized environments typical of AGN (Aitken et al., 1982; Roche et al., 1984, 1991). These have been identified as PAH (Polycyclic-Aromatic-Hydrocarbon) features (most obviously characterized by the strong, broad emission features at 6.2µm 7.7µm 8.6µm and 11.3µm, Leger & Puget, 1984; Desert et al., 1990), and loosely trace star formation rates on the scale of a galaxy (Roussel et al., 2001). Spectral diagnostics have been developed using the strengths of these features to distinguish star formation from nuclear activity (Genzel et al., 1998; Laurent et al., 2000). PAH carriers are apparently ubiquitous in high metallicity star-forming galaxies (e.g. Boselli et al., 1998; Genzel & Cesarsky, 2000; Draine et al., 2007), although in low metallicity galaxies they may be absent (Engelbracht et al., 2005; Draine et al., 2007). Calibration of physical quantities, such as star formation rate, from PAH bands is complicated by the relative importance of circumstellar dust, and diffuse dust heated by the general radiation field or collisional impacts. These components may be significant for galaxies with low to moderate star formation rates and dust contents (see e.g. Boselli et al., 2004; Pérez-González et al., 2006; Calzetti et al., 2007).
To keep things simple, one can construct Mid-InfraRed (MIR) colours as opposed to calibrating star formation rates. The wealth of information in this spectral range prompted the use of MIR colours to trace star formation, dust temperature and nuclear activity (e.g. Dale et al., 2000; Boselli et al., 2003; Fisher, 2006). Normalizing the flux from a dust-sensitive band (µm) by a stellar mass-sensitive band (tracing old stellar populations, e.g. at 3.6µm) produces a MIR colour highly sensitive to the level of dust emission per unit stellar mass. This is especially well correlated with morphology, tracing the warm dust emission from star-forming spiral arms (Pahre et al., 2004a). Indeed, in the local Universe, the MIR colour can effectively predict morphology. Li et al. (2007) find 88 early-types below and 83 late-types above this division 111Includes assumed stellar contribution to (8) of 0.232(3.6).. The combined sample exhibits a bimodal distribution in MIR colour. Johnson et al. (2007) also see this bimodality in MIR colours for galaxies in Hickson Compact Groups, and show that the fraction of MIR-passive galaxies is much higher in the more evolved (HI-poor and X-ray bright) groups. These results demonstrate the power of IRAC colours to separate truly passive galaxies from star-forming or AGN-host galaxies without the dust-driven degeneracies of optical and UV studies.
Our goal is to isolate truly passive galaxies and thus trace the build-up of the increasingly important population of passively evolving galaxies in the Universe, as a function of environment. In particular, we wish to study massive () galaxies at , where the contributions of both passive and dusty star-forming galaxies are important, but can be confused with each other without due attention. Separating these populations using the MIR colour will alleviate this problem. Strong evolution in the dust and star formation properties of normal galaxies over the range is expected: At spirals dominate the Luminous InfraRed Galaxy (LIRG) population (Bell et al., 2005; Rowan-Robinson et al., 2005; Zheng et al., 2007), whilst today galaxies of equivalent infrared luminosities are much rarer, and are typically interacting systems and mergers. Our galaxy sample, selected from the CNOC2 redshift survey (Yee et al., 2000), probes intermediate redshifts (). This redshift corresponds to a look-back time of , when the volume-averaged star formation rate in the Universe was significantly higher than it is today (Lilly et al., 1996; Madau et al., 1998; Hopkins, 2004).
In Section 2 our sample is introduced, including archive IRAC data in our fields. From this stellar masses and MIR colours are derived, a mass-selected sample is constructed. Selection effects will be discussed in detail. Section 3 presents the MIR colours of galaxies as a function of their stellar masses and morphologies. A tight Infrared Passive Sequence is identified in the MIR colour-mass plane as a tool to select passive galaxies. Section 4 examines the correlation of MIR colour with the EW[OII] emission line diagnostic, testing their relative sensitivity. In Section 5 we compute the fraction of massive galaxies with InfraRed Excess (IRE galaxies) as a function of stellar mass. The role of the group environment is discussed in Section 6, where we examine galaxies in our optical group catalogue (Carlberg et al., 2001). Finally, our results are discussed in the context of our current understanding of galaxy evolution and the group environment in Section 7. In particular, by applying a simple model to a mock galaxy catalogue, we focus on the possibility that downsizing is intimately related to, if not entirely caused by, the growth of structure with time. Our conclusions are presented in Section 8. Throughout this paper a cosmology with 0.3, 0.7 and = 100 with =0.75 is assumed.
2. Sample
The objective of this paper is to study MIR activity in galaxies as a function of their stellar mass and environment. This is facilitated by the construction of a mass-selected sample in the redshift range , described in this section.
2.1. CNOC2 Survey and Groups
Our sample is based upon the CNOC2 redshift survey which is magnitude limited down to in photometry and totals 1.5 ∘ within four separate patches on the sky. Spectroscopic redshifts exist for a large and unbiased sample of galaxies (Yee et al., 2000). Within the fields of 20 kinematically selected groups from the catalogue of Carlberg et al. (2001), the original photometry and spectroscopy have been supplemented with targetted spectroscopy to using the Magellan 6.5m telescope (Wilman et al., 2005), and F775W-band HST ACS imaging. Galaxies with spectroscopic redshifts and ACS coverage have been visually morphologically classified by one of the authors (Augustus Oemler Jr, hereafter AO).
The probability that a galaxy has a redshift is a function of its -band magnitude, and is unbiased to . To study the statistical properties of galaxies as a function of their stellar mass (and not -band magnitude), we must statistically correct for this selection function and magnitude limit. This is achieved by weighting galaxies by the inverse probability that they appear in the spectroscopic sample. There are two components to this weight:
-
•
A weight to account for the fraction of galaxies which are targetted spectroscopically (with measured redshifts) as a function of -band magnitude. Since below the success of redshift determination may be biased in favour of emission line galaxies, is set to 0 for .
-
•
A weight to account for the fraction of sample volume within which a galaxy would fall out of our sample (effectively a correction). For a sample, this means that for each galaxy in the sample, ( to )( to ) where V is the cosmological volume in our chosen cosmology, and is the redshift at which the galaxy would have a magnitude .
Then the final weight for each galaxy is simply: .
2.2. IRAC Photometry
The Spitzer Space Telescope GTO program 64 (PI Fazio) included an IRAC (Infrared Array Camera, Fazio et al., 2004) scan-map survey of 20′30′ regions in the centre of three of the four CNOC2 patches. The IRAC focal plane geometry translates each mapping into one mapping of bands 1 (3.6µm) and 3 (5.8µm) and another mapping of bands 2 (4.5µm) and 4 (8.0µm), offset by 6.7′.
The astrometrically and photometrically calibrated post-BCD (Post – Basic Calibrated Data) products were retrieved from the Spitzer archive. The pipeline version used was S11.4.0. The processed images are clean, with no image artifacts, and provide stable source flux measurements and accurate sub-arcsecond astrometry. Apart from at the map edges, all sources receive 500 s imaging time in all four bands (100 s frame-time at five dithered positions). The complete four band IRAC coverage has significant () overlap with six ACS fields, where galaxies have also been morphologically classified. Shallow MIPS 24µm imaging is also available, but with lower sensitivity and poorer diffraction-limited resolution than the IRAC bands.
For all sources detected in the 3.6µm frame, colours are measured using the SExtractor package (Bertin & Arnouts, 1996) in double-image mode. They are derived from fluxes measured inside 3″ radius apertures centred at the position of all 3.6µm detected objects, in all IRAC bands. Detection requires at least four adjacent pixels which are at least 1.5- above the background level at 3.6µm. Aperture corrections were computed to correct for light lost from the aperture due to the spatial extent of the PRF (Point Response Function)222Measured by combining larger aperture measurements for isolated stars with IRAC Data Handbook values. Corrections are 1.184, 1.180, 1.249 and 1.404 for IRAC bands 1-4 respectively.. Corrected measurements are used to compute flux ratios (colours) within the aperture. The SExtractor FLUX_AUTO Kron-like measurement provides more stable total flux measurements, and thus is used to compute absolute galaxy luminosity at 3.6µm. We follow the practice of SWIRE333swire.ipac.caltech.edu/swire/astronomers/publications and compute the flux error from the measurement image itself, weighted by inverse variance using the coverage map.
To match the 3.6µm selected catalogue to the CNOC2 redshift catalogue, we apply the tmatch tool in iraf 444IRAF is distributed by the National Optical Astronomy Observatories, which are operated by the Association of Universities for Research in Astronomy, Inc., under cooperative agreement with the National Science Foundation. None of the galaxies in our spectroscopic sample are lost from the IRAC sample due to lack of sensitivity except at the edge of the IRAC field. Visual inspection shows that CNOC2 galaxies with no match either lie outside the IRAC zone of full coverage, can be identified with sources improperly deblended by SExtractor, or lie in regions of particularly poor CNOC2 astrometry. The sample is then limited to those objects with unambiguous matches, with no apparent bias relative to the of CNOC2 galaxies with IRAC coverage which are lost at this stage. However, to maintain statistical accuracy the weight is modified to account for galaxies without spectroscopy or 3.6µm matches, as a function of -band magnitude. At 3.6µm, the 2- depth is 1Jy (for a passive galaxy at z0.4, this corresponds to a stellar mass of ).
The goal is to construct a mass-selected sample for which representative spectroscopy is available, and reaching required depth at 8µm to distinguish passive galaxies from those with excess emission at 8µm (2- depth of 10Jy). Effectively, these criteria set the mass limit to , well above the 3.6µm limit (§ 2.4 for more details).
2.3. Deriving Stellar Masses and MIR Colours
2.3.1 Stellar Mass
Near InfraRed (NIR) light is a useful tracer of stellar mass because of the weak dependence on star formation history (Aaronson et al., 1979; Rix & Rieke, 1993; Bell & de Jong, 2001). 3.6µm flux has been converted into luminosity and thence to stellar mass following Balogh et al. (2007). To give a brief overview of this procedure: Observed-frame AB luminosities are computed for the assumed cosmology, and an empirical k-correction is applied to correct to a consistent rest-frame of a galaxy. In this paper, we will call this 0.4[3.6]. Secondary corrections are then applied to move into the K-band rest-frame. These corrections are calibrated for objects with both [3.6] and K-band photometry (not used in this paper). The mass to light ratio of each galaxy in K-band () is estimated using a combination of two simple Bruzual & Charlot (2003) models with a Chabrier (2003) IMF. For blue galaxies (), a constant star formation model with dust extinction 1 mag gives = 0.2. For red galaxies (), a 11.7-Gyr old, dust free single stellar population model gives = 0.7. For intermediate colours a linear interpolation between these values is used. For more details, please refer to Balogh et al. (2007). This means that the full range of galaxy types only exhibit a range in (and thus also ) of 3.5. Therefore our results are relatively insensitive to whether we select in mass or 0.4[3.6] luminosity. We prefer to select in mass as it is the more physical quantity and, thus, allows a comparison with the literature.
2.3.2 MIR colour
The two template spectra in the top panel of Figure 1 demonstrate the diversity and wealth of spectral information at MIR wavelengths. A passive, dust-free galaxy is likely to exhibit a spectrum similar to the SSP template (dashed line). With no dust emission, the infrared emission originates solely from photospheres of the cold stellar population, primarily giant M-stars. Conversely, the spectrum of a dusty star forming galaxy should look more like that of M82 (solid line). Beyond µm, a typical dust emission spectrum with characteristic PAH features comes to dominate the M82 template.
The lower panel of Figure 1 shows the transmission function of the IRAC bands at 3.6µm and 8µm, and the MIPS (Multi-Band Imaging Photometer for Spitzer, Rieke et al., 2004) 24µm band. Each transmission function is transformed to indicate the rest-frame wavelength domain probed for a galaxy located at , or . It is clear that excess (enhanced beyond pure stellar photospheric) emission can be revealed at both 8µm and 24µm for galaxies within the redshift range of interest. For galaxies, the 8µm band captures the strong 6.2µm PAH feature, tracing star formation (e.g. Peeters et al., 2004; Förster Schreiber et al., 2004). Crucially, stellar atmospheric emission drops off significantly from 8µm to 24µm: Thus detection of passive galaxies, and thence accurate separation of passive from star-forming or AGN-host galaxies, requires much shallower exposures at 8µm than 24µm. A colour constructed from 8µm and 3.6µm has the leverage on the galaxy spectrum to make this distinction. In this paper we focus on IRAC data for these reasons.

For the sake of simplicity, we compute k-corrected MIR colours of our galaxies using a linear combination of the two simple templates in Figure 1 (similar to the approach of Huang et al., 2007). We define our colour to be the flux-ratio 555for a more traditional colour, simply compute [3.6]-[8] = +2.5log10(). For each galaxy, the quantity is measured: This is the required fractional contribution from the M82 template to match the observed-frame 666The prefix superscipt z is used to indicate the band-pass (Blanton & Roweis, 2007); i.e. the redshift of a galaxy for which the k-correction is defined to be zero.. Our k-corrections are based on the assumption that (approximately dust to stellar flux ratio), would be the same regardless of the redshift of the galaxy (and thus the part of the spectrum sampled). is computed as:
| (1) |
To minimize the k-corrections is transformed to the equivalent colour for a z=0.4 galaxy, and limit ourselves to galaxies in the narrow redshift range , an epoch ago. The k-corrected colour is computed as:
| (2) |
A pure SSP k-correction () increases by going from ages of 8 to 1, and going from solar to solar metallicity. For (M82-like), =2.17 ( times the stellar photospheric continuum emission within the IRAC 8µm band). Whilst k-corrections of high galaxies are more uncertain due to the assumed M82 template, k-corrections remain relatively small within our redshift range ( for ). In this paper we will only separate dusty galaxies emitting excess light at infrared wavelengths from passive galaxies, and will not draw strong conclusions from precise MIR colours of dusty galaxies which are sensitive to the applied k-correction. To this extent, we believe that we are justified in applying these rough k-corrections.
2.4. A Mass-Selected Sample
In this paper, our analysis is limited to the subsample of galaxies with known redshifts , and with full IRAC coverage. Of these, the 333 galaxies with stellar masses are selected, corresponding to a luminosity of 0.4[3.6]=-20.89 for passively evolving galaxies, or a flux of Jy, well above the detection limit.
This stellar mass limit is actually defined by the depth of the data, since we require this colour information for our analysis. In our mass-limited sample, 313 of the 333 galaxies are detected () at , and the remainder have upper limits that are sufficient to identify them as passively evolving galaxies, characterised by colours (see § 3 for a justification of this definition).
The requirement that all galaxies have a spectroscopic redshift introduces sensitivity to the optical () selection function. To account for selection bias, the spectroscopic selection weight is applied (§2.1). This weight includes the factor which applies a volume correction to correct for galaxies which fall out of the sample at . Within a sample, the lowest mass and highest redshift galaxies with high mass to light ratios will not make this magnitude cut. Nonetheless, the weighted sample is still representative: A passively evolving galaxy can be sampled with up to a redshift of ( of the volume sampled) and receives a weight . There do exist four galaxies with unusually high mass to optical light ratios. These can more easily be lost from the sample due to their extremely red optical-NIR colours. Such red colours can exist where there is extreme dust extinction, or a population of AGB stars boosting NIR luminosity. However, they are too few to significantly influence our statistics. Our sample of 333 galaxies includes eleven galaxies with . These are assigned zero weight, but it is worth noting that the IRE fraction of these optically faint galaxies is comparable to that of other galaxies. In practice, our results are not strongly sensitive to the statistical weights.
3. Bimodal MIR Colours and a Passive Sequence
In this section the distribution of the MIR colour , and its dependence on galaxy stellar mass is investigated. Figure 2 shows how the 333 galaxies in our , sample populate the - “colour-mass” plane, along with the and percentiles of the distribution.
The distribution shifts to lower with higher mass. Dust flux per unit stellar mass can be approximated by where the stellar atmospheric contribution to is estimated by the SSP template to be (dotted line). The median relation between and stellar mass can be well fit by a linear relation in log space: . This relation is significantly shallower than would be expected for no relation between dust flux and stellar mass (). However, this is sensitive to the exact value of chosen.
We also examine whether the strong correlation between MIR activity and morphology observed in the local Universe (Pahre et al., 2004a; Li et al., 2007) extends to our intermediate redshift sample. 31 of the galaxies in our sample are within the ACS fields and have been morphologically classified by AO. These are indicated in Figure 2.
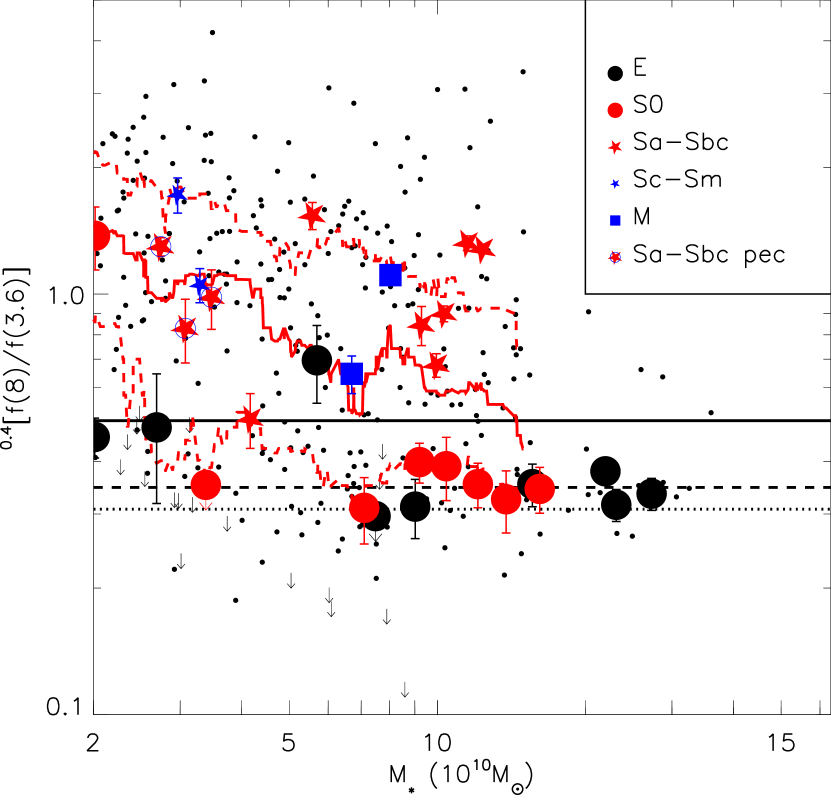
Morphologically classified early-type (Elliptical and S0) and late-type (mainly spiral) galaxies exhibit very different MIR colour distributions, as seen locally by Li et al. (2007). In fact, the overall distribution in is bimodal in nature, with the two peaks in MIR colour almost equivalent to these two morphological classes. This bimodality has been observed in other (local) optical-NIR selected samples (Li et al., 2007; Johnson et al., 2007) whilst it is less obvious in shallow 8µm-selected samples where early-types are more difficult to detect (Huang et al., 2007). The bimodality of CNOC2 galaxies is demonstrated in Figure 3, split into two bins of stellar mass. Within each mass range there exists a significant population of galaxies with and then a gap before the onset of a second population of galaxies emitting more strongly at 8µm. Whilst the full distribution seems to shift to higher at lower mass, the value is within the gap across our mass range. Thus we adopt this value to divide the sample: Everything with we call an InfraRed-Excess (IRE) galaxy. This division at 0.5 excludes galaxies from the passive population if they have more 8µm flux than the early-type locus. Contribution from circumstellar dust (Piovan et al., 2003; Temi et al., 2008) or silicate emission from mass-loss (Bressan et al., 2007) are unlikely to produce such a strong boost to the 8µm flux.
The dash-filled histogram in Figure 3 indicates the distribution for morphologically early-type galaxies. The tight distribution of high mass early-types is mirrored in the narrow locus of almost constant colour in the colour-mass plane (Figure 2). The 11 early-types (ignoring the single upper limit) with have mean colour and scatter (horizontal dashed line in Figure 2). The scatter is consistent with the photometric errors. We call this the Infrared Passive Sequence (IPS), which is not far offset from the template SSP colour (, horizontal dotted line). The peak value and scatter of the IPS for the full population of galaxies is . The tight scatter of the IPS is reminiscent of the optical red sequence (e.g. Bower et al., 1992). Indeed the tightness of the IPS is due to the emission from stellar atmospheres of cold stars in passive galaxies, which is relatively little sensitivity to age or metallicity. Mid Infrared wavelengths are highly sensitive to dust emission; thus the Infrared Passive Sequence does not suffer from the degeneracy between dusty red galaxies and passive red galaxies as by a red sequence defined at optical wavelengths.

The second, broader peak at contains IRE galaxies with excess (non-stellar) emission at 8µm. This excess emission traces some kind of activity, i.e. star formation or AGN. Figures 2 and 3 show that all known late-type galaxies (dot-filled histogram in Figure 3) in the sample inhabit this peak. Two morphologically classified early-type galaxies also exhibit excess emission at 8µm. Excess MIR emission in some early-type galaxies is known to exist, and correlates with low levels of star formation or AGN activity (e.g. Pahre et al., 2004b; Bressan et al., 2007).
4. The -EW[OII] plane
It is useful to compare the MIR colour with an independent, well-studied indicator of activity (primarily star formation), the equivalent width of the [OII]Å emission line. [OII] is most commonly used at z0.3 where the HÅ emission line is redshifted out of the optical window. By normalizing the emission flux by the continuum level, the sensitivity to flux calibration and dust absorption is reduced, producing a normalized quantity more easily comparable to .
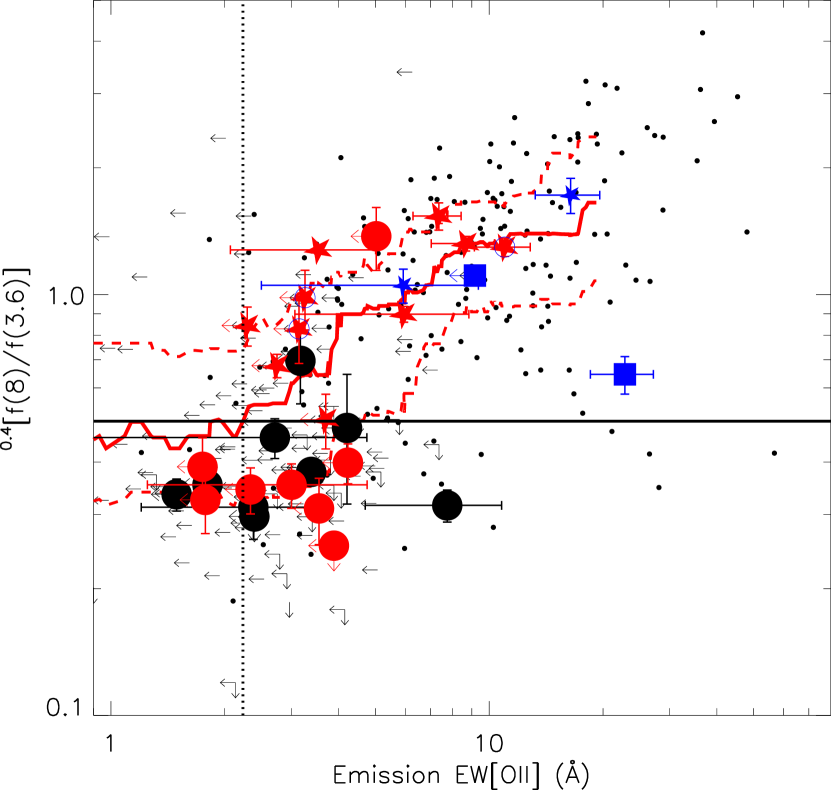
Figure 4 shows the location of our and galaxies (excluding 14 galaxies where EW[OII] could not be measured) in the -EW[OII] plane, including , and percentiles and morphologically classified galaxies overplotted with their errors.
There is a strong correlation between EW[OII] and . Both diagnostics trace galaxy activity, and primarily star formation, and so a strong correlation is expected. A value of EW[OII]Å (dotted vertical line) corresponds to the median galaxy with (our empirical division in MIR colour, solid horizontal line), which is below the [OII] detection limit of most spectroscopic surveys. Indeed, we are only able to identify this value for a large statistical sample: The median error on EW[OII] for individual galaxies in our sample is 2.4Å.
In Balogh et al. (2007), we divided our sample into passive and [OII]-strong galaxies at EW[OII]=10Å. This is the equivalent of a division at for the median galaxy, selecting only the tail of galaxies with the most ongoing activity. A division at EW[OII]=5Å (as used in Wilman et al., 2005) corresponds to . Therefore with a reasonable photometric depth at 6µm, it is possible to pick up levels of activity not possible without extremely deep optical spectroscopy. This inevitably leads to a higher fraction of galaxies defined as non-passive. Many spiral galaxies (mainly of type Sa-Sbc) with have no detectable [OII] emission. Based upon a simple cut in EW[OII], these would be classified as passive spirals (e.g. Poggianti et al., 1999; Balogh et al., 2002). It is now clear that most such galaxies are not truly passive (in the sense of the IPS galaxies): instead there is evidence at 8µm of some ongoing activity. This indicates that the morphological transformation is more intimately linked to (and concurrent with) the complete cessation of star formation than previously believed.
The distribution of galaxies in the -EW[OII] plane exhibits a lot of scatter around the median relation. Both EW[OII] and are highly sensitive to the presence of dust (through extinction of the [OII] emission by dust, and abundance of PAH carriers), which is itself dependent on the galaxy mass and star formation rate (Giovanelli et al., 1995; Wang & Heckman, 1996; Masters et al., 2003; Brinchmann et al., 2004). Thus whilst MIR diagnostics are better at tracing activity in high mass galaxies, activity in lower mass galaxies may be better traced with optical diagnostics (especially at significantly sub-solar metallicity and thus very low mass where PAH features disappear, Engelbracht et al., 2005; Draine et al., 2007). However, within the mass range traced here, the median relation for EW[OII] goes as , similar to the dependence of (once corrected for the stellar atmospheric contribution). To compute EW[OII], the [OII] line flux is normalized by the continuum at Å, which will lead to a shallower slope than would a normalizion by mass. It is likely that this effect counters any steeper relation expected due to different dust dependencies. Therefore, other physical parameters are necessary to drive the scatter in the -EW[OII] plane, together with large measurement errors.
There exists a strange population of galaxies extending to high EW[OII] at low . These galaxies diverge from the usual situation in massive galaxies: Namely, that infrared data traces activity to much lower levels than emission lines. For two of the four galaxies with and EW[OII]Å, the redshift depends upon a single emission line and might therefore be incorrect. Another possibility is that the [OII] emission originates in a low mass/metallicity galaxy which is falsely matched to a bright IRAC source. Visual checks suggest this is unlikely, but cannot be certain. Alternatively, these galaxies might be unusually bright at 3.6µm for their mass or metallicity. This may occur in metal-poor high mass galaxies (weird) or galaxies with a strong and very hot AGN component contributing most significantly to the 3.6µm-band (and AGN activity can also boost the [OII] emission, Yan et al. (2006)). The only morphologically classified galaxy at high EW[OII] and low is a merger galaxy. This could be explained by either of the above scenarios, or a third scenario in which a merger-driven starburst produces such a hard radiation field that it is capable of destroying the PAH carriers. Whatever their origin, these galaxies form a puzzling, possibly interesting, but small minority.
5. Frequency of Infrared-Excess Massive Galaxies
Within our representative sample of and galaxies, we now measure the fraction of InfraRed Excess galaxies, .
Activity is traced with down to very low levels at which both star formation and nuclear activity play a role. We will not distinguish between these two forms of activity in this paper, instead merely computing the total fraction of IRE galaxies. However, any galaxy which has gas accreting onto a super-massive black hole is likely to be simultaneously forming stars (Brinchmann et al., 2004; Berta et al., 2007; Shi et al., 2007). Hence such galaxies are correctly distinguished from the passive population.

To measure , the fraction of galaxies with is computed, with galaxies weighted to account for the magnitude-dependent selection function (Section 2.4). The application of this weight does not significantly change the results. To place errors on , we perform bootstrap resampling of the sample. This is done by creating 1000 independent samples of the same size as the true sample: Within each sample, values of are taken randomly and often repeatedly from the true sample, and scattered using a gaussian kernel of width equal to the error on . The standard deviation of from the bootstrap samples is taken for the error on .
Figure 5(a) (solid points and line) shows binned by stellar mass for the global population. Bins are not equally populated. Instead they are defined such that there is an approximately equal number of group galaxies per bin (§ 6). declines with , an effect seen previously in the median and percentiles. However this is only evident in the highest mass bin.
To test for effects of cosmic variance, this exercise is repeated independently for each of the three CNOC2 patches with IRAC coverage 777CNOC2 consists of four patches spaced at intervals of ° in RA, of which three are partially mapped by IRAC.. The patch to patch offsets in are , compatible with the bootstrap errors, and indicating that cosmic variance is not a dominant source of error. Therefore this result is robust.
The crossover mass (, where : dotted horizontal line), is (dashed vertical line). Hopkins et al. (2007) compiled estimates of (their “”) at different redshift. These are scaled to a Chabrier IMF and our cosmological parameters for comparison with our measurement. Defining as the stellar mass at which 50 of galaxies are optically blue or have a high specific star formation rate (calibrated using emission lines), they measure at , almost an order of magnitude lower than our estimate. This probably reflects our sensitivity to low levels of star formation in high mass galaxies. However, a definition of 50 morphologically late-type galaxies results in an estimate of at , much more compatible with our value within errors. This suggests that morphological selection is identifying more or less the same population as infrared selection. This is interesting, as it tells us that morphological transformation usually goes hand in hand with the final truncation of star formation in massive galaxies.
6. The Group Environment
We will now examine how the fraction of InfraRed Excess galaxies depends upon the group environment by computing for group galaxies as a function of stellar mass. Groups were detected as overdensities in redshift space by applying a friends-of-friends algorithm to the CNOC2 redshift survey (Carlberg et al., 2001). Membership has been reassigned after inclusion of additional spectroscopy and application of the membership algorithm defined in Wilman et al. (2005)888The group aspect ratio, b, is set to 5.. To ensure most group galaxies are not interlopers (i.e. nearby galaxies not bound to the group at the time of observation) the sample is limited to those within of the luminosity-weighted group centre. corresponds to the virial radius for a group at =. Our decision to select group galaxies within a fixed radial aperture instead of a scaled aperture (e.g. the virial radius) is made because measurements of velocity dispersions are uncertain, and known to be heavily biased for systems with members (e.g. Zabludoff & Mulchaey, 1998). 78/333 galaxies from the mass-selected sample match these group criteria. Of these are in groups with measured velocity dispersions, ; are in groups with ; and are in the cluster g226 ().
The dashed line and open symbols in Figure 5(a) show how depends upon stellar mass for group galaxies only. Each bin contains 19 or 20 group galaxies by design, and appears to show a deficit of IRE galaxies with respect to the global population. This is not highly significant in individual mass bins, but is consistent at all masses. Thus we estimate the combined significance for the whole sample. In groups, the combined value of is 0.447. As the mass distribution of group galaxies is biased to high mass relative to the global sample, the global sample is resampled to match the group sample on mass. For each group galaxy, a random galaxy is selected from the nearest 10 galaxies in stellar mass (from the global sample, other than itself, and with no repeats). This resampling process is repeated 10000 times, each time computing for the matched sample. On only 56 out of 10000 occasions is . This corresponds to a likelihood ( from a one-tailed gaussian) that the low value of in groups arises by chance.
The lower value of in groups independent of the stellar mass indicates that activity in galaxies is often suppressed by the group environment. As these groups are predominantly low velocity dispersion, often unvirialised systems, this means that massive galaxies are already affected by the low mass halo environment. The mechanism of suppression seems to be particularly active in the highest stellar mass bin () where in groups . In this mass bin the group galaxies also dominate the passive global population: Out of a total of 43 galaxies (25 passive), 20 are in our group sample (17 passive). Hence the most massive galaxies seem to become passive in the group environment. This result is even more remarkable when it is considered that the group sample is incomplete due to incompleteness effects in the CNOC2 redshift survey, and so the global sample should include more group galaxies than have been identified.
It is prudent to repeat this exercise as a function of 0.4[3.6] luminosity to ensure this result does not somehow depend upon our mass calibration. Figure 5(b) shows how depends upon 0.4[3.6] luminosity for a luminosity-selected sample (0.4[3.6]). Luminosity selection allows an additional 180 galaxies to make it into the sample with lower than maximum mass to light ratios. Effectively this means that the overall value of f(IRE) is higher for the luminosity-selected sample () than for the mass-selected sample (). The trends mirror those seen as a function of mass with the exception that in the bin of highest luminosity the global is still quite high (0.6450.047). This is because IRE galaxies are more likely to be found in the high luminosity bin than in the high mass bin, due to their lower mass to light ratios. In groups the dominance of passive galaxies is so strong as to mitigate this effect.
7. Discussion
MIR colour is a highly sensitive tracer of activity in galaxies. This has allowed us to separate truly passive galaxies (typically morphologically early-type) from galaxies with InfraRed Excess at 8µm (IRE galaxies). In this way we avoid confusion between galaxies with low but still ongoing star formation and those which have shutdown their star formation altogether (probably coincident with the morphological transformation). Other studies examine the evolution in fractions of highly star forming galaxies (LIRGs, ULIRGs etc: Bell et al., 2005; Le Floc’h et al., 2005; Hammer et al., 2005; Caputi et al., 2006; Daddi et al., 2007). These fractions decline steeply with cosmic time, with contributions from generally declining star formation rates in most galaxies, and complete suppression in some.
Our main result is that a strong and highly significant deficit in the fraction of InfraRed Excess galaxies, , exists in optically selected, mostly low velocity dispersion groups at z0.4, and is independent of stellar mass. The suppression of infrared activity in low redshift Hickson Compact groups (Johnson et al., 2007) therefore extends to the “loose group” regime at z0.4.
Our group data indicate a dramatic drop in at stellar masses . This coincides with the stellar mass at which a galaxy’s own halo usually exceeds , which is also the mass of the Local Group (Li & White, 2007) and typical of the lower mass groups in our sample (McGee et al., submitted). Therefore galaxies with are typically “central” galaxies in groups, which is why many of our most massive galaxies are members of known groups. The low mass group environment suppresses star formation in both central massive galaxies and their satellites. The strongest effect is in the central galaxies.
In this paper, we do not fully constrain the mechanism(s) responsible for suppressing activity in groups. For a discussion of the menagerie of possibilities we refer to Moran et al. (2007, and references therein). The ability to detect low levels of activity has important implications for the interpretation of passive spirals as identified purely from their [OII] emission (Poggianti et al., 1999; Balogh et al., 2002; Moran et al., 2006). Our strongest direct constraint on the mechanism(s) at work is that it (they) must be active in low mass group haloes. This probably excludes processes such as ram-pressure stripping which prefer much higher density environments (Gunn & Gott, 1972; Quilis et al., 2000).
Relating the suppression of star formation to a halo mass threshold is theoretically attractive, as the physics of gas accretion and feedback are more likely to relate to the gravitationally bound material within the halo than to the stellar mass of the galaxy itself (e.g. Dekel & Birnboim, 2006). For example, AGN feedback processes might be especially efficient in galaxies located inside group-sized haloes. Brightest Group Galaxies (BGGs) more frequently contain radio-loud AGN than similarly massive non-BGGs. This is likely to be related to the cooling of the hot Intra-Group Medium (IGM) onto the BGG, fuelling a radio-loud AGN (Best et al., 2007).
Our data alone is not sufficient to examine how the suppression of star formation within group-mass haloes contributes to the global population in a statistical manner. Incompleteness of the CNOC2 redshift survey and uncertainties in the construction of the group catalogue and galaxy membership inevitably leads to incompleteness of our group galaxy sample in a way which may depend upon galaxy stellar mass. To better estimate membership on a statistical basis, we use a simulated galaxy catalogue in which stellar mass and embedding halo mass can be directly evaluated for each galaxy at =. We choose the “mock” galaxy catalogue of Bower et al. (2006) which is based upon the Millenium Simulation, a simulated CDM Universe with sides (Springel et al., 2005). These dark matter haloes are populated with mock galaxies using a semi-analytic technique. Only the positions (environment) and stellar masses of these galaxies are used. The mock galaxies are assumed to be in groups where they are located within haloes . Mock group galaxies are then assigned a probability that they are IRE galaxies consistent with the data: i.e. for the galaxies and for the galaxies (as seen in Figure 5(a)). Combined with the rest of the mock galaxy population (“field” galaxies), the dependence of upon stellar mass is compared to the CNOC2 global trend. By setting the fraction of IRE field galaxies to 0.9, regardless of their stellar mass, the global trend is well reproduced. This is demonstrated in Figure 6 (a) in which the observed global trend for CNOC2 galaxies (solid points) is extremely well matched by the model (solid line). That the fraction of field galaxies which need to be passive is low (0.1) and independent of stellar mass lends support to our hypothesis that the halo mass is more important than the stellar mass for the suppression of star formation in galaxies.

Figure 6 (a) also shows how depends upon stellar mass for the mock galaxy population evaluated at , , and . Remarkably, the model exhibits a downsizing behaviour, such that the crossover mass decreases at lower redshifts. This is shown in Figure 6 (b) with the CNOC2 datapoint at =. The only reason for this evolution is that the fraction of galaxies in groups increases, as a function of stellar mass, from to . Suppression of galaxy activity in groups, plus the gravitational growth of structure in the Universe, can explain downsizing trends in .
Also in Figure 6 (b) the crossover masses computed in different redshift bins by Bundy et al. (2006) are overplotted (reproduced from their Figure 9: is called the “transition mass” in that paper). These measurements are based on the DEEP2 redshift survey, and contribute to the compilation of Hopkins et al. (2007). is computed for late-type morphologies, galaxies blue in (U-B) colour, and galaxies with [OII]-inferred SFR above 0.2. That more morphologically classified late-type galaxies are detected, resulting in a higher value of , is fully in line with our estimate at z=0.4 using a sensitive MIR colour, well correlated with morphology. Whilst our simple model can qualitatively reproduce a downsizing scenario, comparison with Bundy et al. (2006) suggests that the redshift dependence is probably too shallow. With better constraints at different redshift, a model in which star formation is not immediately suppressed upon incorporation of a galaxy into a massive halo might serve to steepen this evolution.
8. Conclusions
From the CNOC2 redshift survey, we have constructed a mass-selected sample of galaxies with known spectroscopic redshifts , and stellar masses . Whilst the sample is not fully complete, the selection is well understood, and we correct for incompleteness using a simple weighting scheme. Within this sample, the fraction of galaxies with excess emission at 8µm is computed, which traces star formation or nuclear activity. For galaxies in this sample, the Mid InfraRed (MIR) colour has been measured. This is the flux ratio of the 8µm to 3.6µm IRAC bands, k-corrected to a consistent rest-frame of a = galaxy. Based upon this sample we have shown:
-
•
Infrared Passive Sequence: Old stellar populations (such as found in passively evolving galaxies in which star formation has been suppressed) exhibit very predictable colours in the µm spectral region (rest-frame), tracing the stellar atmospheres of giant M-stars. This produces a tight Infrared Passive Sequence (IPS) in the colour. The IPS does not suffer from the optical red sequence degeneracy between dusty red galaxies and passive red galaxies. The mean IPS colour ( at ) is consistent with an old stellar population, and the tight scatter ( at high mass) is consistent with photometric errors. This leaves little room for large variations in metallicity, or additional contributions at µm from circumstellar or diffuse dust.
-
•
MIR Colour Bimodality: The distribution is bimodal, consisting of the IPS and a population of galaxies with significant excess emission at 8µm (InfraRed-Excess Galaxies). These two populations can be divided at .
-
•
Morphologies and infrared emission: 15 out of 17 morphologically classified early-type (elliptical or S0) galaxies have colours consistent with the IPS, whilst no classified late-type galaxy has . This is consistent with known correlations at low redshift between morphology and MIR colours (e.g. Pahre et al., 2004a; Li et al., 2007).
-
•
Tracing low level activity in the MIR: There is a strong correlation between and EW[OII]. However, our division at corresponds to a division at EW[OII]Å for the median galaxy. This is below the [OII] detection limit of most intermediate to high redshift surveys. This shows that MIR diagnostics trace low levels of activity at . Consequently, dividing at selects a high fraction of InfraRed-Excess (IRE) galaxies, , and the crossover mass at which , , is also high with respect to optical studies.
-
•
Consequences for selection of passive spirals: There exist spiral galaxies in our sample with undetected [OII] emission but significant MIR excess emission (). Thus, selection of passive spirals based upon a simple EW[OII] division (e.g. Poggianti et al., 1999; Balogh et al., 2002; Moran et al., 2006) will suffer contamination by dusty, low level star formation, mostly early-type spirals.
-
•
Strong suppression of activity for massive galaxies in low mass groups: In the optically-selected group environment there is a strong and robust (2.5) deficit in compared with global values, independent of stellar mass. This is true across our range in stellar mass , but the suppression appears to be particularly strong at high mass , where the fraction of active group galaxies falls to .
-
•
Suppression in groups can drive the stellar mass dependence, and structure growth can drive downsizing: The global dependence of on stellar mass at = can be accurately reproduced by a simple model in which suppression mainly occurs in groups, and is particularly strong for group galaxies. Furthermore, structure growth in the Universe drives more galaxies into group-sized haloes with cosmic time. This automatically leads to a downsizing phenomenon in the global population, in which the crossover mass evolves to lower masses at lower redshift.
References
- Aaronson et al. (1979) Aaronson, M., Huchra, J., & Mould, J. 1979, ApJ, 229, 1
- Aitken et al. (1982) Aitken, D. K., Roche, P. F., Allen, M. C., & Phillips, M. M. 1982, MNRAS, 199, 31P
- Baldry et al. (2006) Baldry, I. K., Balogh, M. L., Bower, R. G., Glazebrook, K., Nichol, R. C., Bamford, S. P., & Budavari, T. 2006, MNRAS, 373, 469
- Balogh et al. (2002) Balogh, M., Bower, R. G., Smail, I., Ziegler, B. L., Davies, R. L., Gaztelu, A., & Fritz, A. 2002, MNRAS, 337, 256
- Balogh et al. (2004) Balogh, M., Eke, V., Miller, C., Lewis, I., Bower, R., Couch, W., Nichol, R., Bland-Hawthorn, J., Baldry, I. K., Baugh, C., Bridges, T., Cannon, R., Cole, S., Colless, M., Collins, C., Cross, N., Dalton, G., de Propris, R., Driver, S. P., Efstathiou, G., Ellis, R. S., Frenk, C. S., Glazebrook, K., Gomez, P., Gray, A., Hawkins, E., Jackson, C., Lahav, O., Lumsden, S., Maddox, S., Madgwick, D., Norberg, P., Peacock, J. A., Percival, W., Peterson, B. A., Sutherland, W., & Taylor, K. 2004, MNRAS, 348, 1355
- Balogh et al. (2007) Balogh, M. L., Wilman, D., Henderson, R. D. E., Bower, R. G., Gilbank, D., Whitaker, R., Morris, S. L., Hau, G., Mulchaey, J. S., Oemler, A., & Carlberg, R. G. 2007, MNRAS, 374, 1169
- Bell & de Jong (2001) Bell, E. F. & de Jong, R. S. 2001, ApJ, 550, 212
- Bell et al. (2005) Bell, E. F., Papovich, C., Wolf, C., Le Floc’h, E., Caldwell, J. A. R., Barden, M., Egami, E., McIntosh, D. H., Meisenheimer, K., Pérez-González, P. G., Rieke, G. H., Rieke, M. J., Rigby, J. R., & Rix, H.-W. 2005, ApJ, 625, 23
- Bender et al. (1998) Bender, R., Saglia, R. P., Ziegler, B., Belloni, P., Greggio, L., Hopp, U., & Bruzual, G. 1998, ApJ, 493, 529
- Benson et al. (2002) Benson, A. J., Ellis, R. S., & Menanteau, F. 2002, MNRAS, 336, 564
- Berta et al. (2007) Berta, S., Lonsdale, C. J., Siana, B., Farrah, D., Smith, H. E., Polletta, M. C., Franceschini, A., Fritz, J., Perez-Fournon, I., Rowan-Robinson, M., Shupe, D., & Surace, J. 2007, A&A, 467, 565
- Bertin & Arnouts (1996) Bertin, E. & Arnouts, S. 1996, A&AS, 117, 393
- Best et al. (2007) Best, P. N., von der Linden, A., Kauffmann, G., Heckman, T. M., & Kaiser, C. R. 2007, MNRAS, 379, 894
- Blanton & Roweis (2007) Blanton, M. R. & Roweis, S. 2007, AJ, 133, 734
- Boselli et al. (2004) Boselli, A., Lequeux, J., & Gavazzi, G. 2004, A&A, 428, 409
- Boselli et al. (1998) Boselli, A., Lequeux, J., Sauvage, M., Boulade, O., Boulanger, F., Cesarsky, D., Dupraz, C., Madden, S., Viallefond, F., & Vigroux, L. 1998, A&A, 335, 53
- Boselli et al. (2003) Boselli, A., Sauvage, M., Lequeux, J., Donati, A., & Gavazzi, G. 2003, A&A, 406, 867
- Bower et al. (2006) Bower, R. G., Benson, A. J., Malbon, R., Helly, J. C., Frenk, C. S., Baugh, C. M., Cole, S., & Lacey, C. G. 2006, MNRAS, 370, 645
- Bower et al. (1992) Bower, R. G., Lucey, J. R., & Ellis, R. S. 1992, MNRAS, 254, 601
- Bressan et al. (2007) Bressan, A., Panuzzo, P., Silva, L., Buson, L., Clemens, M., Granato, G. L., Rampazzo, R., Valdes, J. R., & Vega, O. 2007, in Astronomical Society of the Pacific Conference Series, Vol. 374, Astronomical Society of the Pacific Conference Series, ed. A. Vallenari, R. Tantalo, L. Portinari, & A. Moretti, 333–+
- Brinchmann et al. (2004) Brinchmann, J., Charlot, S., White, S. D. M., Tremonti, C., Kauffmann, G., Heckman, T., & Brinkmann, J. 2004, MNRAS, 351, 1151
- Bruzual & Charlot (2003) Bruzual, G. & Charlot, S. 2003, MNRAS, 344, 1000
- Bundy et al. (2006) Bundy, K., Ellis, R. S., Conselice, C. J., Taylor, J. E., Cooper, M. C., Willmer, C. N. A., Weiner, B. J., Coil, A. L., Noeske, K. G., & Eisenhardt, P. R. M. 2006, ApJ, 651, 120
- Calura et al. (2007) Calura, F., Pipino, A., & Matteucci, F. 2007, ArXiv e-prints, 706
- Calzetti et al. (2007) Calzetti, D., Kennicutt, R. C., Engelbracht, C. W., Leitherer, C., Draine, B. T., Kewley, L., Moustakas, J., Sosey, M., Dale, D. A., Gordon, K. D., Helou, G. X., Hollenbach, D. J., Armus, L., Bendo, G., Bot, C., Buckalew, B., Jarrett, T., Li, A., Meyer, M., Murphy, E. J., Prescott, M., Regan, M. W., Rieke, G. H., Roussel, H., Sheth, K., Smith, J. D. T., Thornley, M. D., & Walter, F. 2007, ApJ, 666, 870
- Caputi et al. (2006) Caputi, K. I., Dole, H., Lagache, G., McLure, R. J., Dunlop, J. S., Puget, J.-L., Le Floc’h, E., & Pérez-González, P. G. 2006, A&A, 454, 143
- Carlberg et al. (2001) Carlberg, R. G., Yee, H. K. C., Morris, S. L., Lin, H., Hall, P. B., Patton, D. R., Sawicki, M., & Shepherd, C. W. 2001, ApJ, 552, 427
- Chabrier (2003) Chabrier, G. 2003, PASP, 115, 763
- Cimatti et al. (2002) Cimatti, A., Daddi, E., Mignoli, M., Pozzetti, L., Renzini, A., Zamorani, G., Broadhurst, T., Fontana, A., Saracco, P., Poli, F., Cristiani, S., D’Odorico, S., Giallongo, E., Gilmozzi, R., & Menci, N. 2002, A&A, 381, L68
- Cimatti et al. (2004) Cimatti, A., Daddi, E., Renzini, A., Cassata, P., Vanzella, E., Pozzetti, L., Cristiani, S., Fontana, A., Rodighiero, G., Mignoli, M., & Zamorani, G. 2004, Nature, 430, 184
- Cowie et al. (1999) Cowie, L. L., Songaila, A., & Barger, A. J. 1999, AJ, 118, 603
- Croton et al. (2006) Croton, D. J., Springel, V., White, S. D. M., De Lucia, G., Frenk, C. S., Gao, L., Jenkins, A., Kauffmann, G., Navarro, J. F., & Yoshida, N. 2006, MNRAS, 365, 11
- Daddi et al. (2007) Daddi, E., Dickinson, M., Morrison, G., Chary, R., Cimatti, A., Elbaz, D., Frayer, D., Renzini, A., Pope, A., Alexander, D. M., Bauer, F. E., Giavalisco, M., Huynh, M., Kurk, J., & Mignoli, M. 2007, ApJ, 670, 156
- Dale et al. (2000) Dale, D. A., Silbermann, N. A., Helou, G., Valjavec, E., Malhotra, S., Beichman, C. A., Brauher, J., Contursi, A., Dinerstein, H. L., Hollenbach, D. J., Hunter, D. A., Kolhatkar, S., Lo, K.-Y., Lord, S. D., Lu, N. Y., Rubin, R. H., Stacey, G. J., Thronson, Jr., H. A., Werner, M. W., & Corwin, Jr., H. G. 2000, AJ, 120, 583
- Davoodi et al. (2006) Davoodi, P., Pozzi, F., Oliver, S., Polletta, M., Afonso-Luis, A., Farrah, D., Hatziminaoglou, E., Rodighiero, G., Berta, S., Waddington, I., Lonsdale, C., Rowan-Robinson, M., Shupe, D. L., Evans, T., Fang, F., Smith, H. E., & Surace, J. 2006, MNRAS, 371, 1113
- De Lucia et al. (2006) De Lucia, G., Springel, V., White, S. D. M., Croton, D., & Kauffmann, G. 2006, MNRAS, 366, 499
- Dekel & Birnboim (2006) Dekel, A. & Birnboim, Y. 2006, MNRAS, 368, 2
- Desert et al. (1990) Desert, F.-X., Boulanger, F., & Puget, J. L. 1990, A&A, 237, 215
- Draine et al. (2007) Draine, B. T., Dale, D. A., Bendo, G., Gordon, K. D., Smith, J. D. T., Armus, L., Engelbracht, C. W., Helou, G., Kennicutt, Jr., R. C., Li, A., Roussel, H., Walter, F., Calzetti, D., Moustakas, J., Murphy, E. J., Rieke, G. H., Bot, C., Hollenbach, D. J., Sheth, K., & Teplitz, H. I. 2007, ApJ, 663, 866
- Duc et al. (2002) Duc, P.-A., Poggianti, B. M., Fadda, D., Elbaz, D., Flores, H., Chanial, P., Franceschini, A., Moorwood, A., & Cesarsky, C. 2002, A&A, 382, 60
- Eggen et al. (1962) Eggen, O. J., Lynden-Bell, D., & Sandage, A. R. 1962, ApJ, 136, 748
- Engelbracht et al. (2005) Engelbracht, C. W., Gordon, K. D., Rieke, G. H., Werner, M. W., Dale, D. A., & Latter, W. B. 2005, ApJ, 628, L29
- Fazio et al. (2004) Fazio, G. G., Hora, J. L., Allen, L. E., Ashby, M. L. N., Barmby, P., Deutsch, L. K., Huang, J.-S., Kleiner, S., Marengo, M., Megeath, S. T., Melnick, G. J., Pahre, M. A., Patten, B. M., Polizotti, J., Smith, H. A., Taylor, R. S., Wang, Z., Willner, S. P., Hoffmann, W. F., Pipher, J. L., Forrest, W. J., McMurty, C. W., McCreight, C. R., McKelvey, M. E., McMurray, R. E., Koch, D. G., Moseley, S. H., Arendt, R. G., Mentzell, J. E., Marx, C. T., Losch, P., Mayman, P., Eichhorn, W., Krebs, D., Jhabvala, M., Gezari, D. Y., Fixsen, D. J., Flores, J., Shakoorzadeh, K., Jungo, R., Hakun, C., Workman, L., Karpati, G., Kichak, R., Whitley, R., Mann, S., Tollestrup, E. V., Eisenhardt, P., Stern, D., Gorjian, V., Bhattacharya, B., Carey, S., Nelson, B. O., Glaccum, W. J., Lacy, M., Lowrance, P. J., Laine, S., Reach, W. T., Stauffer, J. A., Surace, J. A., Wilson, G., Wright, E. L., Hoffman, A., Domingo, G., & Cohen, M. 2004, ApJS, 154, 10
- Fioc & Rocca-Volmerange (1997) Fioc, M. & Rocca-Volmerange, B. 1997, A&A, 326, 950
- Fisher (2006) Fisher, D. B. 2006, ApJ, 642, L17
- Förster Schreiber et al. (2001) Förster Schreiber, N. M., Genzel, R., Lutz, D., Kunze, D., & Sternberg, A. 2001, ApJ, 552, 544
- Förster Schreiber et al. (2004) Förster Schreiber, N. M., Roussel, H., Sauvage, M., & Charmandaris, V. 2004, A&A, 419, 501
- Gómez et al. (2003) Gómez, P. L., Nichol, R. C., Miller, C. J., Balogh, M. L., Goto, T., Zabludoff, A. I., Romer, A. K., Bernardi, M., Sheth, R., Hopkins, A. M., Castander, F. J., Connolly, A. J., Schneider, D. P., Brinkmann, J., Lamb, D. Q., SubbaRao, M., & York, D. G. 2003, ApJ, 584, 210
- Genzel & Cesarsky (2000) Genzel, R. & Cesarsky, C. J. 2000, ARA&A, 38, 761
- Genzel et al. (1998) Genzel, R., Lutz, D., Sturm, E., Egami, E., Kunze, D., Moorwood, A. F. M., Rigopoulou, D., Spoon, H. W. W., Sternberg, A., Tacconi-Garman, L. E., Tacconi, L., & Thatte, N. 1998, ApJ, 498, 579
- Gerke et al. (2007) Gerke, B. F., Newman, J. A., Faber, S. M., Cooper, M. C., Croton, D. J., Davis, M., Willmer, C. N. A., Yan, R., Coil, A. L., Guhathakurta, P., Koo, D. C., & Weiner, B. J. 2007, MNRAS, 376, 1425
- Giovanelli et al. (1995) Giovanelli, R., Haynes, M. P., Salzer, J. J., Wegner, G., da Costa, L. N., & Freudling, W. 1995, AJ, 110, 1059
- Gunn & Gott (1972) Gunn, J. E. & Gott, J. R. I. 1972, ApJ, 176, 1
- Haines et al. (2007) Haines, C. P., Gargiulo, A., & Merluzzi, P. 2007, ArXiv e-prints, 707
- Hammer et al. (2005) Hammer, F., Flores, H., Elbaz, D., Zheng, X. Z., Liang, Y. C., & Cesarsky, C. 2005, A&A, 430, 115
- Hopkins (2004) Hopkins, A. M. 2004, ApJ, 615, 209
- Hopkins et al. (2007) Hopkins, P. F., Bundy, K., Hernquist, L., & Ellis, R. S. 2007, ApJ, 659, 976
- Huang et al. (2007) Huang, J.-S., Ashby, M. L. N., Barmby, P., Brodwin, M., Brown, M. J. I., Caldwell, N., Cool, R. J., Eisenhardt, P., Eisenstein, D., Fazio, G. G., Le Floc’h, E., Green, P., Kochanek, C. S., Lu, N., Pahre, M. A., Rigopoulou, D., Rosenberg, J. L., Smith, H. A., Wang, Z., Willmer, C. N. A., & Willner, S. P. 2007, ApJ, 664, 840
- Johnson et al. (2007) Johnson, K. E., Hibbard, J. E., Gallagher, S. C., Charlton, J. C., Hornschemeier, A. E., Jarrett, T. H., & Reines, A. E. 2007, AJ, 134, 1522
- Kauffmann et al. (2003) Kauffmann, G., Heckman, T. M., White, S. D. M., Charlot, S., Tremonti, C., Peng, E. W., Seibert, M., Brinkmann, J., Nichol, R. C., SubbaRao, M., & York, D. 2003, MNRAS, 341, 54
- Laurent et al. (2000) Laurent, O., Mirabel, I. F., Charmandaris, V., Gallais, P., Madden, S. C., Sauvage, M., Vigroux, L., & Cesarsky, C. 2000, A&A, 359, 887
- Le Floc’h et al. (2005) Le Floc’h, E., Papovich, C., Dole, H., Bell, E. F., Lagache, G., Rieke, G. H., Egami, E., Pérez-González, P. G., Alonso-Herrero, A., Rieke, M. J., Blaylock, M., Engelbracht, C. W., Gordon, K. D., Hines, D. C., Misselt, K. A., Morrison, J. E., & Mould, J. 2005, ApJ, 632, 169
- Leger & Puget (1984) Leger, A. & Puget, J. L. 1984, A&A, 137, L5
- Lewis et al. (2002) Lewis, I., Balogh, M., De Propris, R., Couch, W., Bower, R., Offer, A., Bland-Hawthorn, J., Baldry, I. K., Baugh, C., Bridges, T., Cannon, R., Cole, S., Colless, M., Collins, C., Cross, N., Dalton, G., Driver, S. P., Efstathiou, G., Ellis, R. S., Frenk, C. S., Glazebrook, K., Hawkins, E., Jackson, C., Lahav, O., Lumsden, S., Maddox, S., Madgwick, D., Norberg, P., Peacock, J. A., Percival, W., Peterson, B. A., Sutherland, W., & Taylor, K. 2002, MNRAS, 334, 673
- Li et al. (2007) Li, H.-N., Wu, H., Cao, C., & Zhu, Y.-N. 2007, AJ, 134, 1315
- Li & White (2007) Li, Y.-S. & White, S. D. M. 2007, ArXiv e-prints, 710
- Lilly et al. (1996) Lilly, S. J., Le Fevre, O., Hammer, F., & Crampton, D. 1996, ApJL, 460, L1+
- Lotz et al. (2008) Lotz, J. M., Davis, M., Faber, S. M., Guhathakurta, P., Gwyn, S., Huang, J., Koo, D. C., Le Floc’h, E., Lin, L., Newman, J., Noeske, K., Papovich, C., Willmer, C. N. A., Coil, A., Conselice, C. J., Cooper, M., Hopkins, A. M., Metevier, A., Primack, J., Rieke, G., & Weiner, B. J. 2008, ApJ, 672, 177
- Madau et al. (1998) Madau, P., Pozzetti, L., & Dickinson, M. 1998, ApJ, 498, 106
- Masters et al. (2003) Masters, K. L., Giovanelli, R., & Haynes, M. P. 2003, AJ, 126, 158
- Moran et al. (2006) Moran, S. M., Ellis, R. S., Treu, T., Salim, S., Rich, R. M., Smith, G. P., & Kneib, J.-P. 2006, ApJ, 641, L97
- Moran et al. (2007) Moran, S. M., Ellis, R. S., Treu, T., Smith, G. P., Rich, R. M., & Smail, I. 2007, ApJ, 671, 1503
- Pahre et al. (2004a) Pahre, M. A., Ashby, M. L. N., Fazio, G. G., & Willner, S. P. 2004a, ApJS, 154, 235
- Pahre et al. (2004b) —. 2004b, ApJS, 154, 229
- Pannella et al. (2006) Pannella, M., Hopp, U., Saglia, R. P., Bender, R., Drory, N., Salvato, M., Gabasch, A., & Feulner, G. 2006, ApJ, 639, L1
- Panter et al. (2003) Panter, B., Heavens, A. F., & Jimenez, R. 2003, MNRAS, 343, 1145
- Papovich et al. (2006) Papovich, C., Moustakas, L. A., Dickinson, M., Le Floc’h, E., Rieke, G. H., Daddi, E., Alexander, D. M., Bauer, F., Brandt, W. N., Dahlen, T., Egami, E., Eisenhardt, P., Elbaz, D., Ferguson, H. C., Giavalisco, M., Lucas, R. A., Mobasher, B., Pérez-González, P. G., Stutz, A., Rieke, M. J., & Yan, H. 2006, ApJ, 640, 92
- Peeters et al. (2004) Peeters, E., Spoon, H. W. W., & Tielens, A. G. G. M. 2004, ApJ, 613, 986
- Pérez-González et al. (2006) Pérez-González, P. G., Kennicutt, Jr., R. C., Gordon, K. D., Misselt, K. A., Gil de Paz, A., Engelbracht, C. W., Rieke, G. H., Bendo, G. J., Bianchi, L., Boissier, S., Calzetti, D., Dale, D. A., Draine, B. T., Jarrett, T. H., Hollenbach, D., & Prescott, M. K. M. 2006, ApJ, 648, 987
- Phillips et al. (1984) Phillips, M. M., Aitken, D. K., & Roche, P. F. 1984, MNRAS, 207, 25
- Pierini et al. (2004) Pierini, D., Maraston, C., Bender, R., & Witt, A. N. 2004, MNRAS, 347, 1
- Piovan et al. (2003) Piovan, L., Tantalo, R., & Chiosi, C. 2003, A&A, 408, 559
- Poggianti et al. (2004) Poggianti, B. M., Bridges, T. J., Komiyama, Y., Yagi, M., Carter, D., Mobasher, B., Okamura, S., & Kashikawa, N. 2004, ApJ, 601, 197
- Poggianti et al. (1999) Poggianti, B. M., Smail, I., Dressler, A., Couch, W. J., Barger, A. J., Butcher, H., Ellis, R. S., & Oemler, A. J. 1999, ApJ, 518, 576
- Popescu et al. (2000) Popescu, C. C., Misiriotis, A., Kylafis, N. D., Tuffs, R. J., & Fischera, J. 2000, A&A, 362, 138
- Postman & Geller (1984) Postman, M. & Geller, M. J. 1984, ApJ, 281, 95
- Quilis et al. (2000) Quilis, V., Moore, B., & Bower, R. 2000, Science, 288, 1617
- Rieke et al. (2004) Rieke, G. H., Young, E. T., Engelbracht, C. W., Kelly, D. M., Low, F. J., Haller, E. E., Beeman, J. W., Gordon, K. D., Stansberry, J. A., Misselt, K. A., Cadien, J., Morrison, J. E., Rivlis, G., Latter, W. B., Noriega-Crespo, A., Padgett, D. L., Stapelfeldt, K. R., Hines, D. C., Egami, E., Muzerolle, J., Alonso-Herrero, A., Blaylock, M., Dole, H., Hinz, J. L., Le Floc’h, E., Papovich, C., Pérez-González, P. G., Smith, P. S., Su, K. Y. L., Bennett, L., Frayer, D. T., Henderson, D., Lu, N., Masci, F., Pesenson, M., Rebull, L., Rho, J., Keene, J., Stolovy, S., Wachter, S., Wheaton, W., Werner, M. W., & Richards, P. L. 2004, ApJS, 154, 25
- Rix & Rieke (1993) Rix, H.-W. & Rieke, M. J. 1993, ApJ, 418, 123
- Roche et al. (1991) Roche, P. F., Aitken, D. K., Smith, C. H., & Ward, M. J. 1991, MNRAS, 248, 606
- Roche et al. (1984) Roche, P. F., Whitmore, B., Aitken, D. K., & Phillips, M. M. 1984, MNRAS, 207, 35
- Roussel et al. (2001) Roussel, H., Sauvage, M., Vigroux, L., & Bosma, A. 2001, A&A, 372, 427
- Rowan-Robinson et al. (2005) Rowan-Robinson, M., Babbedge, T., Surace, J., Shupe, D., Fang, F., Lonsdale, C., Smith, G., Polletta, M., Siana, B., Gonzalez-Solares, E., Xu, K., Owen, F., Davoodi, P., Dole, H., Domingue, D., Efstathiou, A., Farrah, D., Fox, M., Franceschini, A., Frayer, D., Hatziminaoglou, E., Masci, F., Morrison, G., Nandra, K., Oliver, S., Onyett, N., Padgett, D., Perez-Fournon, I., Serjeant, S., Stacey, G., & Vaccari, M. 2005, AJ, 129, 1183
- Salim et al. (2005) Salim, S., Charlot, S., Rich, R. M., Kauffmann, G., Heckman, T. M., Barlow, T. A., Bianchi, L., Byun, Y.-I., Donas, J., Forster, K., Friedman, P. G., Jelinsky, P. N., Lee, Y.-W., Madore, B. F., Malina, R. F., Martin, D. C., Milliard, B., Morrissey, P., Neff, S. G., Schiminovich, D., Seibert, M., Siegmund, O. H. W., Small, T., Szalay, A. S., Welsh, B. Y., & Wyder, T. K. 2005, ApJ, 619, L39
- Salpeter (1955) Salpeter, E. E. 1955, ApJ, 121, 161
- Shi et al. (2007) Shi, Y., Ogle, P., Rieke, G. H., Antonucci, R., Hines, D. C., Smith, P. S., Low, F. J., Bouwman, J., & Willmer, C. 2007, ApJ, 669, 841
- Springel et al. (2005) Springel, V., White, S. D. M., Jenkins, A., Frenk, C. S., Yoshida, N., Gao, L., Navarro, J., Thacker, R., Croton, D., Helly, J., Peacock, J. A., Cole, S., Thomas, P., Couchman, H., Evrard, A., Colberg, J., & Pearce, F. 2005, Nature, 435, 629
- Temi et al. (2008) Temi, P., Brighenti, F., & Mathews, W. G. 2008, ApJ, 672, 244
- Thomas et al. (2005) Thomas, D., Maraston, C., Bender, R., & Mendes de Oliveira, C. 2005, ApJ, 621, 673
- Tuffs et al. (2004) Tuffs, R. J., Popescu, C. C., Völk, H. J., Kylafis, N. D., & Dopita, M. A. 2004, A&A, 419, 821
- Wang & Heckman (1996) Wang, B. & Heckman, T. M. 1996, ApJ, 457, 645
- Weiner et al. (2007) Weiner, B. J., Papovich, C., Bundy, K., Conselice, C. J., Cooper, M. C., Ellis, R. S., Ivison, R. J., Noeske, K. G., Phillips, A. C., & Yan, R. 2007, ApJ, 660, L39
- Weinmann et al. (2006) Weinmann, S. M., van den Bosch, F. C., Yang, X., & Mo, H. J. 2006, MNRAS, 366, 2
- Wilman et al. (2005) Wilman, D. J., Balogh, M. L., Bower, R. G., Mulchaey, J. S., Oemler, A., Carlberg, R. G., Morris, S. L., & Whitaker, R. J. 2005, MNRAS, 358, 71
- Wolf et al. (2005) Wolf, C., Gray, M. E., & Meisenheimer, K. 2005, A&A, 443, 435
- Yamada et al. (2005) Yamada, T., Kodama, T., Akiyama, M., Furusawa, H., Iwata, I., Kajisawa, M., Iye, M., Ouchi, M., Sekiguchi, K., Shimasaku, K., Simpson, C., Tanaka, I., & Yoshida, M. 2005, ApJ, 634, 861
- Yan et al. (2006) Yan, R., Newman, J. A., Faber, S. M., Konidaris, N., Koo, D., & Davis, M. 2006, ApJ, 648, 281
- Yee et al. (2000) Yee, H. K. C., Morris, S. L., Lin, H., Carlberg, R. G., Hall, P. B., Sawicki, M., Patton, D. R., Wirth, G. D., Ellingson, E., & Shepherd, C. W. 2000, ApJS, 129, 475
- Zabludoff & Mulchaey (1998) Zabludoff, A. I. & Mulchaey, J. S. 1998, ApJ, 496, 39
- Zheng et al. (2007) Zheng, X. Z., Dole, H., Bell, E. F., Le Floc’h, E., Rieke, G. H., Rix, H.-W., & Schiminovich, D. 2007, ApJ, 670, 301