FIGGS: Faint Irregular Galaxies GMRT Survey Overview, observations and first results
Abstract
The Faint Irregular Galaxies GMRT Survey (FIGGS) is a Giant Metrewave Radio Telescope (GMRT) based HI imaging survey of a systematically selected sample of extremely faint nearby dwarf irregular galaxies. The primary goal of FIGGS is to provide a comprehensive and statistically robust characterization of the neutral inter-stellar medium properties of faint, gas rich dwarf galaxies. The FIGGS galaxies represent the extremely low-mass end of the dwarf irregular galaxies population, with a median M and median HI mass of M⊙, extending the baseline in mass and luminosity space for a comparative study of galaxy properties. The HI data is supplemented with observations at other wavelengths. In addition, distances accurate to 10% are available for most of the sample galaxies. This paper gives an introduction to FIGGS, describe the GMRT observations and presents the first results from the HI observations. From the FIGGS data we confirm the trend of increasing HI to optical diameter ratio with decreasing optical luminosity; the median ratio of DHI/DHo for the FIGGS sample is 2.4. Further, on comparing our data with aperture synthesis surveys of bright spirals, we find at best marginal evidence for a decrease in average surface density with decreasing HI mass. To a good approximation the disks of gas rich galaxies, ranging over 3 orders of magnitude in HI mass, can be described as being drawn from a family with constant HI surface density.
keywords:
galaxies: dwarf – galaxies: kinematics and dynamics – radio lines: galaxies1 Introduction
HI 21cm aperture synthesis observations of nearby spiral galaxies is a mature field with over three decades of history – probably something of the order of a thousand galaxies have already been imaged. However observers have tended to focus on bright ( L∗) galaxies with HI masses M⊙. HI observations of faint dwarf galaxies (M) generally require comparatively long integration times, and such galaxies have hence not been studied in similar numbers. While there have been some systematic HI surveys of dwarf galaxies (Swaters, 1999; Stil & Israel, 2002), these have generally been restricted to the brighter (M) dwarfs.
In hierarchical models of galaxy formation, nearby dwarf galaxies would, in some ways, be analogs of the primordial building blocks of large galaxies. A systematic HI survey of the faintest dwarf galaxies could provide data that would be useful for a diverse range of studies, ranging from, for example, testing the predictions of cold dark matter models (e.g Simon & Geha (2007); Blanton et al. (2007)), checking if such systems could be the host population of quasar absorption line systems (e.g. Zwaan et al. (2005); Kanekar & Chengalur (2005)) etc. As the most chemically unevolved systems in the present-day galaxy population, the faintest dwarfs provide unique laboratories for understanding star formation and galaxy evolution in extreme environments, i.e. low metallicity, low dust content, low pressure, low shear, and low escape velocity (e.g. Ekta et al. (2006)).
In this paper we describe and present the first results from a Giant Meterwave Radio Telescope (GMRT) based HI imaging study of faint dwarf galaxies the Faint Irregular Galaxies GMRT Survey (FIGGS). The primary goal of FIGGS is to obtain high quality observations of the atomic ISM for a large, systematically selected sample of faint, gas rich, dwarf irregular (dIrr) galaxies. Our GMRT HI images are supplemented by single dish HI observations, HST V and I band images and ground based H images from the 6-m BTA telescope. Additionally, the HII region abundances and H rotation curves are being obtained on the William Herschel Telescope (WHT), Isaac Newton Telescope (INT) telescopes on La Palma and 6-m Russian BTA telescope, respectively.
This paper is organised as follows. In Section 2 we describe the design and the properties of the galaxy sample. The main science drivers for FIGGS are described in Section.3. The GMRT observations are described in Section 4 and the results of the survey are presented and discussed in Section 5.
| Galaxy | (J2000) | (J2000) | MB | DHo | B-V | Dist | D estm | Group | iopt | Ref |
|---|---|---|---|---|---|---|---|---|---|---|
| (h m s) | (∘ ′ ′′) | (mag) | (′) | (mag) | (Mpc) | (deg) | ||||
| SC 24 | 00 36 38.00 | 32 34 28 | 8.39 | 0.6 | 1.66 | Sculptor grp(?) | distant Irr | 57 | ||
| And IV | 00 42 32.30 | +40 34 19 | 12.23 | 1.1 | 0.47 | 6.3 | rgb | Field | 41 | 18,19 |
| DDO 226 | 00 43 03.80 | 22 15 01 | 14.17 | 3.2 | 0.4 | 4.9 | rgb | Sculptor | 72 | 1 |
| DDO 6 | 00 49 49.30 | 21 00 58 | 12.5 | 2.1 | 0.32 | 3.34 | rgb | Sculptor | 69 | 1 |
| UGC 685 | 01 07 22.30 | +16 41 02 | 14.31 | 2.2 | 0.52 | 4.5 | rgb | Field | 46 | 1 |
| KKH 6 | 01 34 51.60 | +52 5 30 | 12.42 | 0.9 | 0.43 | 3.73 | rgb | IC 342/Maffei | 55 | 13,17 |
| KK 14 | 01 44 42.70 | +27 17 16 | 12.13 | 1.6 | 0.42 | 7.2 | N672 grp | N672 | 71 | 13 |
| KKH 11 | 02 24 35.00 | +56 0 42 | 13.35 | 1.7 | 3.0 | Mafeii grp | IC 342/Maffei | 59 | ||
| KKH 12 | 02 27 27.00 | +57 29 16 | 13.03 | 2.2 | 3.0 | Maffei grp | IC 342/Maffei | 78 | ||
| KK 41 | 04 25 15.60 | +72 48 21 | 14.06 | 2.6 | 0.63 | 3.9 | rgb | IC 342 | 57 | 2 |
| UGCA 92 | 04 32 00.30 | +63 36 50 | 15.65 | 2.0 | 1.1 | 3.01 | rgb | IC 342/Maffei | 62 | 3, 17 |
| KK 44 | 04 53 06.90 | +67 05 57 | 11.85 | 1.4 | 0.58 | 3.34 | rgb | IC432 | 62 | 4 |
| KKH 34 | 05 59 41.20 | +73 25 39 | 12.30 | 1.0 | 0.4 | 4.6 | rgb | M81 | 58 | 13 |
| E490-17 | 06 37 56.60 | 25 59 59 | 14.46 | 2.0 | 0.51 | 4.2 | rgb | Field | 42 | 5 |
| HIZSS003 | 07 00 29.30 | 04 12 30 | 12.6 | 2.0 | 1.69 | rgb | Field | 55 | ||
| UGC 3755 | 07 13 51.80 | +10 31 19 | 14.90 | 1.8 | 0.55 | 6.96 | rgb | Field | 55 | 6,15 |
| DDO 43 | 07 28 17.20 | +40 46 13 | 14.75 | 1.8 | 0.31 | 7.8 | rgb | Field | 48 | 7 |
| KK 65 | 07 42 31.20 | +16 33 40 | 14.29 | 0.9 | 0.54 | 7.62 | rgb | Field | 58 | 8 |
| UGC 4115 | 07 57 01.80 | +14 23 27 | 14.27 | 1.5 | 0.47 | 7.5 | rgb | Field | 58 | 13 |
| KDG 52 | 08 32 56.00 | +71 01 46 | 11.49 | 1.3 | 0.24 | 3.55 | rgb | M81 | 24 | 4 |
| UGC 4459 | 08 34 06.50 | +66 10 45 | 13.37 | 1.6 | 0.45 | 3.56 | rgb | M81 | 30 | 4 |
| KK 69 | 08 52 50.70 | +33 47 52 | 12.76 | 2.0 | 7.7 | N2683 grp | N2638 | 42 | ||
| UGC 5186 | 09 42 59.80 | +33 15 52 | 12.98 | 1.3 | 0.49 | 6.9 | h | Field | 83 | 13 |
| UGC 5209 | 09 45 04.20 | +32 14 18 | 13.15 | 0.9 | 0.56 | 6.7 | h | Field | 17 | 8 |
| UGC 5456 | 10 07 19.70 | +10 21 44 | 15.08 | 1.9 | 0.33 | 5.6 | rgb | Field | 62 | 9 |
| HS 117 | 10 21 25.20 | +71 06 58 | 11.83 | 1.5 | 3.96 | rgb | Field | 55 | ||
| UGC 6145 | 11 05 35.00 | 01 51 49 | 13.14 | 1.7∗ | 7.4 | h | Field | 64 | ||
| UGC 6456 | 11 28 00.60 | +78 59 29 | 14.03 | 1.5∗ | 0.38 | 4.3 | rgb | M81 | 60 | 11 |
| UGC 6541 | 11 33 29.10 | +49 14 17 | 13.71 | 1.6 | 0.41 | 3.9 | rgb | CVn I | 57 | 10 |
| NGC 3741 | 11 36 06.40 | +45 17 7 | 13.13 | 1.7 | 0.37 | 3.0 | rgb | CVn I | 58 | 7 |
| KK 109 | 11 47 11.20 | +43 40 19 | 9.73 | 0.6 | 0.36 | 4.5 | rgb | CVn I | 49 | 13 |
| DDO 99 | 11 50 53.00 | +38 52 50 | 13.52 | 3.5 | 0.38 | 2.6 | rgb | CVn I | 71 | 13 |
| E379-07 | 11 54 43.00 | 33 33 29 | 12.31 | 1.1 | 0.23 | 5.2 | rgb | Cen A | 44 | 13 |
| KK 127 | 12 13 22.70 | +29 55 18 | 15.30 | 1.0 | 0.4 | 13.0 | ComaI grp | ComaI | 69 | 17 |
| E321-014 | 12 13 49.60 | 38 13 53 | 12.70 | 1.4 | 0.41 | 3.2 | rgb | Cen A | 67 | 13 |
| UGC 7242 | 12 14 07.40 | +66 05 32 | 14.06 | 1.9 | 0.4 | 5.4 | rgb | M81 | 68 | 13,17 |
| CGCG 269-049 | 12 15 46.70 | +52 23 15 | 13.25 | 1.8 | 0.4 | 4.9 | rgb | CVn I | 77 | 16 |
| UGC 7298 | 12 16 28.60 | +52 13 38 | 12.27 | 1.1 | 0.29 | 4.21 | rgb | CVn I | 58 | 4 |
| UGC 7505 | 12 25 17.90 | +26 42 53 | 15.55 | 1.0 | 0.45 | 12.8 | tf | ComaI | 84 | 6 |
| KK 144 | 12 25 27.90 | +28 28 57 | 12.59 | 1.5 | 0.4 | 6.3 | h | CVn I | 74 | 13 |
| DDO 125 | 12 27 41.80 | +43 29 38 | 14.16 | 4.2 | 0.59 | 2.5 | rgb | CVn I | 58 | 6 |
| UGC 7605 | 12 28 39.00 | +35 43 05 | 13.53 | 2.2 | 0.41 | 4.43 | rgb | CVn I | 44 | 13 |
| UGC 8055 | 12 56 04.00 | +03 48 41 | 15.49 | 1.4 | 0.24 | 17.4 | tf | Field | 40 | 9 |
| GR 8 | 12 58 40.40 | +14 13 03 | 12.11 | 2.2 | 0.32 | 2.1 | rgb | Field | 25 | 4 |
| UGC 8215 | 13 08 03.60 | +46 49 41 | 12.26 | 1.0 | 0.38 | 4.5 | rgb | CVn I | 47 | 12, 17 |
| DDO 167 | 13 13 22.80 | +46 19 11 | 12.70 | 1.6 | 0.32 | 4.2 | rgb | CVn I | 58 | 12 |
| KK 195 | 13 21 08.20 | 31 31 45 | 11.76 | 1.3 | 5.22 | rgb | M83 | 65 | ||
| KK 200 | 13 24 36.00 | 30 58 20 | 11.96 | 1.3 | 0.4 | 4.6 | rgb | M83 | 53 | 13 |
| UGC 8508 | 13 30 44.40 | +54 54 36 | 12.98 | 2.0 | 0.45 | 2.6 | rgb | CVn I | 55 | 6 |
| E444-78 | 13 36 30.80 | 29 14 11 | 13.3 | 1.2∗ | 0.49 | 5.25 | rgb | M83 | 68 | 13 |
| UGC 8638 | 13 39 19.40 | +24 46 33 | 13.68 | 1.2 | 0.51 | 4.27 | rgb | CVn I | 49 | 13, 17 |
| DDO 181 | 13 39 53.80 | +40 44 21 | 13.03 | 1.6 | 0.46 | 3.1 | rgb | CVn I | 57 | 13 |
| I4316 | 13 40 18.10 | 28 53 40 | 13.90 | 1.6 | 4.4 | rgb | M83 | 52 | ||
| DDO 183 | 13 50 51.10 | +38 01 16 | 13.17 | 1.7 | 0.31 | 3.24 | rgb | CVn I | 75 | 9 |
| UGC 8833 | 13 54 48.70 | +35 50 15 | 12.42 | 1.3 | 0.42 | 3.2 | rgb | CVn I | 28 | 13 |
| KK 230 | 14 07 10.70 | +35 03 37 | 9.55 | 1.7 | 0.4 | 1.9 | rgb | Field | 35 | 4 |
| DDO 187 | 14 15 56.50 | +23 03 19 | 12.51 | 2.28 | 0.28 | 2.5 | rgb | Field | 42 | 1 |
| P51659 | 14 28 03.70 | 46 18 06 | 11.83 | 2.4∗ | 3.6 | rgb | Cen A | 71 | ||
| KKR 25 | 16 13 47.60 | +54 22 16 | 9.96 | 1.2 | 1.86 | rgb | Field | 55 | ||
| KK 246 | 20 03 57.40 | 31 40 54 | 13.69 | 1.3 | 0.58 | 7.83 | rgb | Field | 68 | 13, 17 |
*: Optical diameter measured at 25.0 mag arcsec-2.
| Galaxy | (J2000) | (J2000) | MB | DHo | B-V | Dist | D estm | Group | iopt | Ref |
|---|---|---|---|---|---|---|---|---|---|---|
| (h m s) | (∘ ′ ′′) | (mag) | (′) | (mag) | (Mpc) | (deg) | ||||
| KK 250, UGC11583 | 20 30 15.30 | +60 26 25 | 14.54 | 1.8 | 0.91 | 5.6 | N6946 grp | N6946 | 62 | 14 |
| KK 251 | 20 30 32.60 | +60 21 13 | 13.72 | 1.6 | 0.37 | 5.6 | N6946 grp | N6946 | 66 | 14 |
| DDO 210 | 20 46 53.00 | 12 50 57 | 11.09 | 3.6 | 0.24 | 1.0 | rgb | Field | 62 | 4 |
| UGCA 438 | 23 26 27.50 | 32 23 26 | 12.94 | 2.4 | 0.42 | 2.2 | rgb | Sculptor | 38 | 13 |
| KKH 98 | 23 45 34.00 | +38 43 4 | 10.78 | 1.1 | 0.21 | 2.5 | rgb | Field | 58 | 13 |
References: 1-van Zee (2000) 2-Karachentsev et al. (1999) 3-Karachentsev et al. (1996) 4-Begum et al. (2006) 5-Parodi (2002) 6-Makarova (1999) 7-Taylor et al. (2005) 8-Makarova et al. (2002) 9-Hunter & Elmegreen (2006) 10-Bremnes et al. (2000) 11-Hopp & Schulte-Ladbeck (1995) 12-Bremnes et al. (1999) 13-Sharina et al. 2008 (in preparation) 14-Begum & Chengalur (2004b) 15-Tully et al. (2006) 16-Corbin et al. (2008) 17-Karachentsev et al. (2006) 18-Ferguson et al. (2000) 19-Chengalur et al. 2008 (in preparation)
2 FIGGS: Sample definition and properties
The Faint Irregular Galaxies GMRT Survey FIGGS, is a large observing program aimed at providing a comprehensive and statistically robust characterisation of the neutral ISM properties of faint, gas rich, dwarf irregular galaxies using the Giant Metrewave Radio Telescope (GMRT). The FIGGS sample forms a subsample of the Karachentsev et al.(2004) catalog of galaxies within 10 Mpc. Specifically, the FIGGS sample consists of 65 faint dwarf irregular (dIrr)galaxies with:
-
1.
absolute blue magnitude, M,
-
2.
HI flux integral 1 Jy kms-1
-
3.
optical B band major axis 1.0 arcmin.
The sample choice was dictated by a balance between achieving the scientific goals described in Section.3 and the practical limitations of the observing time. We note that the above mentioned criterion on the optical B band major axis was not strictly followed in few cases. Some unusual, very faint dwarf galaxies, with optical B band major axis 1 arcmin were still included in our sample, as they are interesting cases to study in detail in HI. Further, for some of the galaxies in the FIGGS sample, fresh estimates of the distance (obtained after our observations were complete) imply absolute magnitudes slightly larger than the cut off above. These galaxies have however been retained in the sample. Some properties (mainly derived from optical observations) of galaxies in the FIGGS sample are listed in Table 1. The columns are as follows: Column(1) the galaxy name, Column(2)&(3) the equatorial coordinates (J2000), Column(4) the absolute blue magnitude (corrected for galactic extinction), Column(5) the Holmberg diameter in arcmin, Column(6) the (B-V) colour, Column(7) the distance in Mpc, Column(8) the method used to measure the distance from the tip of the red giant branch (rgb), from membership in a group with known distance (grp), from the Tully-Fisher relation (tf), and from the Hubble flow (h). Column(9) gives the group membership of the galaxy, Column(10) the inclination determined from optical photometry (and assuming an intrinsic thickness, qo=0.2) and Column(11) the reference for the (B-V) colour, and/or revised distance. The data presented in the Table 1 (except for the colour) is taken from Karachentsev et al. (2004) catalog, except that revised distances have been adopted, if available. As can be seen from the Table 1, tip of the red giant branch (rgb) distances (which are generally accurate to 10%) are available for most of the galaxies in our sample.
Figure 1 shows the histogram of the absolute blue magnitude (MB), distance, HI mass, and HI mass to light ratio (M) for the FIGGS sample, while Figure 2 compares the distributions of gas fraction, luminosity and dynamical mass of the FIGGS galaxies with that of existing samples of galaxies with HI aperture synthesis observations. The gas fraction and the dynamical masses for the FIGGS sample have been derived from the GMRT observations. The FIGGS sample has a median and a median HI mass M⊙, while spanning range of more than 100 in stellar light, gas mass and dynamical mass, and more than 4 in gas fraction. It can also be clearly seen that by focusing on fainter, lower mass galaxies than those observed in previous HI imaging studies, FIGGS bridges the transition to rotation dominated low mass spirals and provides a substantially extended baseline in mass and luminosity space for a comparative study of galaxy properties.


3 Science drivers for FIGGS
The aim of FIGGS is to provide a large multi-wavelength database for a systematically selected sample of extremely faint dwarf irregular galaxies. As mentioned in Section 1, such a database could be used to address a diverse range of astrophysical questions. Rather than attempting to enumerate all of these, in this section, we describe in some detail a couple of key science drivers for the FIGGS survey.
3.1 Star formation and feedback in small galaxies
One of the main goals of FIGGS is to use the HI interferometric images in conjunction with the optical data to study the interplay between the neutral ISM and star formation in the faintest, lowest mass, gas rich dIrr galaxies. The gravitational binding energy for very faint dwarf irregular galaxies is not much larger than the energy output from a few supernovae; consequently star formation in such galaxies could have a profound effect on the morphology and kinematics of the ISM of these systems. The FIGGS data will enable us to study the ISM of most of our sample galaxies at a linear resolution of pc i.e. comparable to the scales at which energy is injected into the ISM through supernova and stellar winds. FIGGS thus provide a unique opportunity to study the effects of feedback from star formation in low mass, gas rich galaxies, which in turn will allow us to understand the processes driving the evolution of these galaxies. For example, it has been suggested that star formation in dwarf galaxies occurs only above a constant threshold HI column density of N cm-2 (e.g. Skillman, 1987; Taylor, 1994). Such a threshold could be a consequence of disk dynamics (e.g. related to Toomre’s instability criterion; Kennicutt (1989)) or a consequence of some other physical process, e.g. self shielding or thermo-gravitational instability (Schaye (2004)). A preliminary study of a small subsample of FIGGS (Begum et al. (2006)) suggested that unlike brighter dwarfs, the faintest dwarf galaxies do not show well defined threshold density. A detailed comparison of H and UV images with HI column density maps for the FIGGS sample will allow us to definitively answer the issue of the existence of a threshold density in the faintest galaxies and also to check whether the recipes for star formation derived from larger galaxies (Kennicutt (1989)) continue to be valid at this mass regime. These are critical issues in hierarchical galaxy formation models.
3.2 Dark and visible matter in small galaxies
The second major aim of this survey is to study the relation between dark and baryonic matter in the smallest known star forming galaxies. According to several models of galaxy formation and evolution, the first burst of star formation in dwarf galaxies below a critical halo circular velocity (100 kms-1) could lead to the loss of a significant fraction of baryons (e.g. Efstathiou, 2000; Dekel & Woo, 2003). In fact, expulsion of gas because of energy input from supernovae has been postulated as a possible mechanism to produce dwarf elliptical galaxies from gas rich progenitors (e.g. Miralda-Escude & Rees (1997)). Although a complete expulsion of the ISM from galaxies has not been observed so far, expansive outward motions of the neutral gas in dwarf galaxies has been observed in at least two galaxies (viz. GR8, Begum & Chengalur 2003; NGC 625, Cannon et al. 2004). To test these models, high spatial resolution interferometric observations are crucial.
The Tully-Fisher (TF) relation demonstrates the existence of a tight relation between dark and luminous matter in bright spiral galaxies. Mcgaugh et al. (2000) (see also McGaugh (2005)) showed that dwarf galaxies deviate from the TF relation defined by bright spirals, but that the relationship is restored if one works with the total baryonic mass instead of the luminosity, i.e. a “Baryonic Tully Fisher” (BTF) relation. The FIGGS sample, both because it extends well beyond the region of rotation dominated dwarfs and because accurate distances are known for a large subsample, forms a very interesting dataset for studying TF and BTF relations. Most of the past studies have been done using the HI global velocity widths from the single dish observations (Geha et al., 2006; Mcgaugh et al., 2000). While for the brighter galaxies W20 (the velocity width at 20% emission, after correction for random motions and instrumental broadening), is a good measure of the rotational velocity of the galaxy (Verheijen & Sancisi 2001); it is unclear if this would remain true in the case of faint dwarf galaxies, where random motions could be comparable to the peak rotational velocities (e.g. Begum et al., 2003; Begum & Chengalur, 2004a). For such galaxies, it is important to accurately correct for the pressure support (“asymmetric drift” correction) for which one needs to know both the rotation curve as well as the distribution of the HI gas, both of which can only be obtained by interferometric observations such as in FIGGS. The FIGGS sample would thus allow us to concretely answer this question using actual observational data.
The HI kinematics of FIGGS galaxies, in conjunction with the H rotation curves can be used to accurately determine the density distribution of the dark matter halos of faint galaxies. Since stars generally make a minor contribution to the total mass in the FIGGS galaxies, accurate kinematical studies can provide direct information on the density profiles of their dark matter halos with less uncertainties arising from the unknown stellar mass to light ratio. Cosmological simulations of hierarchical galaxy formation predict a “universal” cusped density core for the dark matter halos of galaxies (e.g. Navarro et al. 2004). On the other hand, observations of dIrr galaxies indicate a constant density core for their dark matter halos (e.g. Weldrake et al., 2003; de Blok et al., 2003); however this comparison remains controversial (e.g. van den Bosch & Swaters, 2001; de Blok, 2005). FIGGS would not only provide a large sample for such a comparison, but would also provide a data set that is less subject to uncertainties due to the unknown stellar mass to light ratio or large scale non circular motions due to bars or spiral arms.
4 HI Observations and data analysis
| Galaxy | Date of Observations | Velocity Coverage | Time on Source | synthesised Beam | Noise | Phase Cal | Cont Noise |
|---|---|---|---|---|---|---|---|
| (km s-1) | (hours) | (arcsec2) | (mJy) | (mJy) | |||
| DDO 226 | 8 July 2004 | 257 469 | 3.5 | 52, 26, 19 | 3.2, 2.4, 2.1 | 0025-260 | 1.5, 0.9 |
| DDO 6 | 1 Feb 2004 | 189 401 | 5.0 | 50, 26, 16 | 3.4, 1.7, 1.4 | 0116-208 | 1.3, 0.8 |
| UGC 685 | 18 June 2004 | 51 263 | 3.5 | 42, 36, 27 | 4.0, 3.5, 3.1 | 0204+152 | 1.9, 1.0 |
| KKH 6 | 9 July 2004 | 45 166 | 4.0 | 41, 30, 16 | 3.0, 2.6, 2.2 | 0136+473 | 1.3, 0.8 |
| KK 14 | 19 June 2004 | 317 529 | 5.0 | 41, 28, 16 | 3.0, 2.5, 2.1 | 3C48 | 1.6, 0.8 |
| KKH 11 | 25 Nov 2004 | 205 415 | 3.0 | 46, 21, 13 | 3.0, 2.1, 1.8 | 0110+565 | 1.9, 0.9 |
| KKH 12 | 16 July 2004 | 36 176 | 3.7 | 47, 32, 16 | 1.6, 1.3, 1.0 | 0110+565 | 1.6, 0.8 |
| UGCA 92 | 6 June 2005 | 205 7 | 2.1 | 42, 26, 16 | 5.5, 4.2, 3.5 | 0410+769 | 2.9, 1.8 |
| KK 41 | 8 July 2004 | 152 60 | 3.0 | 53, 31, 20 | 1.9, 1.3, 1.1 | 0410+769 | 1.3, 0.8 |
| KKH 34 | 9 June 2004 | 5 216 | 4.5 | 53, 34, 22 | 4.0, 2.8, 2.4 | 0410+769 | 1.7, 0.9 |
| E490-17 | 17 June 2004 | 404 616 | 3.5 | 49, 35, 24 | 6.0, 5.8, 4.0 | 0608-223 | 2.4, 1.2 |
| UGC 3755 | 11 Jan 2004 | 209 421 | 5.0 | 42, 28, 18 | 3.8, 3.0, 2.6 | 0745+101 | 1.9, 1.0 |
| DDO 43 | 16 Jan 2005 | 248 460 | 3.5 | 46, 32, 15 | 3.2, 2.6, 2.2 | 0713+438 | 1.6, 1.0 |
| KK 65 | 25 Nov 2004 | 173 385 | 5.0 | 41, 27, 19 | 3.0, 2.3, 1.9 | 0738+177 | 1.7, 0.9 |
| UGC 4115 | 10 July 2004 | 235 447 | 4.0 | 42, 34, 18 | 3.4, 3.2, 2.7 | 0745+101 | 1.8, 1.1 |
| KK 69 | 3 Jan 2005 | 357 569 | 4.0 | 56, 42, 28 | 4.0, 3.0, 2.5 | 0741+312 | 1.9, 1.3 |
| UGC 5186 | 26 Nov 2004 | 445 657 | 5.0 | 41, 27, 15 | 3.0, 2.2, 1.6 | 0958+324 | 1.5, 0.8 |
| UGC 5209 | 15 Jan 2005 | 432 644 | 4.5 | 41, 27, 18 | 3.2, 2.6, 2.1 | 0958+324 | 1.6, 0.9 |
| UGC 5456 | 9 July 2004 | 438 650 | 3.0 | 41, 34, 22 | 4.0, 3.2, 2.6 | 1008+075 | 1.9, 1.2 |
| HS 117 | 8 Aug 2005 | 143 69 | 3.0 | 46 | 3.8 | 1035+564 | 1.8, 1.1 |
| UGC 6145 | 11 Feb 2005 | 634 846 | 5.0 | 42, 34, 20 | 2.4, 2.0, 1.8 | 1150-003 | 1.4, 1.0 |
| UGC 6456 | 19 June 2004 | 208 3 | 3.5 | 53, 23, 16 | 5.0, 3.4, 3.0 | 1435+760 | 2.0, 1.2 |
| UGC 6541 | 29 Nov 2004 | 144 356 | 5.0 | 42, 28, 21 | 3.8, 3.0, 2.4 | 1035+564 | 2.2, 1.0 |
| KK 109 | 6 June 2005 | 106 318 | 4.0 | 49, 27, 18 | 4.8, 3.5, 2.7 | 1227+365 | 2.3, 1.2 |
| DDO 99 | 30 June 2005 | 136 348 | 3.5 | 45, 28, 19 | 3.8, 3.0, 2.7 | 1227+365 | 2.0, 1.1 |
| E379-07 | 19 Jan 2005 | 534 746 | 4.5 | 54, 33, 19 | 3.0, 2.0, 1.7 | 1154-350 | 1.8, 1.1 |
| KK 127 | 9 July 2004 | 46.0 258 | 3.5 | 49 | 3.0 | 1227+365 | 1.7, 1.1 |
| E321-014 | 7 Oct 2005 | 507 719 | 3.5 | 51, 28, 15 | 3.9, 2.7, 2.3 | 1154-350 | 1.8, 0.9 |
| UGC 7242 | 3 Feb 2004 | 37 174 | 6.5 | 45, 27, 18 | 2.2, 1.9, 1.6 | 1313+675 | 1.4, 0.8 |
| UGC 7505 | 28 Nov 2004 | 210 422 | 3.0 | 45, 28, 24 | 4.0, 3.2, 2.8 | 1227+365 | 1.6, 1.1 |
| KK 144 | 12 July 2004 | 377 589 | 4.5 | 41, 28, 19 | 4.0, 3.2, 2.7 | 1221+282 | 1.8, 1.0 |
| DDO 125 | 6 June 2005 | 89 301 | 4.0 | 45, 31, 20 | 4.2, 3.8, 3.0 | 1227+365 | 1.8, 1.2 |
| UGC 7605 | 1 Feb 2004 | 204 416 | 7.0 | 43, 29, 16 | 2.3, 2.0, 1.7 | 1227+365 | 1.5, 0.9 |
| UGC 8055 | 13 June 2005 | 512 724 | 6.0 | 40, 27, 19 | 3.3, 2.7, 2.4 | 1254+116 | 2.0, 1.2 |
| UGC 8215 | 29 Nov 2004 | 112 324 | 6.0 | 46, 28, 17 | 3.6, 2.7, 2.4 | 1227+365 | 2.1, 1.2 |
| DDO 167 | 10 July 2004 | 57 269 | 3.5 | 51, 29, 19 | 6.0, 4.7, 4.1 | 1227+365 | 2.5, 1.3 |
| KK 195 | 4 Jan 2005 | 460 672 | 4.5 | 62, 30, 18 | 3.9, 2.7, 2.1 | 1018-317 | 2.2, 1.1 |
| KK 200 | 26 Nov 2004 | 381 593 | 5.0 | 48, 32, 21 | 2.9, 2.1, 1.8 | 1316-336 | 1.8, 0.9 |
| UGC 8508 | 31 Jan 2004 | 44 167 | 7.0 | 42, 32, 18 | 2.6, 2.2, 1.8 | 1400+621 | 1.5, 0.8 |
| E444-78 | 20 June 2004 | 475 686 | 2.5 | 48, 26, 18 | 6.0, 4.0, 3.5 | 1316-336 | 2.3, 1.6 |
| UGC 8638 | 9 July 2004 | 168 380 | 2.5 | 44, 25, 16 | 4.0, 2.6, 2.0 | 1330+251 | 1.7, 1.0 |
| DDO 181 | 6 June 2005 | 96 308 | 5.5 | 50, 26, 17 | 5.2, 3.4, 2.7 | 3C286 | 2.1, 1.2 |
| I4316 | 7 Aug 2005 | 474 686 | 2.7 | 48, 26, 15 | 3.6, 2.8, 2.3 | 1316-336 | 1.9, 1.0 |
| DDO 183 | 31 Jan 2004 | 86 298 | 6.5 | 42, 31, 17 | 2.7, 2.0, 1.7 | 1331+305 | 1.5, 0.9 |
| UGC 8833 | 16 June 2004 | 121 333 | 3.5 | 41, 30, 21 | 3.7, 2.8, 2.3 | 3C286 | 2.0, 1.5 |
| DDO 187 | 16 June 2004 | 47 259 | 2.5 | 46, 30, 19 | 5.0, 4.1, 3.4 | 3C286 | 2.4, 1.5 |
| P51659 | 14 Jan 2005 | 285 497 | 3.0 | 48, 26, 15 | 3.4, 2.6, 2.2 | 1316-336 | 1.9, 1.1 |
| KK 246 | 16 June 2004 | 255 469 | 2.5 | 61, 36, 15 | 4.2, 3.5, 2.9 | 1923-210 | 2.2, 1.2 |
| KKH 98 | 10 July 2004 | 243 32 | 6.0 | 42, 32, 15 | 3.2, 2.7, 2.4 | 0029+349 | 2.1, 1.2 |
For all the GMRT HI observations, the observing bandwidth of 1 MHz was divided into 128 spectral channels, yielding a spectral resolution of 7.81 kHz (velocity resolution of 1.65 km s-1). It is worth noting that this velocity resolution is 4 times better than most earlier interferometric studies of such faint dwarf galaxies (e.g.Lo et al. (1993)). This high velocity resolution is crucial to detect large scale velocity gradients in the faintest dwarf galaxies (e.g. Begum et al. (2003); Begum & Chengalur (2004a)). For each observing run, absolute flux and bandpass calibration was done by observing one of the standard flux calibrators 3C48, 3C286 and 3C147, at the start and end of the observations. For the sample galaxies with low LSR velocities, particular care was taken to choose a bandpass calibrator which does not have any absorption feature in the relevant velocity range. The phase calibration was done once every 30 min by observing a nearby VLA phase calibrator source.

The GMRT data were reduced in the usual way using the standard tasks in classic AIPS. For each run, bad visibility points were edited out, after which the data were calibrated. The GMRT does not do online doppler tracking – any required doppler shifts have to be applied during the offline analysis. However, for all of the sample galaxies, the differential doppler shift over our observing interval was much less than the channel width, hence, there was no need to apply any offline correction. The GMRT has a hybrid configuration (Swarup et al. 1991) with 14 of its 30 antennas located in a central compact array with size 1 km ( 5 k at 21cm) and the remaining antennas distributed in a roughly “Y” shaped configuration, giving a maximum baseline length of 25 km ( 120 k at 21 cm). The baselines obtained from antennas in the central compact array are similar in length to those of the “D” array of the VLA, while the baselines between the arm antennas are comparable in length to the “B” array of the VLA. A single observation with the GMRT hence yields information on both large and small angular scales. Data cubes at a range of angular resolutions were made using appropriate (u,v) ranges and tapers. In this paper we present only the low resolution HI images, i.e. made using (u,v) ranges of 05 k, 010 k and 0 k. Higher resolution observations of the FIGGS sample will be presented in the companion paper. To obtain the low resolution HI images for the sample galaxies, the uv-taper at each (u,v) range was adjusted to achieve as close as possible to a circular synthesized beam. A low resolution data cube was generated for each galaxy, using the AIPS task IMAGR, and the individual channels were inspected using the task TVMOVIE to identify the channels with HI emission. Emission was detected from all of the galaxies in our sample, except for SC 24, HS 117, KK 127 and KKR 25. Apart from HS 117, all of these galaxies were previously claimed to be detected by single dish observations. The GMRT data suggest that the previous flux measurements were spurious, probably as a result of confusion with galactic emission. The galaxies KK 127 and SC 24 are likely to be distant dwarf irregular galaxies whereas KKR 25 is a normal dwarf spheroidal galaxy (Begum & Chengalur (2005); Karachentsev et al. (2006)). In the case of HS 117, single dish observations did not detect this galaxy (Huchtmeier & Skillman (1998)). The HI data given in Karachentsev et al. (2002) is a result of misidentifying galactic HI emission as emission from HS 117. For the rest of the galaxies in the sample, frequency channels with emission were identified and the continuum maps were made at both low (26) and high (5) resolutions using the average of the remaining line free channels. No extended or compact emission was detected from the disk of any of our sample galaxies. All other continuum sources lying with the field of view were subtracted using the task UVSUB. After continuum subtraction, deconvolved data cubes of the line emission were made at a range of resolutions using the AIPS task IMAGR.
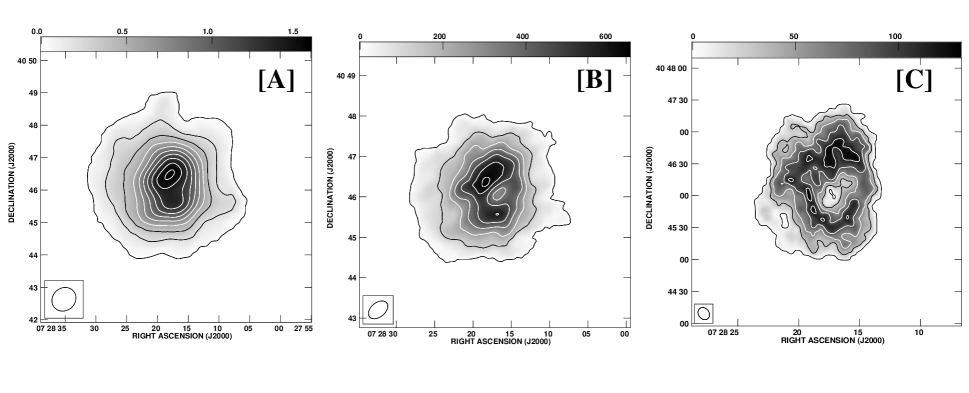
HI images at both high and low spatial resolutions are crucial for a complete understanding of the properties of the atomic ISM of faint dwarf galaxies. As an example, Figure 3 shows the integrated HI column distribution at various resolutions for one of the FIGGS galaxies DDO 43. This galaxy shows a faint, extended HI envelope which is only seen clearly in the lowest resolution HI maps. On the other hand, DDO 43 also has a large hole in the center (see also the VLA observations in Simpson, Hunter, & Nordgren (2005)), which is seen in the high resolution HI map. However this hole in the HI distribution is not at all obvious in the low resolution HI maps due to the beam smearing.
The setup and observational results for 49 galaxies from the FIGGS sample are given in Table 2. For the remaining 15 sample galaxies, the details of the observations and data analysis can be found in Begum et al., 2003; Begum & Chengalur, 2003, 2004a, 2004b; Begum et al., 2005; Begum & Chengalur, 2005; Begum et al., 2005, 2006 and Chengalur et al. 2008 (in preparation). In the case of UGCA 438, most of the short baselines were missing because of the non availability of some of the GMRT antennas during the observing run, thus missing the diffuse, extended emission from the galaxy. Future observations of this galaxy are planned. We have not considered this galaxy for the analysis in this paper. The columns in Table 2 are as follows: Column(1) the galaxy name, Column(2) the date of observations, Column(3) the velocity coverage of the observation, Column(4) the total integration time on source, Column(5) the synthesized beam sizes of the data cubes, Column(6) the rms noise per channel for the different resolution data cubes, Column(7) the phase calibrator used, Column(8) the limits on continuum emission from the galaxy at resolutions of (26) and (5) respectively. We note that although for some of the sample galaxies the on-source integration time is short ( hours), the hybrid configuration of the GMRT leads to a reasonable sampling of the (u,v) plane. As an example, Figure 4 shows the (u,v) coverage for UA 92, the sample galaxy with the shortest on source integration time (viz. 2.1 hours).
We examined the line profiles at various locations in the galaxy and found that they were (to zeroth order) symmetric and single peaked. For some galaxies, in the very high column density regions, a double gaussian and/or a gauss-hermite fit does provide a somewhat better description of the data, but even in these regions, the mean velocity produced by the moment method agrees within the errors with the peak velocity of the profile. Since we are interested here mainly in the systematic velocities, moment maps provide an adequate description of the data. Moment maps (i.e. maps of the total integrated flux (moment 0), the flux weighted velocity (moment 1) and the flux weighted velocity dispersion (moment 2)) were made from the data cubes using the AIPS task MOMNT. To obtain the moment maps, lines of sight with a low signal to noise ratio were excluded by applying a cutoff at the level, ( being the rms noise level in a line free channel), after smoothing in velocity (using boxcar smoothing three channels wide) and position (using a gaussian with full width at half maximum (FWHM) times that of the synthesized beam). Maps of the velocity field were also made in GIPSY using single gaussian fits to the individual profiles. The velocities produced by MOMNT in AIPS are in reasonable agreement with those obtained using a single gaussian fit. Note that the AIPS moment 2 map systematically underestimates the velocity dispersion (as obtained from gaussian fitting) particularly near the edges where the signal to noise ratio is low. This can be understood as the effect of the thresholding algorithm used by the MOMNT task to identify the regions with signal.


5 Results and Discussion
A detailed analysis of FIGGS data will be presented in companion papers. Here we restrict ourselves to a preliminary analysis of the global HI and optical properties of the FIGGS sample.
| Galaxy | FIGMRT | Vsys | V50 | DHI | MHI | iHI | Ref | |||
|---|---|---|---|---|---|---|---|---|---|---|
| (Jy kms-1) | (kms-1) | (kms-1) | () | (10) | (deg) | |||||
| And IV | 19.5 2.0 | 237.0 | 90.0 | 7.6 | 205.19 | 16.9 | 6.9 | 0.87 0.11 | 55.0 5.0 | 14 |
| DDO 226 | 4.8 0.5 | 358.57 | 37.0 | 3.5 | 25.95 | 0.36 | 1.09 | 0.79 0.10 | 55.0 5.0 | 1 |
| DDO 6 | 2.6 0.3 | 291.83 | 19.2 | 3.3 | 6.82 | 0.44 | 1.57 | 0.77 0.10 | 2 | |
| UGC 685 | 11.8 1.2 | 156.29 | 64.4 | 3.6 | 56.15 | 0.68 | 1.64 | 0.99 0.11 | 36.0 4.0 | 3 |
| KKH 6 | 3.0 0.3 | 59.92 | 28.0 | 2.6 | 10.18 | 0.71 | 2.90 | 0.72 | 30.0 3.0 | 2 |
| KK 14 | 1.8 0.2 | 420.11 | 27.7 | 2.4 | 21.93 | 1.98 | 1.50 | 0.89 0.10 | 45.0 3.0 | 6 |
| KKH 11 | 25.0 2.5 | 295.71 | 84.4 | 7.2 | 52.88 | 1.56 | 4.23 | 1.09 0.12 | 66.0 3.0 | 2 |
| KKH 12 | 5.5 0.6 | 70.0 | 48.4 | 4.6 | 11.63 | 0.46 | 2.10 | 0.34 | 60.0 3.0 | 2 |
| KK 41 | 18.8 1.9 | 54.2 | 38.5 | 8.7 | 67.20 | 1.03 | 3.35 | 0.42 | 30.0 4.0 | 2 |
| UGCA 92 | 70.0 7.1 | 4.58 | 56.2 | 9.0 | 156.05 | 0.55 | 4.50 | 0.70 | 56.0 3.0 | 5 |
| KK 44 | 4.6 0.4 | 77.5 | 21.4 | 3.2 | 12.2 | 1.4 | 2.3 | 1.02 0.11 | 61.0 5.0 | 11 |
| KKH 34 | 2.1 0.2 | 106.29 | 21.7 | 2.6 | 10.44 | 0.81 | 2.60 | 0.89 0.1 | 45.0 3.0 | 2 |
| E490-17 | 7.3 0.7 | 505.17 | 39.2 | 3.0 | 30.26 | 0.32 | 1.50 | 1.11 0.13 | 2 | |
| UGC 3755 | 6.5 0.7 | 310.81 | 34.5 | 3.0 | 41.30 | 0.29 | 1.67 | 0.96 0.11 | 46.0 4.0 | 2 |
| DDO 43 | 14.2 1.4 | 352.63 | 36.5 | 5.0 | 203.02 | 1.64 | 2.78 | 1.20 0.15 | 30.0 5.0 | 2 |
| KK 65 | 2.52 0.3 | 281.45 | 33.3 | 2.1 | 34.38 | 0.43 | 2.33 | 0.97 0.11 | 47.0 4.0 | 2 |
| UGC 4115 | 21.6 2.2 | 342.78 | 78.0 | 6.0 | 285.53 | 3.59 | 4.00 | 1.00 0.11 | 50.0 7.0 | 2 |
| KDG 52 | 3.8 0.4 | 116.0 | 20.6 | 3.5 | 10.8 | 1.8 | 2.7 | 0.85 0.11 | 23.0 4.0 | 11 |
| UGC 4459 | 21.5 2.2 | 19.2 | 29.6 | 4.5 | 64.2 | 1.4 | 2.8 | 1.01 0.11 | 30.0 4.0 | 11 |
| KK 69 | 3.0 0.3 | 462.04 | 13.1 | 4.0 | 41.89 | 2.11 | 2.0 | 1.07 0.12 | 35.0 3.0 | 2 |
| UGC 5186 | 1.4 0.1 | 546.08 | 34.0 | 1.6 | 15.66 | 0.65 | 1.00 | 0.96 0.11 | 2 | |
| UGC 5209 | 2.0 0.2 | 535.19 | 31.6 | 1.9 | 21.10 | 0.75 | 2.11 | 1.21 0.13 | 7 | |
| UGC 5456 | 8.0 0.8 | 526.75 | 62.4 | 2.8 | 58.96 | 0.35 | 1.50 | 1.16 0.14 | 60.0 5.0 | 3 |
| UGC 6145 | 2.1 0.2 | 753.0 | 41.1 | 2.7 | 27.02 | 0.96 | 1.59 | 1.00 0.11 | 55.0 5.0 | 5 |
| UGC 6456 | 10.1 1.0 | 93.69 | 37.4 | 3.7 | 43.89 | 0.69 | 2.47 | 0.72 | 65.0 3.0 | 2 |
| UGC 6541 | 2.7 0.3 | 249.36 | 25.5 | 2.1 | 9.65 | 0.20 | 1.29 | 0.90 0.10 | 2 | |
| NGC 3741 | 74.7 7.5 | 228.8 | 83.4 | 14.6 | 130.0 | 4.7 | 8.80 | 68.0 4.0 | 10 | |
| KK 109 | 0.76 0.08 | 210.67 | 18.2 | 1.4 | 3.62 | 2.98 | 1.00 | 1.08 0.12 | 2 | |
| DDO 99 | 33.0 3.3 | 251.22 | 33.7 | 9.6 | 52.42 | 1.32 | 2.74 | 1.04 0.12 | 5 | |
| E379-07 | 5.0 0.5 | 644.04 | 28.5 | 3.6 | 31.77 | 2.43 | 3.27 | 0.93 0.10 | 31.0 6.0 | 8 |
| E321-014 | 1.3 0.1 | 609.39 | 19.0 | 2.1 | 3.13 | 0.17 | 1.49 | 0.46 0.05 | 5 | |
| UGC 7242 | 7.2 0.7 | 66.05 | 66.5 | 4.0 | 45.75 | 0.70 | 2.11 | 1.02 0.11 | 58.0 3.0 | 5 |
| CGCG 269-049 | 4.7 0.5 | 159.0 | 26.6 | 2.6 | 26.4 | 0.9 | 2.3 | 0.91 0.10 | 42.0 4.0 | 11,12 |
| UGC 7298 | 5.2 0.5 | 174.0 | 21.4 | 3.5 | 21.6 | 1.7 | 3.1 | 1.06 0.11 | 28.0 3.0 | 11 |
| UGC 7505 | 11.5 1.2 | 316.0 | 125.1 | 5.3 | 442.78 | 1.72 | 5.30 | 0.92 0.10 | 70.0 4.0 | 5 |
| KK 144 | 8.7 0.9 | 479.54 | 37.5 | 4.7 | 81.15 | 4.80 | 3.13 | 1.01 0.11 | 57.0 4.0 | 2 |
| DDO 125 | 21.7 2.2 | 206.25 | 27.4 | 7.0 | 31.87 | 0.44 | 1.67 | 1.00 0.11 | 5 | |
| UGC 7605 | 4.93 0.5 | 309.95 | 25.8 | 3.3 | 22.29 | 0.55 | 1.50 | 0.87 0.10 | 40.0 5.0 | 2 |
| UGC 8055 | 11.0 1.1 | 609.05 | 85.6 | 4.2 | 782.64 | 3.20 | 3.00 | 1.34 0.32 | 45.0 3.0 | 3 |
| GR 8 | 9.0 0.9 | 217.0 | 26.0 | 4.3 | 10.38 | 1.02 | 2.3 | 1.03 0.11 | 27.0 4.0 | 11 |
| UGC 8215 | 4.5 0.5 | 224.15 | 24.6 | 3.5 | 21.41 | 1.72 | 3.50 | 1.05 0.11 | 45.0 4.0 | 2 |
| DDO 167 | 3.7 0.4 | 150.24 | 18.6 | 2.0 | 14.51 | 0.78 | 1.25 | 0.88 0.10 | 4 | |
| KK 195 | 4.8 0.5 | 571.91 | 24.0 | 5.0 | 30.50 | 3.88 | 3.85 | 0.91 0.11 | 52.0 4.0 | 5 |
| KK 200 | 1.6 0.2 | 493.69 | 17.4 | 1.4 | 7.96 | 0.84 | 1.00 | 0.94 0.11 | 2 | |
| UGC 8508 | 18.3 1.8 | 56.17 | 45.8 | 6.6 | 29.07 | 1.21 | 3.30 | 1.21 0.14 | 53.0 4.0 | 4 |
| E444-78 | 2.3 0.2 | 577.0 | 30.6 | 0.9 | 14.62 | 0.45 | 1.67 | 0.83 0.12 | 42.0 3.0 | 9 |
| UGC 8638 | 3.5 0.4 | 275.9 | 30.8 | 1.2 | 13.76 | 0.30 | 1.00 | 0.90 0.10 | 2 | |
| DDO 181 | 12.2 1.2 | 213.6 | 39.1 | 5.2 | 27.55 | 1.08 | 3.25 | 1.07 0.12 | 53.0 3.0 | 2 |
| I4316 | 2.2 0.2 | 576.34 | 21.5 | 2.8 | 10.01 | 0.18 | 1.00 | 1.05 0.12 | 5 | |
| DDO 183 | 10.5 1.1 | 188.37 | 28.7 | 4.6 | 25.90 | 0.90 | 2.71 | 1.07 0.12 | 67.0 3.0 | 2 |
| UGC 8833 | 6.3 0.6 | 221.03 | 27.8 | 3.0 | 15.16 | 1.05 | 2.31 | 1.05 0.11 | 26.0 3.0 | 2 |
| KK 230 | 2.2 0.2 | 63.31 | 17.0 | 3.0 | 1.90 | 1.9 | 3.3 | 0.86 0.11 | 50.0 4.0 | 11 |
| DDO 187 | 11.1 1.1 | 159.95 | 30.6 | 3.4 | 16.30 | 1.04 | 1.36 | 0.93 0.10 | 37.0 4.0 | 2 |
| P51659 | 17.4 1.7 | 391.48 | 46.4 | 6.5 | 52.99 | 6.31 | 2.71 | 1.03 0.11 | 68.0 4.0 | 5 |
| KK 246 | 4.4 0.4 | 434.71 | 52.2 | 3.5 | 84.50 | 1.36 | 2.69 | 0.53 | 56.0 3.0 | 5 |
| KK 250 | 16.4 1.6 | 126.0 | 95.5 | 5.8 | 121.0 | 1.2 | 3.2 | 0.82 0.11 | 73.0 4.0 | 13 |
| KK 251 | 10.6 1.0 | 130.3 | 51.7 | 4.2 | 78.0 | 1.6 | 2.6 | 0.73 0.11 | 59.0 5.0 | 13 |
| DDO 210 | 12.1 1.2 | 139.5 | 19.1 | 4.8 | 2.8 | 1.0 | 1.3 | 1.05 0.11 | 26.0 7.0 | 11 |
| KKH 98 | 4.4 0.4 | 132.26 | 20.7 | 3.8 | 6.46 | 2.02 | 3.45 | 1.07 0.12 | 46.0 5.0 | 2 |
References: 1-Cote et al. (1997) 2-Huchtmeier et al. (2003) 3-Hoffman et al. (1996) 4-Huchtmeier & Richter (1986) 5-Karachentsev et al. (2004) 6-Giovanelli et al. (2005) 7-Springob et al. (2005) 8-Matthews et al. (1995) 9-Bouchard et al. (2007) 10-Begum et al. (2008) 11-Begum et al. (2006) 12-Pustilnik & Martin (2007) 13-Begum & Chengalur (2004b) 14- Chengalur et al. 2008 (in preparation)
The global HI profiles for our sample galaxies, obtained from the coarsest resolution data cubes (see Table 2) are shown in Figure 5. The parameters derived from the global HI profiles for the whole FIGGS sample are listed in Table 3. The columns are as follows: (1) the galaxy name, (2) the integrated HI flux along with the errorbars, (3) the central heliocentric velocity (Vsys), (4) the velocity width at 50% of the peak (), (5) the HI diameter (in arcmin) at a column density of atoms cm-2 (DHI), (6) the derived HI mass (MHI), (7) the HI mass-to-light ratio (M), (8) the ratio of the HI diameter to the Holmberg diameter. (9) the ratio of the GMRT flux to the single dish flux (FI/FISD), (10) the inclination as measured from the HI moment 0 maps (iHI), and (11) the reference for the single dish fluxes.
As seen in Column(9) in Table 3, the HI flux measured from the GMRT HI profiles for most FIGGS galaxies, in general, agree (within the errorbars) with the values obtained from the single dish observations. The average ratio of GMRT flux to single dish flux is . This indicates that in general no flux was missed because of the missing short spacings in our interferometric observations. However, for some galaxies the integrated flux derived from the GMRT observations is significantly smaller than the single dish values. The GMRT fluxes could be lower than those obtained from single dish measurements either because of (i) a calibration error or (ii) a large fraction of HI being in an extended distribution that is resolved out, or (iii) the single dish flux is erroneous, possibly because of confusion with galactic emission. However, the flux of the point sources seen in the GMRT images are in good agreement with those listed in NVSS, indicating that our calibration is not at fault. We note that in the case of KKH 12, KKH 6, UGC 6456, UGCA 92 and KK 41 there is a strong local HI emission at velocities very close to the systemic velocities, making it likely that the single dish integrated flux measurements for these galaxies were contaminated by blending of their HI emission with that of the galactic emission. In the case of KK 246, its HI spectrum was near the edge of the GMRT observing band, hence the flux could not be reliably estimated.
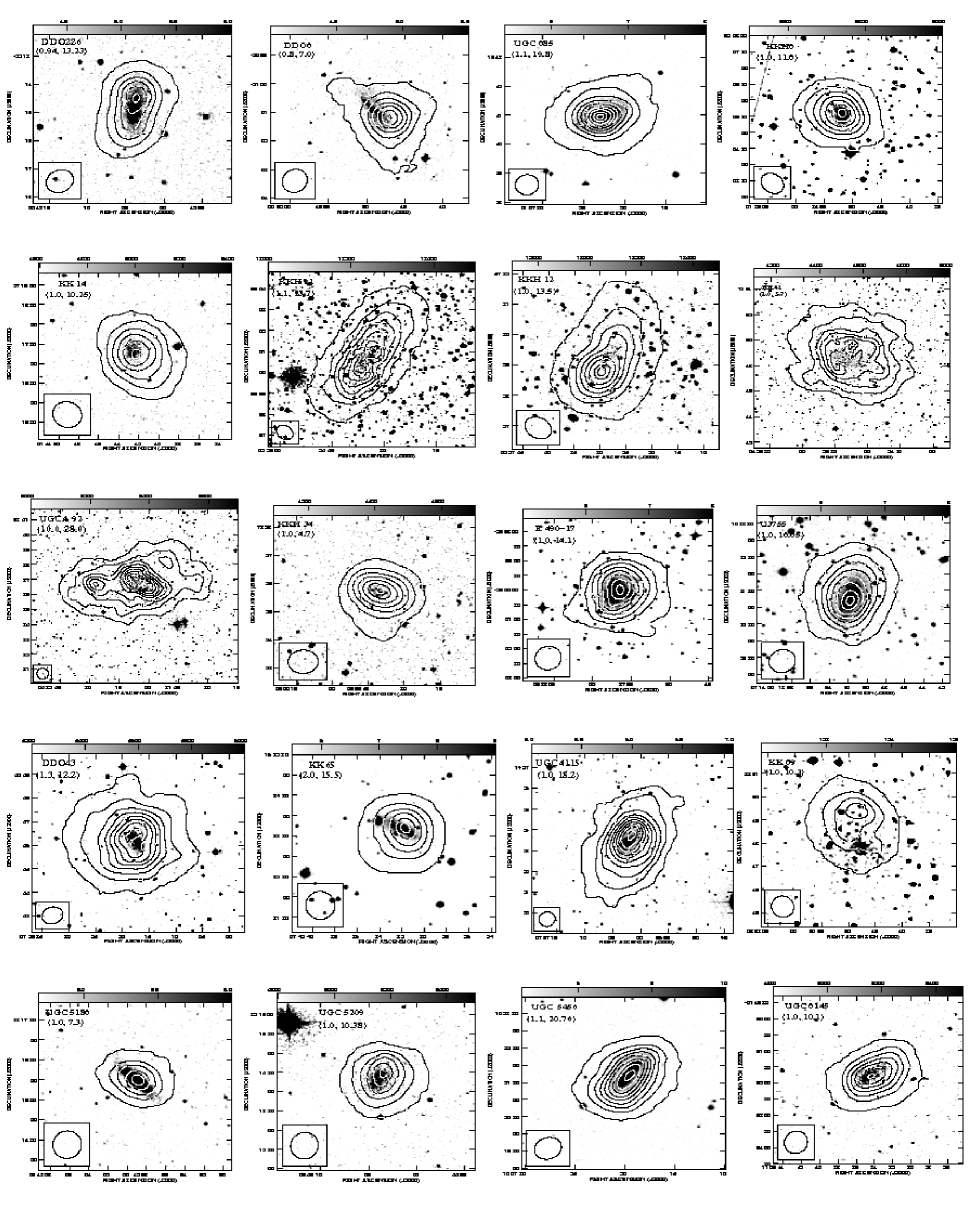
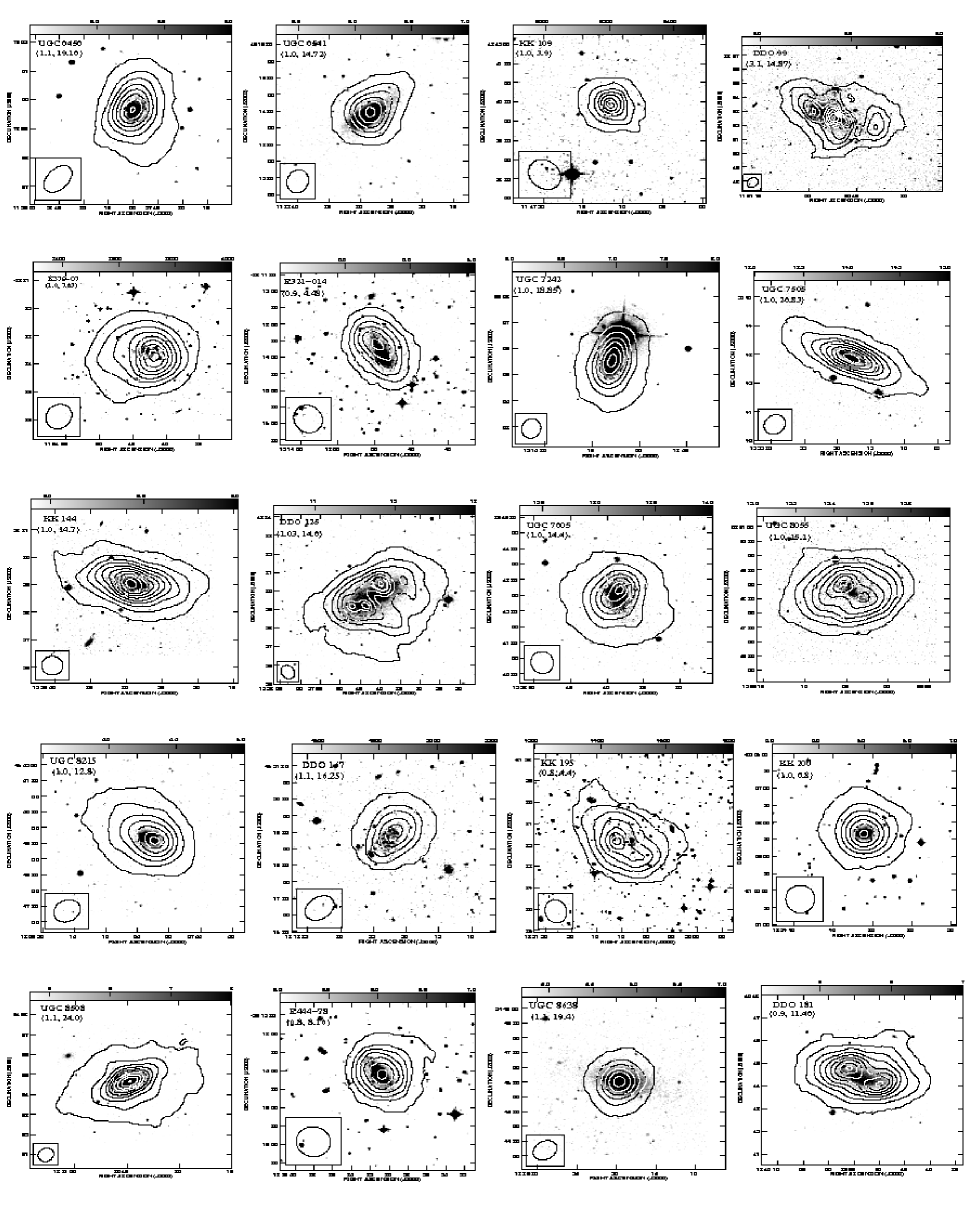
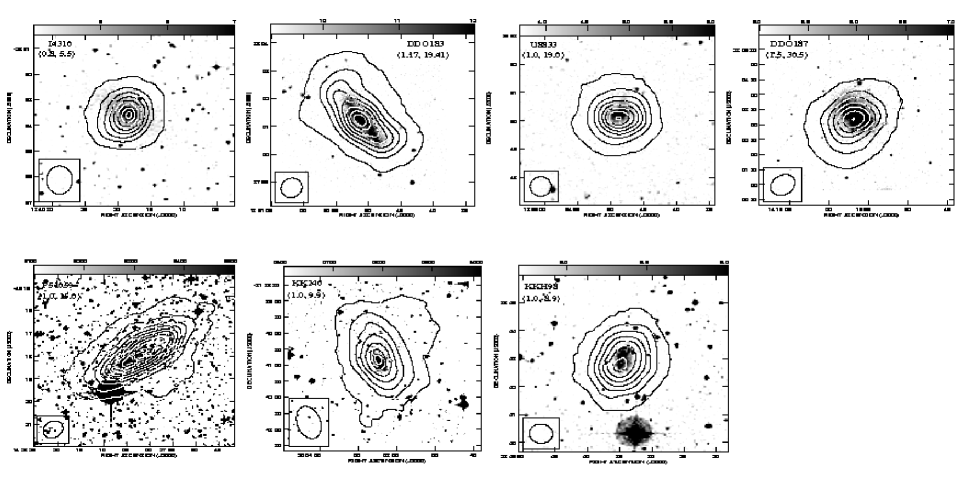
The GMRT integrated HI emission of the sample galaxies, obtained from the coarsest resolution data cubes (see Table 2), overlayed on the optical Digitized Sky Survey (DSS) images are shown in Figure 6.
The HI morphological inclinations (iHI) for our sample galaxies were estimated from the integrated HI maps by fitting elliptical annuli to the HI images at various resolutions. For sample galaxies which have HI disks less extended than 2 synthesised beams (across the diameter of the galaxy) at the lowest HI resolution, could in principle be derived from the higher resolution HI maps. However, for most sample galaxies ellipse fitting to the high resolution HI maps is not reliable because of clumpiness in the central high column density regions. The derived inclination (without applying any correction for the intrinsic thickness of the HI disk) is given in Column(10) in Table 3. Figure 7 shows a comparison between the morphological inclination derived from the optical and HI isophotes of the galaxy. No correction has been applied for the intrinsic thickness of the disk in both cases. The solid line shows a case when both inclinations are the same. We find that for 6 galaxies the HI inclination is significantly greater than the optical inclination (viz. KKH 11, UGC 6456, NGC 3741, UGC 8055, KK 230, KK 250). On the other hand, for many galaxies the optical inclination is found to be systematically higher than the inclination derived from the HI morphology. This result, if interpreted literally, suggest that the HI disks of these galaxies are thicker than the disks of their optical counterparts. However, we caution that a proper analysis using deconvolved angular sizes of the the HI disks needs to be done before a firm conclusion can be drawn.
The diameter of the HI disk at a column density of atoms cm-2 (except for UGCA 92 where the HI diameter is measured at atoms cm-2) estimated from the lowest resolution integrated HI emission maps is given in Column(7) of Table 3. The ratio of the HI diameter to the optical (Holmberg) diameter for the sample is also given in Column(9) of the same table. Figure 8 shows the histogram of the derived HI extent of FIGGS at Ncm-2, normalised to the Holmberg diameter of the galaxy. The median HI extent of the FIGGS sample (normalised to Holmberg diameter of the galaxy) is 2.4. For a comparison, Hunter (1997) using the data compiled from the literature for comparatively bright Im galaxies found that the ratio of D is somewhat smaller, viz. 1.52. The extreme outliers in Figure 8 is NGC 3741, our FIGGS data show it to have an HI extent of 8.3 times DHo (Holmberg diameter). Follow-up WSRT+DRAO+GMRT observations resulted in HI being detected out to 8.8 DHo NGC 3741 has the most extended HI disk known. For NGC 3741 the rotation curve could be derived out a record of 44 times the disk scale length and from the last measured point of the rotation curve we estimate the dynamical mass to light ratio, M which makes it one of the “darkest” irregular galaxies known (Begum et al. 2005, 2008).
Figure 9 shows a tight correlation between HI mass and the HI diameter, measured at cm-2 for FIGGS sample. The galaxies in FIGGS sample with accurate distances are shown as solid points, whereas the remaining galaxies are shown as open circle. The best fit to the whole FIGGS sample shown as a solid line gives
| (1) |
The best fit relation was also derived using only the galaxies with TRGB distances, however no significant difference was found between the best fit parameters derived in this case and that derived using the whole sample. Eqn.(1) implies that the HI disks of the FIGGS sample are well described as having an constant average surface mass density M⊙ pc-2. A tight correlation between HI mass and the size of the HI disk has been noted earlier for spiral galaxies (e.g. Broeils & Rhees (1997)) and for brighter dwarf galaxies (Swaters 1999). For these samples the HI diameter was measured at a slightly higher column density, viz. 1 M⊙ pc-2. For the FIGGS galaxies, the relationship between the HI mass and the HI diameter measured at 1 M⊙ pc-2 is , for comparison, Broeils & Rhees (1997) measure . The fit coefficients overlap within the error bars. Hence from the FIGGS data we find that there is at best marginal evidence for a decrease in average HI surface density with decreasing HI mass; to a good approximation, the disks of gas rich galaxies, ranging over 3 orders of magnitudes in HI mass, can be described as being drawn from a family with constant HI surface density. The HI mass also correlates with the optical (Holmberg) diameter (shown in Fig. 10), although with a larger scatter. A linear fit with a slope and intercept of 1.740.22 and 6.930.18, respectively is shown as a solid line. The larger scatter in the relation between MHI and the optical diameter, also seen in sample of brighter dwarfs (e.g. Swaters (1999)), is probably indicative of a looser coupling between the gas and star formation in dwarfs, compared to that in spiral galaxies.
Figure 11 shows the HI mass to light ratio for the FIGGS sample plotted as a function of the HI extent, D. A trend of an increase in the M with an increase in the HI extent of the galaxies is clearly seen. The best fit to the FIGGS sample shown as a solid line gives
| (2) |
van Zee et al.(1995) from a HI mapping of a sample of low luminosity galaxies also found an evidence of an extended HI extent for high M galaxies.


Figure 12 shows M for the FIGGS sample as a function of MB. The same quantity for several other spiral and dwarf galaxies, spanning a range in absolute B magnitude from M to M is also plotted. The sample from which these galaxies have been drawn are listed in the figure caption. The galaxies in FIGGS sample with TRGB distances are shown as solid circles, whereas the remaining FIGGS galaxies are shown as open circles. The solid line shows an empirically determined upper envelope for M as a function of a MB from Warren et al. (2007). This upper envelope can be interpreted as a minimum fraction of the total baryonic mass which needs to be converted into stars in order for a galaxy of a given baryonic mass to remain gravothermally stable (Warren et al. (2007)). It is interesting to note that except for And IV, all FIGGS galaxies lie much below this upper envelope. This implies that these galaxies have converted much more baryons into stars than the minimum required for remaining stable. In this context, it is interesting to note that the average gas fraction for the FIGGS sample is 0.7. Thus, for the majority of the dwarf galaxies in our sample, the baryonic mass is dominated by gas, rather than stars.
In order to investigate the environmental dependence of the HI content for FIGGS galaxies, we plot M for FIGGS sample as a function of tidal index (TI) (Figure 13). Some additional gas rich galaxies with known HI extent are also plotted in the figure. TI is taken from Karachentsev et al. (2004) and it represents the local mass density around a given galaxy, estimated using a large sample of galaxies within 10 Mpc of the Milky Way. A negative value of TI for a galaxy indicates that the galaxy is isolated, whereas a positive number indicates that the galaxy is in a dense environment. Figure 13. shows that most of the FIGGS galaxies are in less dense environments, and that all the galaxies with high M (i.e 2.5) have negative tidal index i.e are isolated. Figure 14 shows the HI extent of the FIGGS sample, normalised to the optical (Holmberg) radius, plotted as a function of TI. As seen in the figure, the galaxies with very extended HI disks () are isolated.
To summarize, we have presented the first results from the Faint Irregular Galaxies GMRT Survey (FIGGS). FIGGS is a large imaging program aimed at providing a comprehensive and statistically robust characterisation of the neutral ISM properties of extremely faint, nearby, gas rich, dIrr galaxies using the GMRT. The GMRT HI data is supplemented with observations at other wavelengths. The HI images in conjunction with the optical data will be used to investigate a variety of scientific questions including the star formation feedback on the neutral ISM, threshold for star formation, baryonic TF relation and dark matter distribution in low mass galaxies. The optical properties of the FIGGS sample, GMRT observations and the main science drivers for the survey are described. The GMRT integrated HI column density maps and the HI spectra for the sample galaxies are presented. The global HI properties of the FIGGS sample, derived from the GMRT observations, and their comparison with the optical properties of the sample galaxies are also presented. A detailed comparison of the gas distribution, kinematics and star formation in the sample galaxies will be presented in the companion papers.
Acknowledgments
The observations presented in this paper were made with the Giant Metrewave Radio Telescope (GMRT). The GMRT is operated by the National Center for Radio Astrophysics of the Tata Institute of Fundamental Research. Partial support for this work was provided by ILTP grant B-3.13.
References
- Begum et al. (2003) Begum, A., Chengalur, J.N. & Hopp, U., 2003, New Astronomy, 8, 267
- Begum & Chengalur (2003) Begum, A & Chengalur, J.N., 2003, A&A, 409, 879
- Begum & Chengalur (2004a) Begum, A & Chengalur, J.N., 2004, A&A, 413, 525
- Begum & Chengalur (2004b) Begum, A & Chengalur, J.N., 2004, A&A, 424, 509
- Begum & Chengalur (2005) Begum, A & Chengalur, J.N., 2005, MNRAS, 362, 609
- Begum et al. (2005) Begum, A, Chengalur, J.N. & Karachentsev, I. D., 2005, A&A, 433, 1L
- Begum et al. (2005) Begum, A, Chengalur, J.N., Karachentsev, I. D. & Sharina, M. E., 2005, MNRAS, 359, 53L
- Begum et al. (2006) Begum, A, Chengalur, J.N., Karachentsev, I. D., Kaisin, S. S. & Sharina, M. E., 2006, MNRAS, 365, 1220
- Begum et al. (2008) Begum, A, Chengalur, J.N., Kennicutt, R. C., Karachentsev, I. D. & Janice, L. C., 2008, MNRAS, 383, 809
- Bell et al. (2003) Bell, E. F., McIntosh, D. H., Katz, N. & Weinberg, M. D., 2003, ApJSS, 149, 289
- Blanton et al. (2007) Blanton, M. R., Geha, M. & West, A. A. 2007 (astro-ph/0707.3813)
- Bouchard et al. (2007) Bouchard, A., Jerjen, H., Da Costa, G. S. & Ott, J., 2007, AJ, 133, 261
- Bremnes et al. (1999) Bremnes, T., Binggeli, B. & Prugniel, P., 1999, A&AS, 137, 337
- Bremnes et al. (2000) Bremnes, T., Binggeli, B. & Prugniel, P., 2000, A&AS, 141, 211
- Broeils & Rhees (1997) Broeils, A. H. & Rhees, M. H., 1997, A&A, 324, 877
- Carignan & Purton (1998) Carignan, C., & Purton, C. 1998, ApJ, 506, 125
- Cannon et al. (2004) Cannon, J. M., McClure-Griffiths, N. M., Skillman, Evan D. & Côté S., 2004, ApJ, 607, 274
- Corbin et al. (2008) Corbin, M. R., Kim, H., Jansen, R. A., Windhorst, R. A. & Fernandes, R. C., 2008 ApJ (in press) (astro-ph-0710.2557v1)
- Cote et al. (1997) Cote, S., Freeman, K. C., Carignan, C. & Quinn, P. J., 1997, AJ, 114, 1313
- Côté et al. (2000) Côté S., Carignan, C. & Freeman, K. C., 2000, AJ, 120, 3027
- de Blok et al. (2003) de Blok, W. J. G., Bosma, A. & McGaugh, S., 2003, MNRAS, 340, 657
- de Blok (2005) de Blok, W. J. G., 2005, ApJ, 634, 227
- Dekel & Woo (2003) Dekel, A. & Woo, J., 2003, MNRAS, 344, 1131
- Efstathiou (2000) Efstathiou, G. 2000, MNRAS, 317, 697
- Ekta et al. (2006) Ekta, Chengalur, J. N., Pustilnik, S. A., 2006, MNRAS, 372, 853
- Ferguson et al. (2000) Ferguson, A. M. N., Gallagher, J. S. & Wyse, R. F. G., 2000, AJ, 120, 821
- Geha et al. (2006) Geha, M., Blanton, M. R., Masjedi, M. & West, A. A., 2006, ApJ, 653, 240
- Giovanelli et al. (2005) Giovanelli, R. et al. 2005, AJ, 130, 2613
- Hoffman et al. (1996) Hoffman, G. L., Salpeter, E. E., Farhat, B., Roos, T., Williams, H. & Helou, G., 1996, ApJS, 105, 269
- Hopp & Schulte-Ladbeck (1995) Hopp, U. & Schulte-Ladbeck, R. E., 1995, A&AS, 111, 527
- Hunter (1997) Hunter, D., 1997, PASP, 109, 937
- Hunter & Elmegreen (2006) Hunter, D. A. & Elmegreen, B. G., 2006, ApJS, 162, 49
- Huchtmeier & Richter (1986) Huchtmeier, W. K. & Richter, O. G., 1986, A&AS, 63, 323
- Huchtmeier & Skillman (1998) Huchtmeier, W. K. & Skillman, E., 1998, A&AS, 127, 269
- Huchtmeier et al. (2003) Huchtmeier, W. K., Karachentsev, I. D. & Karachentseva, V. E., 2003 A&A, 401, 483
- Kanekar & Chengalur (2005) Kanekar, N. & Chengalur, J. N., 2005, A&A, 429, L51
- Karachentsev et al. (1996) Karachentseva I. D., Prugniel, P., Vennik, J., Richter, G. M., Thuan, T. X., & Martin, J. M., 1996, A&AS, 117, 343
- Karachentsev et al. (1999) Karachentsev I. D., Makarova, L. N. & Andersen, M. I., 1999, MNRAS, 307, 37L
- Karachentsev et al. (2004) Karachentsev I. D., Karachentseva V. E., Huchtmeier W. K. & Makarov D. I., 2004, AJ, 127, 2031
- Karachentsev et al. (2006) Karachentsev I. D. et al., 2006, AJ, 131, 1361
- Kennicutt (1989) Kennicutt, R. C., 1989, ApJ, 344, 685
- Lo et al. (1993) Lo, K. Y., Sargest, W. L. W. & Young, K., 1993, AJ, 106, 507
- Makarova (1999) Makarova, L., 1999, A&AS, 139, 491
- Makarova et al. (2002) Makarova, L., Karachentsev, I. D., Grebel, E. K. & Barsunova, O. Y., 2002, A&A, 384, 71
- Makarova et al. (2005) Makarova, L., Karachentsev, I. D., Grebel, E. K., Harbeck, D., Korotkova, G. G. & Geisler, D., 2005, A&A, 433, 751
- Mcgaugh et al. (2000) McGaugh, S. S., Schombert, J. M., Bothun, G. D., de Blok, W. J. G., 2000, ApJL, 533, 99
- McGaugh (2005) McGaugh, S. S., 2005, ApJ, 632, 859
- Matthews et al. (1995) Matthews, L. D., Gallagher, J. S., Littleton, J. E., 1995, AJ, 110, 581
- Miralda-Escude & Rees (1997) Miralda-Escude, J. & Rees, M. J., 1997, ApJ, 478,57
- Navarro et al. (2004) Navarro et al., 2004, MNRAS, 349, 1039
- Parodi (2002) Parodi, B. R., Barazza, F. D. & Binggeli, B., 2002, A&A, 388, 29
- Pustilnik & Martin (2007) Pustilnik, S. A. & Martin, J. M., 2007, A&A, 464, 859
- Schaye (2004) Schaye, J., 2004, ApJ, 609, 667
- Simon & Geha (2007) simon, J. D. & Geha, M., 2007, ApJ, 670, 313
- Simpson, Hunter, & Nordgren (2005) Simpson C. E., Hunter D. A., Nordgren T. E., 2005, AJ, 130, 1049
- Skillman (1987) Skillman, E. D., 1987, in Star Formation in Galaxies, edited by C. J. Lonsdale Persson, NASA, 263
- Springob et al. (2005) Springob, C. M., Haynes, M. P., Giovanelli, R. & Kent, B. R., 2005, ApJS, 160, 149
- Stil & Israel (2002) Stil, J. M. & Israel. F. P., 2002, A&A, 389, 29
- Swarup et al. (1991) Swarup, G., Ananthakrishnan, S., Kapahi, V.K., Rao, A.P., Subrahmanya, C.R. & Kulkarni, V.K. 1991, Current Science, 60, 95
- Swaters (1999) Swaters, R., 1999, PhD thesis, Rijksuniversiteit Groningen
- Taylor (1994) Taylor, C. L., Brinks, E., Pogge, R. W. & Skillman, E. D., 1994 AJ, 107, 971
- Taylor et al. (2005) Taylor, V. A., Jansen, R. A., Windhorst, R. A., Odewahn, S. C. & Hibbard, J. E., 2005, ApJ, 630, 784
- Tully et al. (2006) Tully, B. et al. 2006, AJ, 132, 729
- van Zee et al. (1995) van Zee, L., Haynes, M. P. & Giovanelli, R., 1995, AJ, 109, 990
- van Zee (2000) van Zee, L., 2000, ApJ, 119, 2757
- van den Bosch & Swaters (2001) van den Bosch, F. C., Swaters, R. A., 2001, MNRAS, 325, 1017
- Verheijen & Sancisi (2001) Verheijen, M.A.W & Sancisi, R., 2001, A&A, 370, 765
- Verheijen (2001) Verheijen, M.A.W, 2001, ApJ, 563, 694
- Warren et al. (2004) Warren, B. E., Jerjen, H. & Koribalski, B. S., 2004, AJ, 128, 1152
- Warren et al. (2007) Warren, B. E., Jerjen, H. & Koribalski, B. S., 2007, AJ, 134, 1849
- Weldrake et al. (2003) Weldrake, D. T. F., de Blok, W. J. G. & Walter, F., 2003, MNRAS, 340, 12
- Young et al. (2003) Young, L. M., van Zee, L., Lo, K. Y., Dohm-Palmer, R. C., & Beierle, M. E. 2003, ApJ, 592, 111
- Zwaan et al. (2005) Zwaan, M. A., Meyer, M. J., Steveley-Smith, L. & Webster, R. L., 2005, MNRAS, 359, L30