| Astronomy Letters, 2007, vol. 33, No.8, pp.520-530 |
| Translated from Pis’ma v Astronomicheskii Zhurnal, 2007, vol. 33, No.8, pp.585-597 |
2D Spectroscopy of Candidate Polar-Ring Galaxies:
I. The Pair of Galaxies UGC 5600/09
L.V. Shalyapina111lshal@astro.spbu.ru, O.A.Merkulova222olga_merkulova@list.ru, V.A.Yakovleva, and E. V. Volkov
Sobolev Astronomical Institute, St. Petersburg State University,
Universitetskii pr. 2, Petrodvorets, 198904 Russia
Abstract
Observations of the pair of galaxies VV 330 with the SCORPIO multimode instrument on the 6-m Special Astrophysical Observatory telescope are presented. Large-scale velocity fields of the ionized gas in Hα and brightness distributions in continuum and Hα have been constructed for both galaxies with the help of a scanning Fabry Perot interferometer. Long-slit spectroscopy is used to study the stellar kinematics. Analysis of the data obtained has revealed a complex structure in each of the pair components. Three kinematic subsystems have been identified in UGC 5600: a stellar disk, an inner gas ring turned with respect to the disk through 80∘ , and an outer gas disk. The stellar and outer gas disks are noncoplanar. Possible scenarios for the formation of the observed multicomponent kinematic galactic structure are considered, including the case where the large-scale velocity field of the gas is represented by the kinematic model of a disk with a warp. The velocity field in the second galaxy of the pair, UGC 5609, is more regular. A joint analysis of the data on the photometric structure and the velocity field has shown that this is probably a late-type spiral galaxy whose shape is distorted by the gravitational interaction, possibly, with UGC 5600.
Key words: galaxies, groups of galaxies, interacting galaxies kinematics, structure.
1 Introduction
Polar-ring galaxies (PRGs) constitute a rare class of dynamically peculiar systems in which a ring or a disk of gas, dust, and stars rotates around the main body approximately in the polar plane (Whitmore et al. 1990). The formation of a polar ring is widely believed to be related to the interaction between galaxies or even to their mergers. Attempts to model such processes have been made in several works (see Reshetnikov and Sotnikova 1997; Bekki 1998; Bournaud and Combes 2003). Despite the progress in interpreting the morphology of the observed objects, PRGs, achieved in the above works, it should be recognized that there is most likely no single universal mechanism that would explain the polar-ring formation in each specific case. Therefore, it is appropriate to perform numerical simulations to reproduce the observed morphology and velocity field for each of the candidate PRGs.
Much observational data on PRGs have been accumulated to date, but many questions related to the polar-ring formation, stability, and age still remain debatable. New, more complete and accurate properties of the stellar population and the interstellar medium, and the star formation processes is needed to solve these and several other problems. Optical data on the motion of the gas and stars are usually obtained with long-slit spectrographs. The results of such observations are not always interpreted unambiguously, particularly in the case of complex multicomponent systems.
Analysis of the velocity fields gives much more information. The velocity fields are constructed mainly from observations of neutral hydrogen or molecular gas (mostly in CO lines) in the radio frequency range and from 2D or 3D spectroscopy in the optical range. 2D spectroscopy makes it possible to study the motions of the gas and stellar subsystems in galaxies in greatest detail and to obtain data on a qualitatively new level. However, such data for PRGs and similar objects are still very scarce. For example, the velocity fields for the best known PRGs, such as NGC 2685 (Shane 1980) and NGC 4650A (Arnaboldi et al. 1997), and some other objects were constructed from 21-cm observations, but the spatial resolution of these data is low. Until recently, the velocity fields in the optical range were obtained only for the central regions of two galaxies, NGC 2685 and IC 1689 (Sil’chenko 1998).
The catalog of PRGs byWhitmore et al. (1990) includes 157 galaxies and the existence of two roughly orthogonal kinematic systems (classical PRGs) has been confirmed observationally only for 15–20 of them. Obviously, the discovery of each new object and a detailed study of galaxies from Whitmore’s catalog, particularly by means of 2D spectroscopy, are of great interest.
In 2000, a program to investigate PRGs and related objects from the catalog of Whitmore et al. (1990) by means of 2D spectroscopy using a multipupil fiber spectrograph (MPFS) and a scanning Fabry Perot interferometer (FPI) of the 6-m Special Astrophysical Observatory (SAO) telescope was initiated at the Astronomical Institute of the St. Petersburg State University. One of the first interesting results of this program was the detection of a superwind from the galaxy NGC 6286 (Shalyapina et al. 2004a). At the same time, two almost perpendicular gas systems were found in the galaxy NGC 7468 (Shalyapina et al. 2004b) and the existence of an inner polar ring was assumed on the basis of a joint analysis of 2D spectroscopy and photometry. MPFS data on the stellar and gas kinematics in the central regions of candidates PRGs confirmed the existence of two almost orthogonal kinematic systems in the central region of the galaxy UGC 5600 (Shalyapina et al. 2002). Two stellar kinematic systems were discovered in the galaxy UGC 4892, which suggested the presence of a satellite (Hagen-Thorn et al. 2003). The velocity field in Hα for the galaxy NGC 2685 was constructed from FPI observations (Hagen-Thorn et al. 2005).
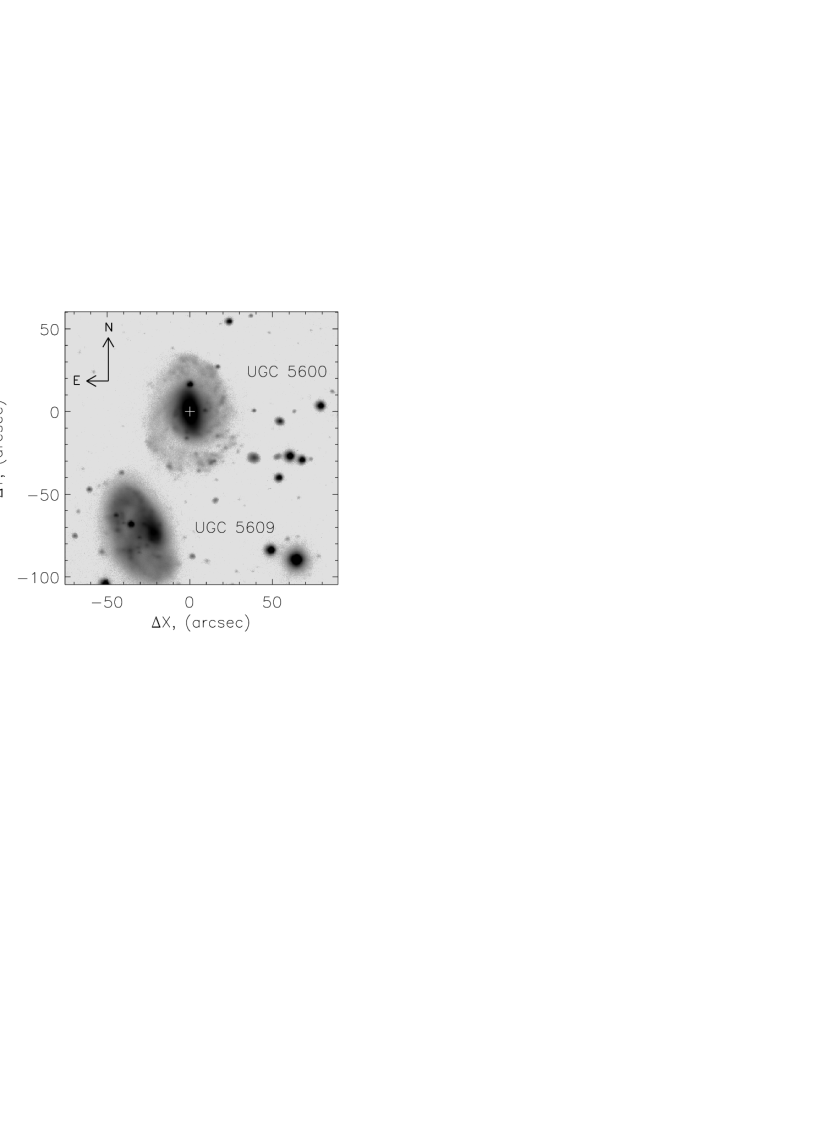
In this paper, we present FPI observational data and new results of long-slit spectroscopy for the isolated pair of galaxies VV 330 Vorontsov–Velyaminov 1959, 1977). An band image of this pair is shown in Fig. 1. The scale is 0.2 kpc per 1′′ if the distance to one of the components, UGC 5600, is assumed to be 44.6 Mpc at a galactocentric velocity Vgal = 2897 km/s and = 65 km/s/Mpc. Both galaxies have close line-of-sight velocities and the separation between them in the plane of the sky is 1′.4. One of the galaxies, UGC 5609, with a fairly complex structure, has not been studied in detail previously. The other galaxy, UGC 5600, is known as the most likely candidate for PRGs (Whitmore et al. 1990). Our previous study of the stellar and gas kinematics in the galaxy based on MPFS observations (16′′ 15′′ field) in the green and red spectral ranges and on long-slit spectroscopy in the red spectral range consisted largely in analyzing the velocity field of the central region in this object (Shalyapina et al. 2002). In this paper, we established that the galaxy has a complex kinematic structure: the stars rotate around the galaxy’s minor axis, while the gas, except for the central 3′′ region, rotates around its major axis. This led us to the conclusion about the existence of an inner polar ring. However, the picture of the gas motion in the outer regions remained unclear.
That is why the main objective at this stage of our study was to obtain information about the velocity field on the scales of the entire galaxy, including its outermost parts, to compare the new observational data with the results for the central region, and to bring all data to a unified picture. In connection with this formulation of the problem, the main emphasis was shifted to an investigation with FPI. The results of studying the stellar kinematics at a distance up to 18′′ from the center also turned out to be very useful at the final stage. Our more thorough and comprehensive investigation showed that UGC 5600 is not just the main galaxy with an inner polar ring, but is a more complex dynamical system and what was previously taken as the inner polar ring is one of the components of the overall complex structure. This issue is discussed in detail in Section ‘‘Kinematics of the Gas and Stars’’. Until then, we will use the term ‘‘inner ring’’ following Shalyapina et al. (2002).
2 Observations and data reduction
The spectroscopic observations of the galaxies UGC 5600/09 were performed at the prime focus of the 6-m SAO telescope with the SCORPIO focal reducer (Afanasiev and Moiseev 2005). A log of observations for this pair of galaxies is given in the Table 1, which also provides information about the -band image. Parameters of the focal reducer in interferometric observations are given in Moiseev (2002). Premonochromatization was made using a narrowband filter with = 20Å. The FPI spectral resolution was about 3Å (130 km/s). Since the (CCD TK1024) detector readout was performed in 2 2-pixel binning mode, a 512 512-pixel image at a scale of 0′′.56 per pixel was obtained in each spectral channel.
| Object | Instrument, | Exposure, | Field | Seeing | Spectral | Р.А. |
|---|---|---|---|---|---|---|
| date | sec | region, Å | ||||
| UGC5600/09 | IFP 05.03.2002 | 32180 | 5′5′ | 1.8′′ | Hα | |
| UGC5600/09 | SCORPIO 05.04.2002 | 540 | 6′6′ | 1.6′′ | R | |
| UGC5600 | Slit 23.02.2006 | 111200 | 1′′6′ | 3.0′′ | 3900–5700 | 0∘ |
| UGC5609 | Slit 21.02.2006 | 4900 | 1′′6′ | 1.5′′ | 3900–5700 | 57∘ |
The interferometric observations were reduced with software developed at SAO (Moiseev 2002). After the primary procedures (the subtraction of night-sky lines and the reduction to the wavelength scale), the observational data constitute ‘‘data cubes’’ in which each point in a 512 512-pixel field contain a 32-channel spectrum. Optimal data filtering, a Gaussian smoothing in spectral coordinate with equal to 1.5 channels and a 2D Gaussian smoothing in spatial coordinates with = 2 pixels, was performed using the ADHOC software package.333The ADHOC software package was developed by J. Boulesteix (Marseilles Observatory) and is freely available on the Internet. Gaussian fitting of the Hα emission line profiles was used to construct the velocity fields and monochromatic images. The measurement errors of the line-of-sight velocities for lines with symmetric profiles were 10 km/s. We also constructed an image in continuum near Hα .
We used the method of inclined rings (Begeman 1989; Moiseev and Mustsevoi 2000) to analyze the velocity field. This method allows us to determine the positions of the dynamical center and the dynamical axis, to refine the inclination of the galaxy to the plane of the sky, and to construct the rotation curve. Analysis of the dependence of the position angle of the dynamical axis and the inclination on radius provides information about the gas motion in the galaxy. The MPFS data obtained previously by Shalyapina et al. (2002) were used to convert the Hα fluxes to the absolute energy scale.
The slit-spectrograph observations were carried out with the same SCORPIO instrument in February 2006. The slit length and width are about 6′ and 1′′, respectively, the scale along the slit is 0′′.36 per pixel, and the spectral resolution is 5–6Å. The spectral range contained the , [OIII] 4959, 5007 Å emission lines and absorption lines of the old stellar population: MgI 5175Å, FeI + Ca 5270Å, and others. The detector was a 2048 2048-pixel EEV 42–40 CCD array. The data obtained were reduced using standard procedures of the ESO-MIDAS package. After the primary reduction, we performed a smoothing along the slit with a rectangular window 3 pixel in height to increase the signal-to-noise ratio. The line-of- sight velocities of the gas were measured from the positions of the centers of the Gaussians fitted to the emission lines. The accuracy of these measurements was estimated from the night-sky [OI] 5577Å line to be 10–15 km/s. A cross-correlation method (Tonry and Davis 1979) was used to determine the line-of-sight velocity and the velocity dispersion from absorption lines. As the line-of-sight velocity standards, we took the spectra of F8–K3 stars on the same nights as the galaxy’s spectra.
3 The morphology of UGC 5600/09
According to the Lyon–Meudon Extragalactic Database (LEDA), the morphological types of the galaxies UGC 5609 and UGC 5600 are Sbc and S0?, respectively. Based on a detailed photometric study of UGC 5600 in the , , color bands, Karataeva et al. (2001) suggested that the galaxy could be most likely classified as a late-type (Scd) spiral. The presence of such different estimates of the galaxy type ia most probably explained by the fact that UGC 5600 is a multicomponent object in which, as will be demonstrated here, several kinematic subsystems are clearly identified.
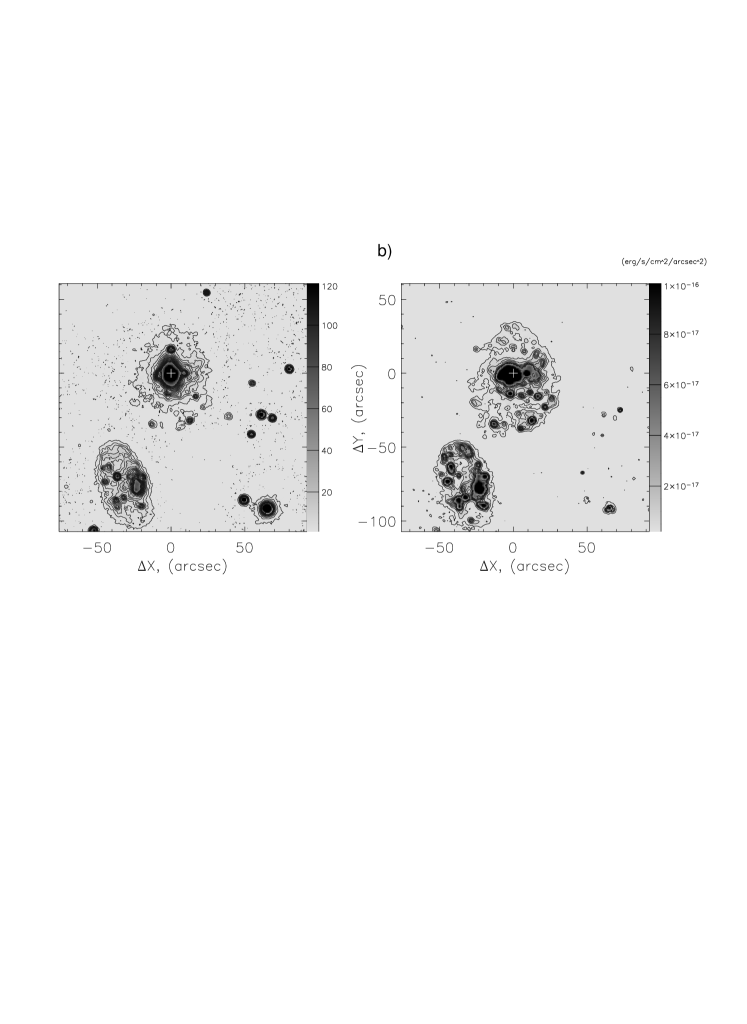
Figure 2 shows the continuum (near Hα ) and Hα brightness distributions for the binary system VV 330. Note that both galaxies are rich in gas and the Hα emission is traceable in them up to the outermost continuum isophotes. Along with diffuse Hα emission, both galaxies exhibit numerous bright knotes that are probably star-forming regions. The central region of UGC 5600 is distinguished by a particularly intense emission. Let us consider in more detail the brightness distribution for each galaxy.
UGC 5600. Comparison of Fig. 1 with Figs. 2a and 2b shows that the continuum and Hα brightness distributions are different, particulary in the central region. The main body of the galaxy, which is an inclined disk whose major axis has a size of 30′′ (6 kpc) and a position angle of 180∘ , is identified in continuum. In the disk, the isophotes are nearly elliptical in shape with small twists n the southern side. Protrusions are noticeable on the isophotes in the E–W direction almost perpendicular to the major axis of the galaxy’s main body at a distance of 12′′ from the center. It is this photometric feature that Whitmore et al. (1990)
called the inner ring. The main body of the galaxy is surrounded by an extended outer round envelope with a clumpier structure on the side facing the companion. Such features in the brightness distribution were also pointed out by Karataeva et al. (2001); they also pointed to a decrease in flattening for isophotes fainter than 23.5m/arcsec2 in the band and to a turn of the major axis of the ellipses fitted to these isophotes through 10∘ to the west. These authors also considered the photometric profiles of the galaxy’s main body whose shape does not show the presence of a noticeable bulge, while the brightness distribution along the major axis in the range from 3′′ to 18′′ is well represented by an exponential disk with the following parameters: = 19.7m/arcsec2 and = 5′′ (1 kpc).
The Hα image clearly shows an elongation of the isophotes in the E–W direction in the central part of the galaxy. The existence of this preferential direction seems to be not accidental and to be related to the previously noted feature of the continuum isophotes (the ‘‘inner ring’’). The details of the structure of the central region are better represented in the MPFS data and were described by Shalyapina et al. (2002). Previously, we already noted that the luminous gas is traceable roughly to the same boundaries as the outer continuum isophote, but the structure of the outer gas disk is more complex and contains numerous knots of different brightness and sizes. Particularly bright knots with sizes up to 5′′ (1 kpc) are located in the southern part of the galaxy, with some of them forming chains. These are most likely stellar complexes or giant HII regions. The Hα flux in the central region of the galaxy (r 15′′ (3 kpc)) is 2.5 10-13 erg/s/cm2 and the total flux within the 10-18erg/s/cm2/arcsec2 isophote is 3.8 10-13 erg/s/cm2. The lower limit for the star formation rate (without absorption) obtained using a relation from Kennicutt (1998) for the central region of UGC 5600 is 0.4 /yr and SFR = 0.7 /yr for the entire galaxy.
Whitmore et al. (1990) suggested that the faint outer envelope in UGC 5600 is a ring. A more detailed study of this outer structure (Karataeva et al. 2001) showed that this may be not a ring but two spiral arms wounding counterclockwise around the galaxy’s main body. To test this suggestion, we used a spirality criterion based on the expansion of the surface brightness distribution into a Fourier series of the azimuth angle in the galactic plane followed by analysis of the shape of the lines of the maxima of individual Fourier harmonics (Moiseev et al. 2004). For our analysis, we used a deeper (approximately by 0.5m/arcsec2) -band image that we obtained with SCORPIO (Fig. 1) than that in Karataeva et al. (2001). The amplitude of the second harmonic turned out to be largest; a two-armed structure is satisfactorily fitted to the observed brightness distribution at the following parameters: the position angle (PA) of the outer structure 160∘ and the inclination () of the disk plane to the plane of the sky 25∘ . Similar values of PA and for the outer isophotes in the band were obtained by Karataeva et al. (2001).
UGC 5609. The continuum and -band images of the galaxy (Fig. 2a and Fig. 1) show a faint, nearly elliptical disk with a major axis a = 62′′ (12.4 kpc), a position angle PA = 20∘ , and an axial ratio of 0.5. A slight increase in brightness is observed in the outer part of the disk and we get the impression that a faint envelope with a more blurred inner edge is present. No rise in brightness is noticeable near the geometrical center of the isophotes. Only at a distance of 8′′ to NE is a bright compact feature with nearly spherical isophotes distinguished. Another prominent feature that stands out against an amorphous disk is located to the west of the center. This is a fairly bright extended region elongated in the N–S direction. It has no clear boundaries and its approximate size is 10′′ 15′′ (2–3 kpc). Since the structure of this region is complex, the isophotes in it are highly irregular in shape.
The infrared image of the galaxy in the bands (2MASS) differs sharply from the previously described continuum image. Instead of the amorphous disk, only two bright regions coincident with the features noted in continuum are seen in all three bands. According to our estimates of the 2MASS data (we used the calibration from Jarrett et al. 2000), the magnitude of the bright compact feature is 12m and its color index 0m.9. Its spectrum turned out to be typical of a late-type M1–M3? star with a radial velocity of about –50 km/s. Thus, this is a Galactic foreground star that is projected onto the disk of UGC 5609 by chance. The surface brightness of the second, more extended region ranges from 18m/arcsec2 at the center to 20m/arcsec2 on the periphery. The emission in the bands is produced mainly by an old stellar population, which is usually grouped in galaxies symmetrically about the dynamical center. Therefore, we assume that this extended region is probably the main body of the galaxy. This conclusion is also confirmed by the analysis of the kinematics performed below.
The ring envelope, the absence of a bright center, and the bright knot on one side of the ring all resemble classical collisional ring galaxies, for example, II Zw 28 (Appleton and Marston 1997). However, if we examine in more detail the images of this galaxy in different color bands (e.g., Fig. 1 and the blue image from SDSS), then we can notice that UGC 5609 more likely resembles a spiral galaxy whose structure is distorted by tidal interaction, especially in the blue band. The bright knot is the main body of the galaxy from which an arc-shaped spiral arm or tidal tail goes away to the north. The second arm goes to the east and then turns south at a distance of about 10′′ from the geometrical center, forming the SE part of the luminous envelope.
The Hα image of the galaxy (Fig. 2b) also has a roughly elliptical shape but with a more blurred outer edge than that in continuum. Numerous knots of various sizes and brightnesses, which are probably HII regions, are superimposed on the faint underlying galaxy along the arc-shaped structures mentioned above. A considerable number of bright knots is also observed in the main body of the galaxy; the Hα flux from it is 3 10-14 erg/s/cm2. At the same time, the total flux within the 10-18 erg/s/cm2/arcsec2 isophote is 1.3 10-13 erg/s/cm2.
4 Kinematics of the gas and stars
UGC 5600. Figures 3b and 3c show the large-scale line-of-sight velocity field for the galaxy obtained in Hα with FPI and the velocity dispersion map. The distribution of the lines of equal velocity (isovels) shows regular deviations from the normal pattern of rotation of a flat galactic disk. A kinematic subsystem rotating around the galaxy’s major axis, whose existence was established from MPFS observations (Shalyapina et al. 2002), is clearly identified in the region of the inner ring. For the convenience of analyzing the total velocity field of the galaxy, Figs. 3d and 3e present the MPFS velocity fields for the inner ring and the central region obtained from stars and ionized gas. As we see from the figures, the MPFS and FPI velocity fields in Hα are in good agreement. In particular, the run of the isovels in the nuclear region (r 2′′) in both Fig. 3b and Figs. 3a and 3e coincides with the direction of stellar rotation (Fig. 3d).
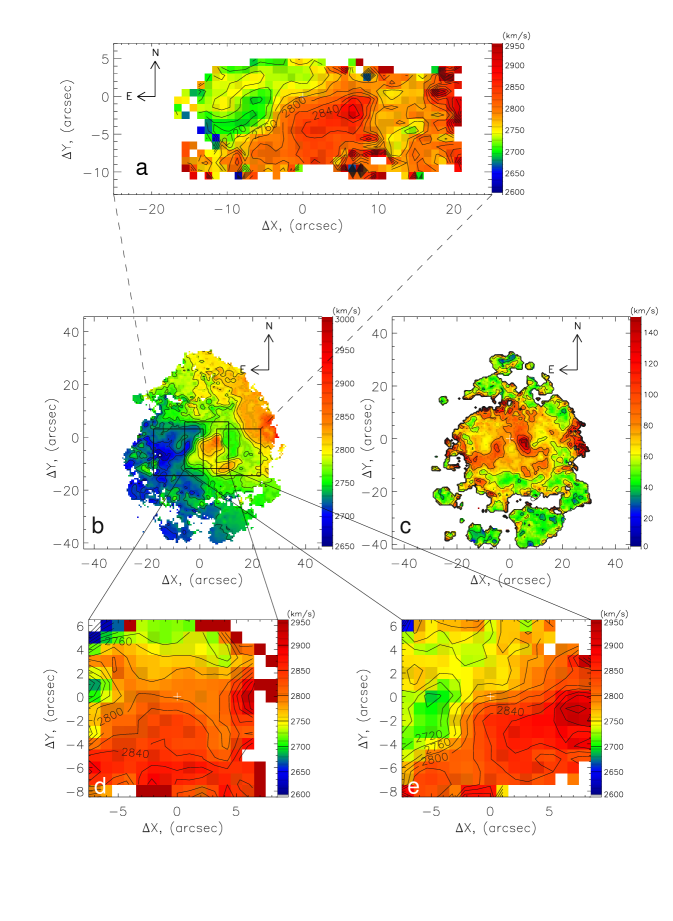
Previously (Shalyapina et al. 2002), we noted that the system velocities found from the stars and gas differ. However, our new long-slit observations to be discussed below did not confirm the differences. Therefore, we once again thoroughly analyzed the line-of-sight velocities of the stellar component determined from MPFS data and concluded that they should be increased by 30 km/s. Figure 3c shows the corrected velocity field for the stellar component; the system velocity is Vsys = 2770 10 km/s, which is equal, within the error limits, to the system velocity determined from emission lines. The velocity field of the stellar component clearly points to rotation around the galaxy’s minor axis; the northern side approaches us, while the southern side recedes from us. Previously (Shalyapina et al. 2002), we estimated the position angle (PAdyn = 182∘ ). It turned out to coincide with the position of the photometric axis of the galaxy’s main body (Karataeva et al. 2001). Analysis of the total velocity field for the gas component (Fig. 3b) shows that the gas in the outer parts rotates around an axis inclined with respect to the rotation axis of the stellar disk (for a more detailed discussion, see below). Moreover, the rotation has such a direction that the gas in the NW part of the outer envelope recedes from us, while the gas in its SE part approaches us.

Since the gas observations on the scales of the entire galaxy revealed a more complex structure than that followed from the observations of the central region, the following question arose. How the stars behave at distances from the center larger than those measured with MPFS? It is with this goal that we performed the long-slit (PA = 0∘ ) observations in the green spectral range. Figure 4b presents the line-of- sight velocity curve for the stars; for comparison, two sections of the velocity fields for the stellar (MPFS) and gas (FPI) components are also shown here. As we see from the figure, the long-slit and 2D spectroscopic data are in close agreement, within the error limits, and the pattern of stellar motion is retained in regions farther from the center. At the same time, there is a significant contrast in the stellar and gas kinematics at distances 10′′ r 20′′ from the center. The line-of-sight velocities of the gas obtained from both permitted Hα lines (FPI) and forbidden lines (long slit, Fig. 4a) are in good agreement. Figure 4c presents the rotation curve for the stellar component; the theoretical rotation curve of a thin exponential disk with a scale factor hdisk = 1.2 kpc is indicated here by the dashed line. This value is close to that obtained by Karataeva et al. (2001) from -band photometric data. The mass of the galaxy within a radius r 2.4 kpc is estimated to be 1010 M⊙.
Our analysis of the large-scale line-of-sight velocity field by the method of inclined rings has shown the following. In the region 3′′ r 10′′, the behavior of the isovels corresponds to the gas rotation around the major axis of the stellar disk. In the outer parts at r 20′′, the dynamical axis of the gas is along the NW–SE line. Thus, it occupies an intermediate position between the dynamical axes of the stellar disk and the inner gas ring. This suggests that there are two kinematically decoupled gas subsystems: an inner ring and an outer disk. The centers of these subsystems coincide, within the error limits. In the region 10′′ r 20′′, the structure of the line-of- sight velocity field is very complex and it cannot be reliably represented by a model of circular motion. Note that the photometric data reveal a sharp decline in brightness, a change in isophotal flattening, and a turn of the major axis of the ellipses fitted to the isophotes in this region.
Therefore, we constructed two separate models of circular motion for the inner subsystem (3′′ r 10′′) and the outer disk (20′′ r 40′′). As we have already noted above, the system velocity in both models is the same and equal to 2770 5 km/s. For the inner ring, we obtained the following dynamical parameters: 60∘ 10∘ and PA 260∘ 10∘ . As in our previous paper (Shalyapina et al. 2002), the angle between the planes of the inner gas ring and the stellar disk was found to be 80∘ 10∘ or 65∘ 10∘ . On the periphery 20′′ r 40′′, the model of gas motion has the following parameters: PA 303∘ 7∘ and = 30∘ 10∘ . The angle between the planes of the stellar disk and the outer gas disk is estimated to be 70∘ 10∘ and 40∘ 10∘ .
Below, we make several remarks on the velocity dispersion distribution for clouds of ionized gas. As we see from Fig. 3c, the maximum dispersion is observed in the nuclear region (more than 100 km/s). As we recede from the center, the dispersion decreases and is 50 km/s in the outer parts. In the region of the inner ring, the dispersion varies between 50 and 100 km/s, but the structure of its distribution is highly nonuniform and clumpy. It should be noted that there exists a problem of accurately measuring the velocity dispersion if its value is smaller than the FWHM of the FPI instrumental profile, = 130 km/s, which corresponds to a dispersion 55 km/s. Estimations of the stellar velocity dispersion along the galaxy’s major axis showed that it is lower than the velocity dispersion of the ionized gas at the center ( 50 km/s) and increases to 80 km/s at a distance of 10′′ from the center.
UGC 5609. Figure 5a presents the line-of-sight velocity field constructed from FPI data in Hα . At first glance, it appears regular and similar to the rotation of the gas disk around the minor axis. A detailed analysis of the field showed that its structure is more complex; numerous twists that can be caused by various factors are noticeable on the isovels. First, the structure of UGC 5609 is probably severely distorted either by tidal interaction or by galaxy collision. Second, the measurement errors of the line-of-sight velocities depend on the brightness level, while the brightness distribution in Hα is highly nonuniform. Therefore, the behavior of the isovels is related to different errors. Third, to the NE of the geometrical center of the isophotes at a distance of 8′′, the distortions in the velocity distribution are produced by the absorption component (from a foreground star) in the red Hα wing. Since the line-of-sight velocity range for this galaxy is small, these factors will affect the shape of the isovels.
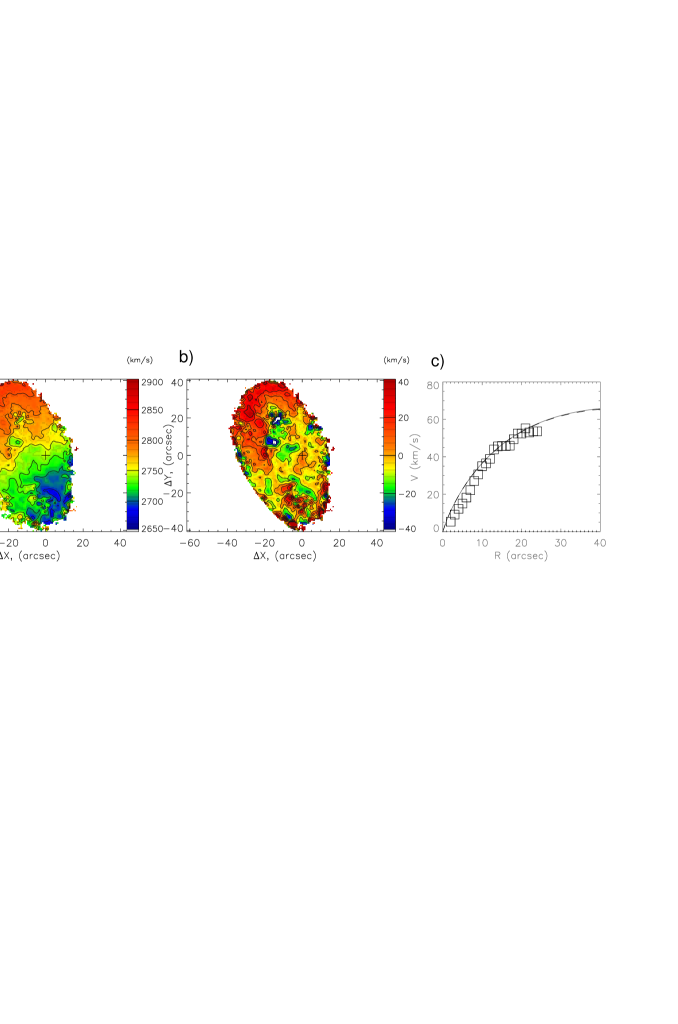
As we noted above, on the one hand, UGC 5609 is similar to collisional ring galaxies and, on the other hand, this can be a spiral galaxy whose structure is distorted by gravitational interaction. Our analysis of the velocity field for this galaxy was also performed by the method of inclined rings, but we constructed different models: both with allowance made only for the circular velocity vector component and with the assumption of nonzero radial velocities (expansion of the outer ring structure). As the dynamical center, we took either the center of the western knot, which we believe to be the galaxy’s main body, or the geometrical center of the ellipses fitted to the isophotes. Next, we constructed the model velocity fields and compared them with the observed field. Note that the residual velocities for most models are low, 10–20 km/s. Since the velocity is almost constant in the central region along the minor axis of the ellipses, the system velocity is determined unambiguously and its value is 2740 5 km/s; the inclination does not depend on the model either, = 55∘ . If the dynamical center coincides with the geometrical center of the ellipses, then the maximum positive residual velocities are observed in the region of the main body. Near the geometrical center (r 10′′), the residual velocities are opposite in sign and do not exceed 10–15 km/s, but a strong depression is noticeable in the initial segment (r 15′′) of the rotation curve. The same picture is observed in the models with a nonzero ring expansion velocity. The residual velocity reaches +20 km/s on the periphery of the galaxy in the northern and southeastern parts of the ring. Thus, we find no evidence for the existence of an expanding envelope (ring) at the level of the measurement errors.
If the dynamical center is displaced by about 10′′ to the west to the center of the main body, then the entire velocity field is satisfactorily described by the model of circular motion. Figure 5b presents the residual velocity map. The rotation curve can be represented by an exponential disk (Fig. 5c) with = 4 kpc; in this case, a small change in the position of the dynamical axis from 15∘ to 30∘ is observed and the residual velocities in the region of the northern spiral reaches their maximum value of +30 km/s. If this is assumed to be a tidal structure, then it can be warped with respect to the plane of the galactic disk. The total mass of the galaxy is estimated to be 1.6 1010 M⊙.
5 Discussion
Previously, we have already mentioned that the candidate PRGs from the list by Whitmore et al. (1990) are the objects of our study. However, as we see from the previous section, no classical polar ring is observed in the galaxy UGC 5600, as, for example, in the classical PRGs NGC 4650A, NGC 2685, and IC 1689. In this case, we most likely encounter the phenomenon of what was called kinematically decoupled components in the literature (see Bertola and Corsini 1999). The phenomenon of counterrotation in several galaxies (Rubin 1994; Galletta 1996), the circumnuclear polar rings (Sil’chenko et al. 1997; Corsini et al. 2002), and the classical polar rings (Whitmore et al. 1990) also fall under this name. Despite the differences in photometric structure and the kinematic peculiarities, all of them are probably united by the origin: they are the result of (occasionally multiple) galaxy mergers or mass accretion onto the galaxy from other galaxies. Let us consider the possible scenarios that unite the observed peculiarities of VV 330.
Since the observed picture for UGC 5600 is very complex, let us summarize the main observational facts before passing to a discussion.
(1) The main body is a stellar disk with a diameter of 6 kpc, PAdyn 182∘ , and 50∘ (Shalyapina et al. 2002). The presence of an ionized gas rotating in the same way as the stars was established in the central region (r 3′′).
(2) The inner gas ring rotating in a plane close to the polar plane of the stellar disk has PAdyn 260∘ and 60∘ . The pattern of kinematics in the region of the inner gas ring is complicated by the fact that we possibly see the total emission from the ionized gas that belongs to the ring and the galactic disk, but we cannot separate them because the instrumental profile has a large FWHM.
(3) The outer gas disk or ring of low surface brightness is traceable at distances approximately from 4 to 8 kpc from the galactic center. For this component, PAdyn 303∘ and 30∘ . Thus, the outer gas disk rotates in a plane that is appreciably inclined (either by 70∘ to by 40∘ ) to the plane of the galaxy’s main body.
Taking into account the facts listed above, we considered the following cases.
It can be assumed that UGC 5600 is the projection of two galaxies: one is a gas-poor polar-ring galaxy seen at a large angle to the plane of the sky and the other is a gas-rich late spiral. Since the centers of all the observed structures coincide, within the error limits, and since the system velocities of the stellar and gas components are close, this case seems unlikely, although it cannot be ruled out completely.
The next explanation for the observed features of UGC 5600 is the merger of two galaxies; different scenarios are possible in this case. For example, the existence of stellar and outer gas disks rotating in different planes can result from the merger of two (late and earlier-type) galaxies that produced the above independent kinematic subsystems. The picture is complicated by the presence of an inner ring. To explain this feature, we can attempt to use a mechanism suggested by Friedli and Benz (1993) that is related to the presence of a bar in the galaxy. However, no signatures of an extended bar were found in the velocity field and the photometric structure for UGC 5600. Recurrent mergers can serve as an alternative explanation.
In the last case that we will consider, a warped polar ring is assumed to be present in UGC 5600. One of the formation mechanisms for such rings is mass accretion from a gas-rich galaxy onto a neighboring galaxy. A warped polar ring or disk is formed around the latter as a result of mass transfer (Bournaud and Combes 2003). The second component of the pair, UGC 5609, may be considered as the donor galaxy. Let us assume that the entire gas in UGC 5600 constitutes a single system and that the turn of the dynamical axis from the central regions to the periphery is related to the warp of the gas disk. In this case, the observed features of the velocity field can be the result of projection effects. To test this hypothesis, we constructed a model of a warped ring. We used the density distribution in a thin exponential disk whose rotation curve is shown in Fig. 4c. We assumed that PAdyn and changed linearly from the inner edge of the ring to its outer edge. As the first approximation, at the ring edges, we took the angles obtained by analyzing the velocity field by the method of inclined rings (see the previous section) for the inner ring and the outer gas component. We calculated the velocities in the ellipses at given position of the dynamical axis and inclination. The boundary values of the angles were then varied to achieve
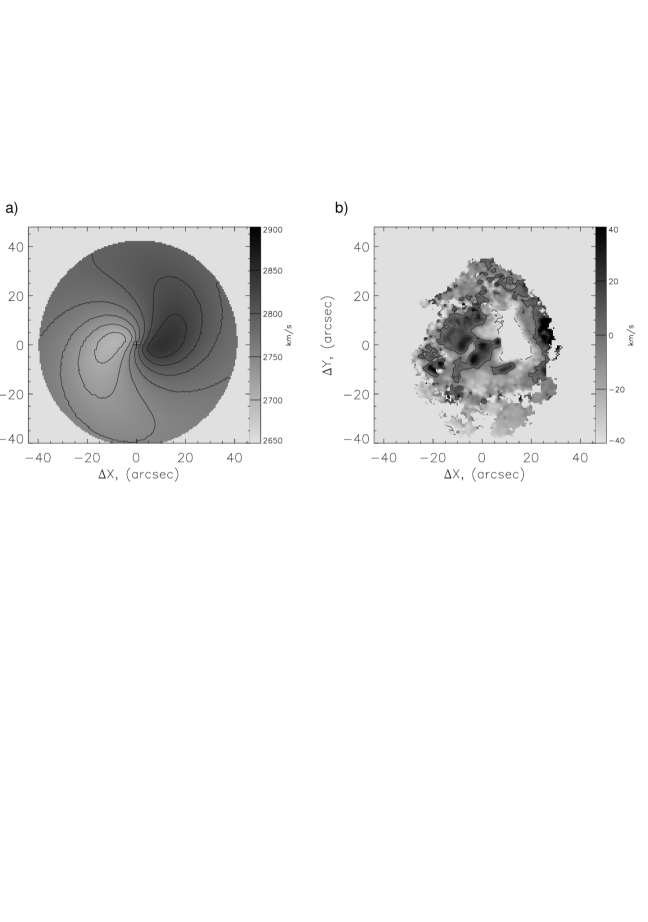
the best agreement with the observed velocity field. The model velocity field shown in Fig. 6a was constructed at the following parameters: PAdyn = 240∘ and = 45∘ for the inner boundary; PAdyn = 300∘ and = 30∘ for the outer boundary. The angle between the normals to the surface at the inner and outer boundaries is 10∘ . As we see from the residual velocity map (Fig. 6b), the model velocity field describes satisfactorily the observed one, except the region at distances of 10′′ – 15′′ from the center to the west. The feature in the velocity field is also observed at this location.
At this stage of our study, we do not have sufficient information to choose between the suggested scenarios.
In conclusion, let us discuss the data obtained for UGC 5609. Based on the continuum and Hα images of the galaxy and on their comparison with the image in the blue band, we made the following assumptions: this is either a collisional galaxy or a spiral galaxy whose shape was distorted by the gravitational interaction, possibly, with UGC 5600. Our analysis of the velocity field revealed no expanding envelope. Based on the entire data set, we concluded that UGC 5609 is most likely a late-type spiral galaxy with two arcshaped spiral arms; as a result, the illusion of an envelope is created. One of the arms may be a tidal tail. The high brightness of this feature in Hα , the band, and the blue range and its low brightness in continuum near Hα suggest that this arm consists mainly of gas and blue stars, which cannot be said about the second arm; the latter is much brighter in continuum. In addition, our analysis of the velocity field revealed that it is warped with respect to the galactic plane.
As yet no bridges and bars between the galaxies of the pair have been detected, but the presence of a tidal tail in UGC 5609 and the distortions of the structure on the southern side of UGC 5600 may be indicative of the gravitational interaction between the galaxies. We hope to reach ultimate conclusions about the nature of VV 330 after numerical simulations of all the possible cases considered above.
6 Acknowledgements
We are grateful to the Commission on the Subject of Large Telescopes for allocating observational time on the 6-m telescope. We also wish to thank A.V. Moiseev (SAO RAS) for help with the observations on the 6-m telescope and the FPI data reduction, for the provided data analysis codes, and for valuable remarks in preparing the text of the paper. This work was supported by the Russian Foundation for Basic Research (project no. 05-02-17548) and the Ministry of Russian Education (RNP.2.1.1.2852).
References
1. V. L. Afanasiev and A. V. Moiseev, Pis’ma Astron. Zh. 31, 214 (2005) [Astron. Lett. 31, 194 (2005)].
2. P. N. Appleton and A. P.Marston, Astron. J. 113, 201 (1997).
3. M. Arnaboldi, T. Oosterloo, F. Combes, et al., Astron. Astrophys. 113, 585 (1997).
4. K. G. Begeman, Astron. Astrophys. 223, 47 (1989).
5. K. Bekki, Astrophys. J. 499, 635 (1998).
6. P. Bertola and E. M. Corsini, Galaxy Interactions at Low and High Redshift, Ed. by J. Barnes and D. B. Sanders (Kluwer, Dordrecht, 1999), p. 149.
7. F. Bournaud and F. Combes, Astron. Astrophys. 401, 817 (2003).
8. E. M. Corsini, A. Pizzella, and F. Bertola, Astron. Astrophys. 382, 488 (2002).
9. V. A.Hagen-Thorn, L. V. Shalyapina, G.M. Karataeva, et al., Astron. Lett. 29, 133 (2003).
10. V. A.Hagen-Thorn, L. V. Shalyapina, G.M. Karataeva, et al., Pis’ma Astron. Zh. 82, 1071 (2005) [Astron. Rep. 49, 958 (2005)].
11. G. Galletta, Astron. Soc. Pac. Conf. Ser. 91, 429 (1996).
12. D. Friedli and W. Benz, Astron. Astrophys. 268, 65 (1993).
13. T. H. Jarrett, T. Chester, and R. Cutri, Astron. J. 119, 2498 (2000).
14. G. M. Karataeva, V. A. Yakovleva, V. A. Gagen-Torn, et al., Pis’ma Astron. Zh. 27, 94 (2001) [Astron. Lett. 27, 74 (2001)].
15. R. Kennicutt, Ann. Rev. Astron. Astrophys. 36, 189 (1998).
16. A. V. Moiseev, Bull. SAO 54, 74 (2002).
17. A. V. Moiseev and V. V. Mustsevoi , Pis’ma Astron. Zh. 26, 190 (2000) [Astron. Lett. 26, 565 (2000)].
18. A. V. Moiseev, J. R. Valdes, and V. H. Chavushyan, Astron. Astrophys. 421, 433 (2004).
19. V. Reshetnikov and N. Sotnikova, Astron. Astrophys. 325, 933 (1997).
20. V. Rubin, Astron. J. 108, 45 (1994).
21. L. V. Shalyapina, A. V. Moiseev, and V. A. Yakovleva, Pis’ma Astron. Zh. 28, 505 (2002) [Astron. Lett. 28, 443 (2002)].
22. L.V. Shalyapina, A.V.Moiseev,V.A. Yakovleva, et al., Pis’ma Astron. Zh. 30, 3 (2004a) [Astron. Lett. 30, 1 (2004a)].
23. L. V. Shalyapina, A. V. Moiseev, V. A. Yakovleva, et al., Pis’ma Astron. Zh. 30, 643 (2004b) [Astron. Lett. 30, 583 (2004b)].
24. W.W. Shane, Astron. Astrophys. 82, 314 (1980).
25. O. K. Sil’chenko, Astron. Astrophys. 330, 412 (1998).
26. O. K. Sil’chenko, V. V. Vlasyuk, and A.N. Burenkov, Astron. Astrophys. 326, 941 (1997).
27. J. Tonry and M. Davis, Astron. Astrophys. 84, 1511 (1979).
28. B. A. Vorontsov-Velyaminov, Atlas and Catalogue of 356 Interacting Galaxies (Mosk. Gos. Univ, Moscow, 1959) [in Russian].
29. B. A. Vorontsov-Velyaminov, Astron. Astrophys., Suppl. Ser. 28, 1 (1977).
30. B. C. Whitmore, R. A. Lucas, D. B. McElroy, et al., Astron. J. 100, 1489 (1990).
Translated by V. Astakhov