The nature of the intranight variability of radio-quiet quasars
Abstract
We select a sample of 10 radio-quiet quasars with confirmed intranight optical variability and with available X-ray data. We compare the variability properties and the broad band spectral constraints to the predictions of intranight variability by three models: (i) irradiation of an accretion disk by a variable X-ray flux (ii) an accretion disk instability (iii) the presence of a weak blazar component. We concluded that the third model, e.g. the blazar component model, is the most promising if we adopt a cannonball model for the jet variable emission. In this case, the probability of detecting the intranight variability is within 20-80%, depending on the ratio of the disk to the jet optical luminosity. Variable X-ray irradiation mechanism is also possible but only under additional requirement: either the source should have a very narrow H line or occasional extremely strong flares should appear at very large disk radii.
keywords:
accretion, accretion disc – black hole physics, instabilities – galaxies:active, quasars1 Introduction
Active galactic nuclei (AGN) are variable on all timescales and in all energy bands. This variability can be used to improve understanding of the accretion process onto a massive central black hole that powers the nuclear activity, because due to the very short timescales we can probe the conditions very close to the center. The variability mechanisms can be tested using the properties of the X-ray emission, as well as by the analysis of the optical data.
The most puzzling variations are those happening on the shortest timescales, of a fraction of a day. Variations in flux of a few tenth of magnitude in time scale tens of minutes to tens of hours (less than a day) are often known as microvariability or intranight variability or intraday variability (Wagner & Witzel 1995). The fast intraday variability was first discovered in the X-ray band (Mushotzky, Holt & Serlemitsos 1978) and with improvement of X-ray detectors were found to be a typical property of radio-quiet AGN (e.g. McHardy & Czerny 1987; Lawrence et al. 1987; Uttley, McHardy & Papadakis 2002; McHardy et al. 2004), although the level of variability strongly depends on the black hole mass (Markowitz & Edelson 2004). A fast intraday variability in the radio band was later discovered in radio-loud objects (Witzel et al. 1986; Heeschen et al. 1987), and now it is considered to be a common phenomenon in such objects at centimeter wavelengths (e.g. Lovell et al. 2003, Kraus et al. 2003). Later similar fast variations were found in the optical band, also in radio-loud objects, (Miller, Carini & Goodrich 1989; Heidt & Wagner 1996; Gupta et al. 2008; and references therein); in that case it is more appropriate to call it intranight variability. Finally, extensive optical observational campaigns of radio-quiet objects shown an occasional presence of intranight variability (Gopal-Krishna et al. 2000, 2003; Stalin et al. 2004, 2005; Gupta & Joshi 2005).
Intraday variability observed in radio-loud objects in low frequency radio observations is either caused by the interstellar scintillation, as supported by the intra-hour variability (Kedziora-Chudczer et al. 1996; see also Kedziora-Chudczer 2006; Raiteri et al. 2006) or it is intrinsic and related to jet instabilities, as indicated by a match of its amplitude to the longer trends for 3C 279 (Kartaltepe & Balonek 2007). Actually, both effects may be at work in the radio-loud sources. The nature of the observed intranight variability of radio-quiet objects is unknown.
The variability mechanisms in the radio-loud objects are widely believed to be connected to the conditions in the jet. However, it is still unclear, if in the radio-quiet objects the nature of intranight variability (INV) is different, or whether the faint, variable jet is here a dominant INV component as well.
In the present paper we consider three possible mechanisms for an intranight optical variability of radio-quiet quasars: reprocessing of the variable X-ray emission by an accretion disk, intrinsic variability of the accretion disk, and the presence of a weak blazar component. To better distinguish between these three scenarios, we make an attempt to correlate the optical and X-ray information. We confront the model predictions with the observational data for a selected sample of 10 objects.
In Section 2, we summarize the optical and X-ray data. In Section 3, we describe our three models. In Section 4, we give the results and in Section 5, we discuss and conclude.
2 Data
| Source | RA(2000.0) | DEC(2000.0) | z | R | V | 0.1-2.4 keV | |||
| PG 0026+129 | 00 29 13.7 | 13 16 05 | 0.142 | 1.08 | 15.41 | 9.37 | 2.31 (ROSAT) | 1.30 | |
| MKN 1014 | 01 59 50.1 | 00 23 41 | 0.163 | 2.12 | 15.69 | 4.03 | 2.82 (ROSAT) | 1.52 | |
| PG 1116+215 | 11 19 08.7 | 21 19 18 | 0.177 | 0.72 | 14.73 | 12.00 | 2.62 (ROSAT) | 1.43 | |
| 1750+507 | 17 51 16.7 | 50 45 39 | 0.3 | 5.01 | 15.40 | 11.73 | 3.03 (ROSAT) | 1.47 | |
| AKN 120 | 05 16 11.4 | 00 08 59 | 0.032 | 1.03 | 14.10 | 3.63 | 2.46 (XMM) | 1.44 | |
| Q 1252+020 | 12 55 19.7 | 01 44 12 | 0.342 | 0.52 | 15.48 | 5.95 | - | 1.29 | |
| upper limits | flux at 1 keV | ||||||||
| 0824+098 | 08 27 40.1 | 09 42 10 | 2.928 | - | 18.3 | ||||
| PG 0832+251 | 08 35 35.9 | 24 59 41 | 0.331 | 1.26 | 16.1 | ||||
| PG 0043+039 | 00 45 47.2 | 04 10 24 | 0.385 | - | 16.0 (B) |
1 columns denote source name, RA (2000.0), DEC (2000.0), redshift, radio loudness parameter, visual magnitude, X-ray flux in 1.e-14 ergs/s/cm2 from Yuan et al. 1998, soft X-ray slope and broad-band optical/X-ray slope; 2 (0.5 - 2 keV) from Risaliti et al (2003); 3 from Vaughan et al (2004), in 1.e-11 erg/s/cm2 (2-10 keV) , with .
Our aim is to confront the intranight variability models and the observational data taking into account the broad band spectral constraints. We focus on X-ray and optical bands because in many models they are strongly related. Therefore, we collect a sample of radio-quiet quasars with a confirmed intranight variability in the optical band that were also observed in the X-ray band.
2.1 Optical Data
A sample of 117 objects with reliable studies of intranight variability has been compiled by Carini et al. (2007). Since Seyfert galaxies are strongly contaminated by the starlight, we removed from the sample all sources with . The remaining sample of 96 objects contains 22 sources with detected intranight variability (for the remaining monitored 74 sources intranight variability was not detected). We supplement this sample with 1 source with detected intranight variability from Stalin et al. (2005) that is missing in Carini et al. (2007) compilation. We removed PKS 1103-006 and B2 1225+317 since they are definitively radio-loud objects (R=260 based on NED).
2.2 X-rays
There have been no systematic X-ray studies of the sources with the observed intranight optical variability. We searched available published data and X-ray data archives to obtain the X-ray information for the variable sources. Note that we only consider X-ray properties that are non-simultaneous with the optical data and have no information on correlation between the optical and X-ray variability for these sources. While it is important to understand the overall variability considering simultaneously both optical and X-ray bands at this time we can only discuss model constraints based on the currently available information. Systematic studies are needed in the future to describe the characteristics of the X-ray variability, for example is the source amplitude vary together with the spectral slope, or the slope remains constant.
ROSAT PSPC X-ray data for 24 sources from the entire Carini et al. (2007) sample (5 variable and 19 non-variable) were published by Yuan et al. (1998). We supplement these X-ray data with observations from Chandra X-ray Observatory (1422+424; Risaliti et al. 2003) and XMM-Newton (Ark 120, Vaughan et al. 2004), and with the constraints for 3 more objects (PG0043+039, 0824+098 and 1422+424) derived from the X-ray archival data (see Appendix).
A summary of the X-ray properties for intranight variable radio-quiet sources is presented in Table 1. The soft X-ray flux has been measured for 7 sources detected by ROSAT, while 3 other sources have only upper limits calculated from the archival data.
The ROSAT PSPC slopes were measured for 4 of the variable sources, and the average slope of these four sources () is steeper than the average slope in the non-variable sources in this sample (), but the dispersion in both cases is very large. This is very interesting since the radio-loud quasars have on average flatter (lower photon index) soft X-ray slopes than the radio-quiet quasars (e.g. composites of Laor et al. 1997; SDSS by Richards et al 2006). The median values of the soft X-ray slope for all the objects in the sample is . This is smaller than the average slope based on just the four ROSAT slopes.
2.3 Sample of variable sources
Our sample of sources with a confirmed optical microvariability and with available X-ray constraints contains 10 objects. Their overall properties are given in Table LABEL:tab:xrays.
We determine the broad band spectral index for these sources, , measured between 2500 Å and 2 keV (see e.g. Shen et al. 2006). We assume the optical slope, , of 0.5 (in convention) to obtain the 2500 Å flux from the measured V magnitude and we use a measured photon index and a flux in the X-ray band. The calculated for each source are shown in Table 1. For the sources with the upper limit to the X-ray flux we calculate a lower limit on .
The median value of is 1.47 which is rather large (see e.g. Bechtold et al. 2003), in contrast to the recent studies of large quasar samples (Shen et al. 2006) indicating that objects with microvariability are X-ray over-luminous for their optical flux by a factor 2, taking into account that our objects are not extremely optically bright (steeper slopes are expected for brighter objects, see e.g. Vasudevan & Fabian 2007). On the other hand, 18 non-variable sources from Carini et al. (2007) sample with ROSAT X-ray data available show similarly large of 1.51.
The kinematic width of the broad emission lines is known indicator of black hole mass. But what is more, the equivalent width of H line may indicate on the presence of an additional spectral component. Therefore, for objects contained in SDSS data base111http://www.sdss.org we estimate both the equivalent width of the H line, without the decomposition into a narrow and a broad component, as well as the kinematical width (FWHM). The results are given in Table 2.
The FWHM was used to determine the black hole mass, following closely the approach given by Vestergard & Peterson (2006). The obtained values range from to just above , somewhat smaller than average quasar mass of but well within the mass distribution shown by Vestergaard et al. (2008). We also estimated the bolometric luminosities of the sources assuming . The Eddington ratio for these objects is about 0.7 (adopting erg s-1). It seems surprisingly uniform but we cannot draw too strong conclusion based on four objects.
We also determined the H line intensity since the low value of EW of the line serves as an indicator of the dilution of the underlying continuum. The measured equivalent widths are comparable with the typical values, like 62.4 Å (also a single line fits) in the Bright Quasar sample (Forster et al. 2001).
| source | EW(H) | FWHM(H) | |||
|---|---|---|---|---|---|
| Angstroem | km s-1 | erg s-1 cm-2 | |||
| MKN 1014 | 373 | 2230110 | 10.8 | 8.1 | 0.27 |
| 1422+424 | 824 | 3380140 | 54.7 | 8.8 | 0.28 |
| Q 1252+020 | 603 | 4100140 | 101.0 | 9.1 | 0.32 |
| PG 0832+251 | 744 | 3380 90 | 51.8 | 8.8 | 0.29 |
3 Models
We consider three plausible mechanisms of the microvariability in radio-quiet AGN. The first one is the X-ray irradiation of an accretion disk: all radio-quiet AGN are known to be strongly variable in X-ray band (e.g. Mushotzky, Done & Pounds 1993; Uttley, McHardy & Papadakis 2002; Markowitz & Edelson 2004) so the reprocessing of the variable X-ray flux is likely to lead to some optical variability, and the phenomenon is well known at longer timescales (Rokaki, Collin-Souffrin & Magnan 1993; Gaskell 2006). The second mechanism is the accretion disk instability suggested in the context of microvariability by Mangalam & Wiita (1993). The third mechanism, suggested by Stalin et al. (2005) is the presence of the weak blazar component even in radio-quiet objects; evidence for a jet in such objects was discussed by Blundell & Rawlings (2001), Barvainis et al. (2005) and Leipski et al. (2006).
For each of the mechanisms we formulate a numerical model which can be confronted with the observational constraints in the optical and X-ray band.
3.1 X-ray irradiation of an accretion disk
In this scenario we consider the strongly variable X-ray emission from a hot plasma above an accretion disk. This X-ray emission can be partially intercepted by the disk and thermalized, thus leading to the variable optical/UV emission.
3.1.1 lightcurves
The X-ray variability properties were studied in numerous papers (e.g. McHardy et al. 2004; Markowitz & Edelson 2004; for a recent review see for example Uttley 2007). In particular, the power spectrum density was obtained for several AGN, and the scaling of the variability with the mass and the luminosity was recently discussed by McHardy et al. (2006).
In order to create the representative X-ray lightcurve we thus use the popular Timmer & Koenig (1995) approach which allows to recover the lightcurve from the known power density spectrum.
For the purpose of the modelling we assume that the power spectrum of a representative AGN can be described by a power law with two breaks, although very detailed study performed for Akn 564 show that multiple Lorentzian representation is more accurate (McHardy et al. 2007). However, for our purpose the simple power law description is satisfactory. Therefore, we parameterize the power spectrum density with the high frequency break, , and low frequency break, , assuming the slope 0 below , slope 1 between and , and slope 2 above . The existence of the low frequency break is not well established in AGN (apart from the case of Akn 564, McHardy et al. 2007) but the analogy with galactic X-ray sources suggests it may be there; it is not essential for the current modelling since we aim here at modeling the short timescale phenomena. Here we simply assume that . The level of the power spectrum on diagram is fixed in all models at 0.01 in dimensionless units. The actual value is difficult to determine, since the slope of the flat part is not exactly zero, e.g. for Akn 564 the value rises towards longer frequencies reaching 0.02 at maximum (McHardy et al. 2006). However, adopting higher value right at the frequency break overpredicts the variability in 1 day timescale measured by Markowitz et al. (2003).
The positions of the breaks and the normalization of the high frequency tail of the PSD are certainly related to the mass and/or luminosity of the object (Hayashida et al. 1998; Czerny et al. 2001; McHardy et al. 2006; Gierliński et al. 2008; Liu & Zhang 2008). We parameterize the high frequency break using one of the two relations found by McHardy et al. (2006):
| (1) |
where is the black hole mass in units and is the bolometric luminosity in units of erg s-1, or directly from the line width of H line width
| (2) |
where is in km s-1. We use this parameterization of power spectrum density to generate X-ray lightcurves.
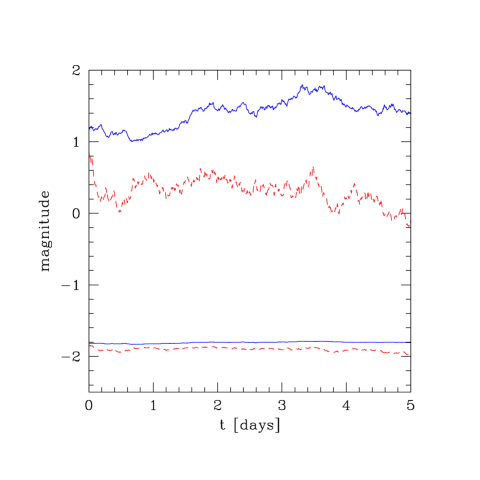
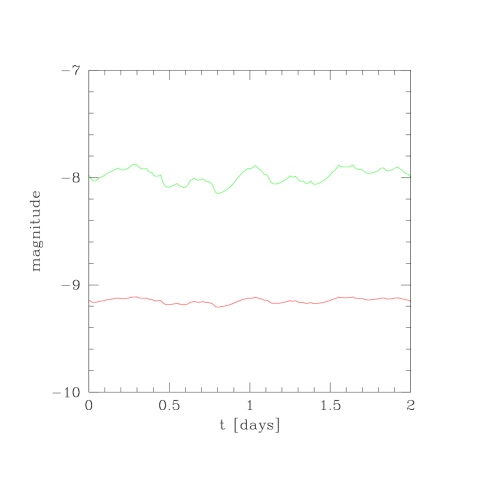
The optical variability in this scenario is caused by the reprocessing of the variable X-ray emission by the disk. We now assume that the X-ray variability is strongly localized, i.e. we neglect the smearing effect caused by the reprocessing which generally would lower the variability amplitude in the optical band. An exemplary set of X-ray and optical lightcurves is shown in Fig. 1. The incident flux is fully absorbed, i.e. we neglect the scattering effect (more accurate description should include albedo of order of 0.2 - 0.5, depending on the ionization of the disk surface). We also assume that many coronal flares coexist, and the energy dissipation in flares follows the radial profile of the energy dissipation in the disk. In such case we can assume that the contribution of the X-ray reprocessed radiation is wavelength-independent and the amplitude is determined by the time-dependent corona to disk luminosity ratio.
Disk lightcurve with the reprocessing effect shows fast variability. For each lightcurve, we calculate the probability that a fluctuation larger than 2 per cent is seen during the typical one night observation (5 hours), where the fluctuation during a single night, , is determined as in Stalin et al. (2005)
| (3) | |||||
where and are the observed magnitudes of an object, and and are the maximum and the minimum flux in the model. In the models we neglect the correction for the observational error.
3.1.2 broad band spectra models
Since the average X-ray luminosity to the optical (disk) luminosity is a free parameter of the model we construct the broad band spectrum which allows to convert the corona/disk luminosity ratio to the observational parameter .
We assume that the local disk emission is well approximated by a black body emission, and the total disk emission is given by an integral over the disk surface.
The spectral shape of the coronal emission is not determined within the frame of our model since we do not consider heating/cooling effects for electrons. Therefore, we simply assume that the coronal emission has the typical spectral slope of radio quiet quasars, i.e. energy index is 1.0 (i.e. photon index is equal 2.0).
3.2 Accretion disk instability
3.2.1 Radiation pressure instability
Optically thick accretion disks in AGN are radiation-pressure dominated, unless the accretion rate is extremely low. The viscous and thermal stability of such disks depend on the description of the viscosity. Standard parametrization of Shakura & Sunyaev (1973) of the viscous torque by the total pressure ( assumption) leads to disk instability (Pringle, Rees & Pacholczyk 1973; Lightman & Eardley 1974; Shakura & Sunyaev 1976) while the assumption that the total torque scales with the gas pressure ( assumption) leads to stable solutions (Coroniti 1981). The disk viscosity law determines the expected level of the disk intrinsic variability. Numerical computations of the disk models show violent periodic outburst with very large amplitudes, of a few orders of magnitude (Szuszkiewicz & Miller 1998; Li, Xue & Lu 2007). Such gigantic outbursts are not seen in the observational data for AGN or galactic sources. On the other hand, lower amplitude outbursts are seen in GRS 1915+105 (for a review of the source properties, see Fender & Belloni 2004 and Janiuk, Czerny & Siemiginowska 2002 for applications of the radiation pressure instability model). This means that a viscosity law intermediate between and is likely to represent well the disk behaviour. Various viscosity modifications were proposed in the past (e.g. Taam & Lin 1984; Szuszkiewicz 1990; Watarai & Mineshige 2003). Here we follow the recent work by Merloni & Nayakshin (2006) and we adopt the geometric mean law, i.e. .
Computations of the time-dependent disk evolution under the influence of radiation pressure instability were performed using the code of Janiuk & Czerny (2005) but with different viscosity law ( instead of ). Model predicts strong regular outbursts lasting thousands of years. In this case no X-ray emission is predicted by the model if the option for corona formation is switched off. Therefore, broad band constraints cannot be used for this model.
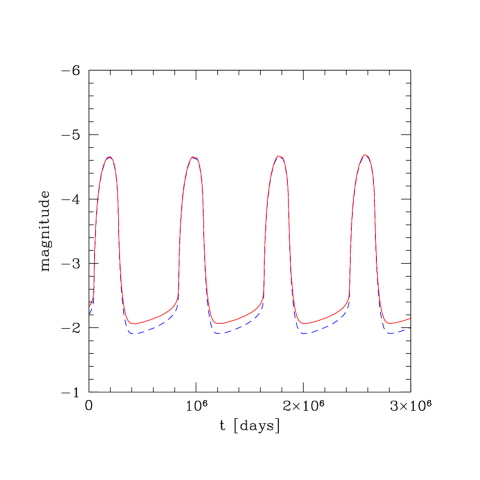
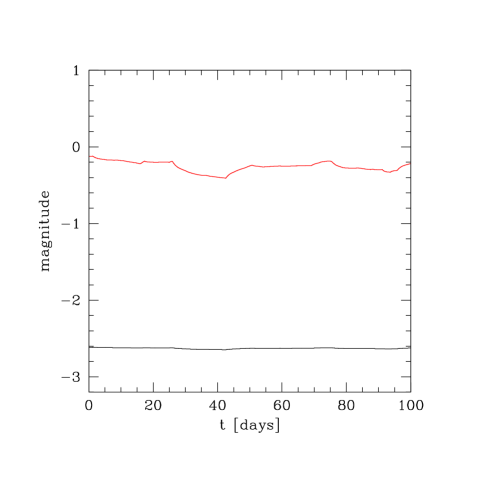
We can also include both the radiation pressure instability and the effect of the corona formation. In this case we use the same code, and we allow for the corona formation using the Markoff chain formalism (King et al. 2004; Mayer & Pringle 2006). The details of the computations are given in Janiuk & Czerny (2007). The basic outburst pattern does not change but an additional flickering due to X-ray irradiation appears. An exemplary lightcurve with the corona effect included is shown in Fig. 2.
3.2.2 Magnetorotational instability
Magnetorotational instability (MRI), rediscovered by Balbus & Hawley (1991) in the context of accretion disks is the most likely source of the disk viscosity. It roughly operates in the local dynamical timescale, as confirmed by 2-D and 3-D simulations (for a review, see Balbus & Hawley 1998).
Local development of the MRI can be roughly represented using the idea of the Markoff chain (e.g. King et al. 2004, Mayer & Pringle 2006, Janiuk & Czerny 2007). The local magnetic field, , is thus proportional to the random number , generated in the following way
| (4) |
where is the random number with uniform distribution, mean value 0 and variance equal 1, while is a constant describing the coupling in the system. King et al. (2004) assumed and we will do the same throughout the paper. The timestep is determined by the timescale of the magnetic field development which is equal to , where is the local Keplerian period and is a constant expected to be between 1 and 10. We will assume in order to create most favorable conditions for the INV. The local disk dissipation is thus proportional to .
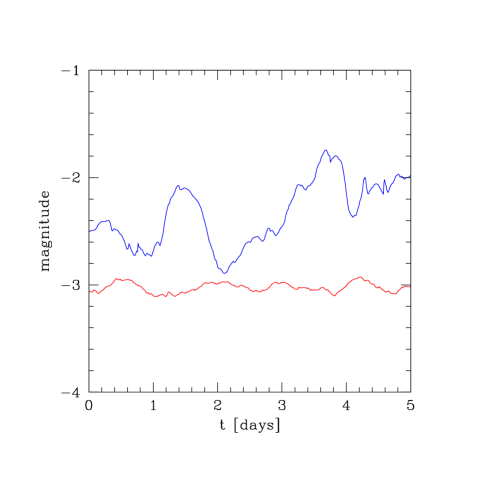
The strength of the variability is determined by the number of magnetic cells. Two examples of the lightcurves assuming the coexistence of 36 and 360 magnetic cells are shown in Fig. 3.
3.3 Blazar component
The division of AGN into radio-quiet and radio-loud is under discussion as the arguments appeared both in favor of clearly bimodal distribution or against it, with the possible intermittency confusing the picture, and the origin of the phenomenon in unclear although the spin paradigm is attractive (see e.g. Sikora et al. 2007).
The support for some form of radio activity in radio-quiet objects is strong. Radio jets are present in numerous Seyfert 2 galaxies (e.g. Pedlar et al. 1989; Falcke, Wilson & Simpson 1998), and a less extended radio emission is seen also in Seyfert 1 galaxies and Narrow Line Seyfert 1 galaxies (Ulvestad & Wilson 1989; Lal, Shastri & Gabuzda 2004; Doi et al. 2007). Some evidence of weak radio jets in a small number of RQQSOs has been reported from deep VLA imaging and related studies (Miller, Rawlings & Saunders 1993; Kellermann et al. 1994; Falcke et al. 1996a, 1996b). There have also been some attempts at VLBA imaging at milliarcsecond resolution of the central engines. In this case, out of 12 radio-quiet QSOs, 8 of these sources show strong evidence of a jet-producing central engine (Blundell & Beasley 1998). Deep VLBA imaging of 5 RQQSOs showed that only one source exhibits a two-sided radio jet and the other 4 are unresolved (Ulvestad, Antonucci & Barvainis 2005). Also, by radio monitoring with VLBA, relativistic jets were found in the RQQSO in case of the source PG 1407263 and in Seyfert 1 galaxy III Zw 2 (Blundell, Beasley & Bicknell 2003; Brunthaler et al. 2005). One object — 2MASX J0324+3410 — has all the properties of a standard Narrow Line Seyfert 1 galaxy and still it is strong in radio, with , the radio image shows a compact core and a well resolved one-sided jet, and radio emission is accompanied by a possible detection of TeV gamma ray emission (Zhou et al. 2007). It is possible that all X-ray power law emission may actually come from a jet. Such a possibility was discussed mostly within the frame of galactic accreting black holes (see e.g. Kylafis, Papadakis & Reig 2007). However, the question is open, and in particular, the correlation between the radio and the X-ray emission is by no means simple (see e.g. Xue & Cui 2007).
3.3.1 lightcurves
In the present paper we model the time dependence of the blazar component using the cannonball model of the variability implemented by Janiuk et al. (2006) to model gamma-ray bursts. However, the model can apply to all types of unstable jet-like outflow with a suitable choice of the parameters. The model is parametrized by the emission radius, , the Doppler parameter of the jet, , the jet opening, , the inclination of an observer, and the number of burst events per unit of time, . We fix at cm, which is generally appropriate for jet emission (e.g. Hartman et al. 2001; Kataoka et al. 2007), we take as representative for blazar jets. We fix at 0.2 radian, and at 0.6 radian as a representative example.
The most important parameter model affecting the overall level of the variability is per unit of time. We adjust this parameter describing the event rate to reproduce the variability properties of pure blazar optical lightcurve. Violent microvariability on blazars can reach up to mag in one hour if spurious variability detections are carefully avoided (Cellone, Romero & Araudo 2007), but such events are rare, and the variability is not always detected in a few hour observations. Therefore, in our model, we fix at such a value (10 000 events per year) which gives 50% probability of detecting variability at % (see eq. 3) in 3h observation when no stable contribution to the optical lightcurve is included. An exemplary lightcurve is shown in Fig. 4 where we show the pure blazar case as well as the case when the stable accretion disk contributes 80 % of the total optical emission.
3.3.2 broad band spectra models
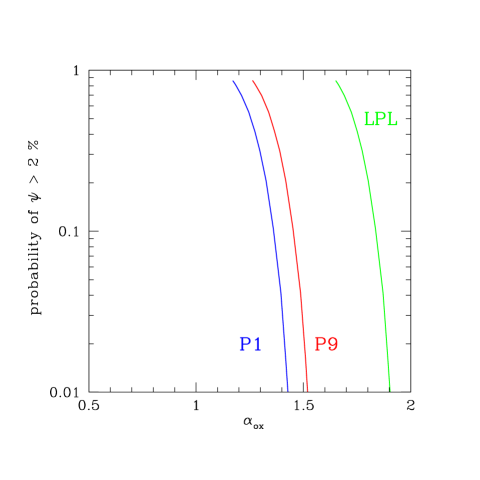
In order to model the average broad band spectrum we take two components: standard stationary accretion disk emitting locally as a black body, parametrized by the black hole mass and accretion rate, and the blazar component with an arbitrary normalization. Since the spectral shape of a blazar emission is well known to depend on the luminosity, creating a blazar sequence, we consider two extreme cases for the blazar shape. The first case is a high luminosity example. Specifically, we take two broad band spectra of the radio loud quasar 3C 279, states P1 and P9 from Hartman et al. (2001). For this blazar component alone, the parameter is 1.17 and 1.27, correspondingly. Any disk contribution will increase the expected . As a second example, we take a lower luminosity example of BL Lacs shown as LBL spectrum (BL Lac type spectrum with peak at Low frequencies) in a review by Becker et al. (2007). We do not consider HBL (i.e. BL Lac type spectrum with peak at High frequencies) since it is shifted too far into high energy band and shows TeV emission. The LBL blazar component alone is much steeper, with equal to 1.65.
4 Results
The three microvariability mechanisms implemented in a form of numerical models of the lightcurves allow us to estimate the probability to observe an intra-night variability of an AGN within the frame of the three scenarios.
4.1 X-ray irradiation of an accretion disk
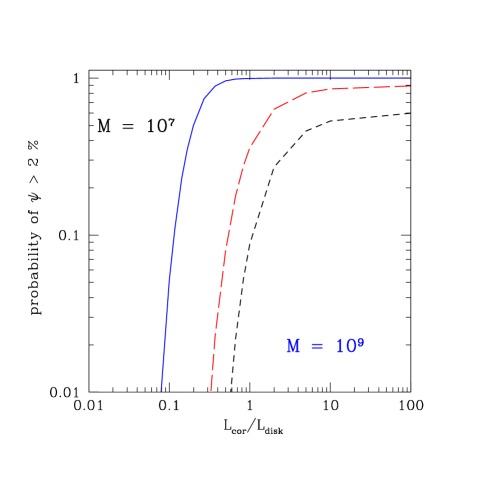
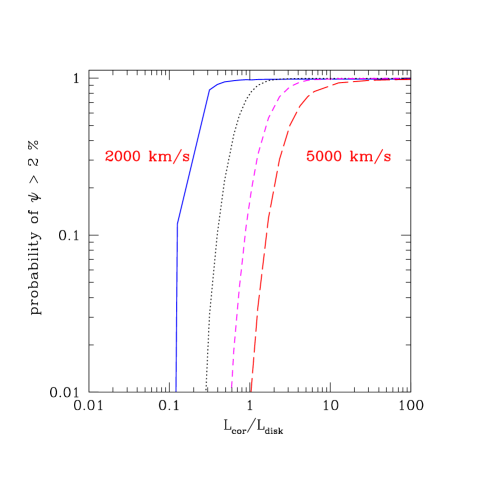
The predicted level of the optical variability strongly depends on the black hole mass and luminosity, as well as the X-ray coronal luminosity to the optical disk luminosity ratio, if the parameterization by Eq. 1 is used to derive the X-ray lightcurve. The exemplary results, for the Eddington ratio of , are shown in Fig. 5.
The model does not seem to account for the observed variability. The INV is unlikely to be seen if the black hole mass is or more unless the X-ray emission is strong.
The problem is that the X-ray variability timescales are too long, or equivalently, the X-ray variability amplitude at the required timescale is not high enough to give the visible effect, when the fraction of the energy dissipated in the corona is low. The high frequency breaks for the presented models are: Hz, Hz and Hz, correspondingly. Thus for higher mass objects amplitude variability is on the timescales of a week or longer. The smaller black hole mass () predicts significant INV (see Fig. 5) but such a mass is unlikely to be appropriate for quasars.
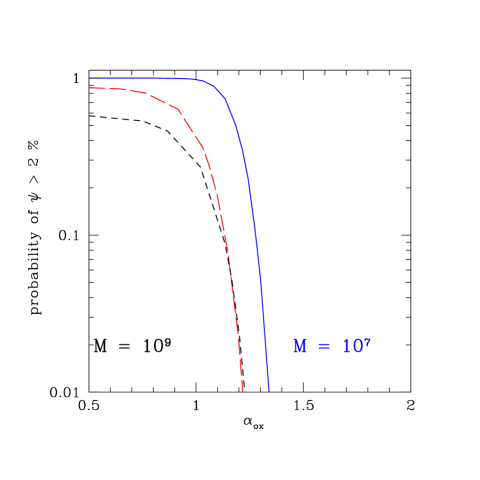
We cannot enhance the variability by introducing a stronger irradiation since a high fraction of the energy dissipated in the corona is not compatible with the broad band spectral slope. In Fig. 6 we show the predicted variability level as a function of . For larger black hole mass (), more appropriate for quasars, and steep spectra, the INV is always very low, and for the probability drops below .
In these considerations, however, we neglected the issue where in the disk the reprocessing occurs since we simply assumed that the typical dilution in the observed optical band is the same as the overall ratio of the disk to corona average emissivity.
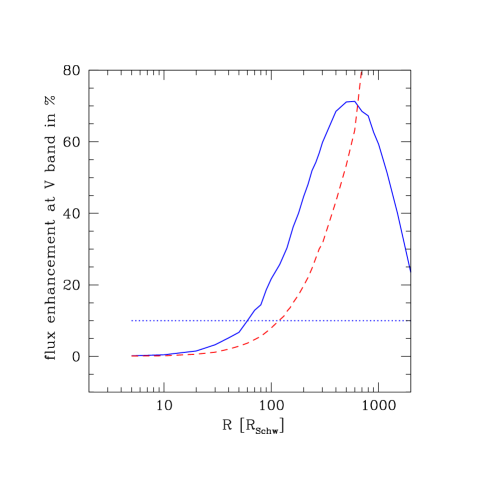
Since this effect is potentially important we separately consider the effect how the sudden irradiation by an X-ray flare changes the disk flux at a specific wavelength. As an extreme example, we choose a situation when only a single flare forms above an accretion disk. A flare contains a specified fraction of the total bolometric luminosity of the source (i.e. all the corona luminosity), it is located at a given radius, and the size of the hot spot beneath the flare (i.e. reprocessing area) is specified as a fixed fraction of the radius (physically, it is given by the flare height).
A specific example for a large mass black hole is shown in Fig. 7. The enhancement is less than the simple corona to disk ratio for radii smaller than but then it increases rapidly. This means that if extremely strong single flares are occasionally localized at the enhancement factor is almost 80 % in V band, so the local disk to corona ratio is is not 0.1, but 0.8! With such a small dilution, the probability to find an intraday variations is 5.2 % while on average the overall slope may be the same as for , i.e. 1.52, quite consistent with the data.
Therefore, if very strong flares are likely to appear at large disk radii, the X-ray irradiation may be the cause of the observed intranight variability.
If the X-ray lightcurve is generated using the Eq. 2, the chances to have the INV due to X-ray irradiation in our sample are higher. Although the formula 2 gives a relatively large value of the high frequency break, Hz, for the line width of 3000 km s-1, possibly representative for our sample, and in that case the INV is not expected. However, for objects with very narrow lines, like Mkn 1014, the irradiation scenario seems quite promising. In this case we have no direct relation to the broad band parameterization of the spectral shape.
4.2 Disk instability
4.2.1 Radiation pressure instability
We used the viscosity law instead of law of Shakura & Sunyaev (1973) with the aim to obtain lower amplitude and shorter outbursts. Indeed, this new prescription gives outbursts lasting by a factor of a few hundred shorter than the standard law. However, this is still far too long to model INV. The exemplary lightcurve shown in Fig. 2 was obtained for a black hole mass and a viscosity parameter . The outburst last thousands of years.
The computations performed without a corona did not show any short timescale additional thermal oscillations during the evolution, in agreement with previous computations (e.g. Merloni & Nayakshin 2006). Of course a fast variability reappears if the corona is included (e.g. Mayer & Pringle 2006, see also Fig. 9) but in this case the problem reduces to the variability model discussed in Sect. 4.1. For this specific model, the probability of the INV is below . Although there is some coupling in theoretical models between the presence or absence of an outburst and the coronal variability (through the change in the disk thickness; Mayer & Pringle 2006; Janiuk & Czerny 2007) it cannot modify the disk/corona system behaviour in a short timescale.
4.2.2 magnetorotational instability
The size of a magnetic cell is not known but there are natural contraints of its value. The cell should be smaller than the local thickness of the accretion disk, . It also should be high enough to account for the disk viscosity. Since the coefficient (Shakura & Sunyaev 1973) can be interpreted as a ratio of the turbulent velocity to the sound speed multiplied by the ratio of the cell size to the disk thickness, the minimum size of the cell is . The viscosity coefficient in quasars estimated from large amplitude variability is of order of 0.02 (Siemiginowska & Czerny 1989; Starling et al. 2004), consistent with numerical MHD simulations. Thus, at a single disk ring of the radius , and the radial width, , the number of cells is
| (5) |
The value is an adequate representation even of the high Eddington ratio objects (see e.g. Fig. 3 of Loska et al. 2004).
The total number of cells in the whole disk is large but not the whole disk participates in providing the luminosity at a given wavelength.
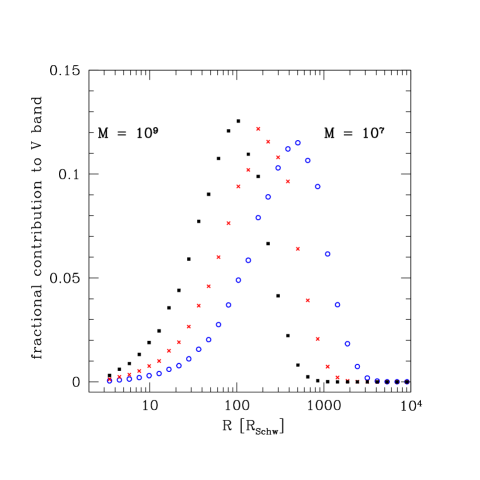
We constrain that by considering a standard stationary Shakura-Sunyaev disk for a given black hole mass and bolometric luminosity and we determine the fractional contribution of the disk emission to the V band as a function of radius, as shown in Fig. 10. We finally divide the disk into rings of the widths increasing with radius, we model each ring as described above taking the most favorable condition for microvariability, .
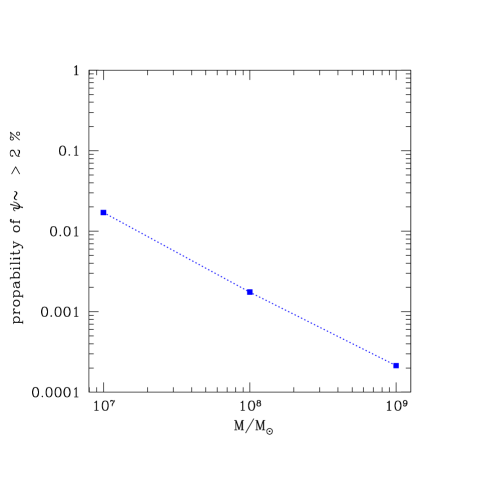
The results are shown in Fig. 11. The probability of the INV variability in more massive objects is very low. It is caused by the increase of the timescales with the black hole mass which is not quite compensated by the decrease in the radius contributing most strongly to the V band (100 for in comparison with 400 for , see Fig. 10).
4.3 Blazar component
The predicted probability of an INV depends on the disk contribution at the monitored wavelength. Since the model was adjusted to have 50% probability of the INV for a pure blazar component in 3 h observations, and our modeling of radio quiet sources assumes 5 h observations the probability of the INV starts at 84% for negligible disk and drops to moderate 20% when the disk to the blazar luminosity ratio reaches 2.7. This is interesting in the context of the equivalent width of H line. The observed equivalent width of H line in four sources from Table LABEL:tab:xrays is on average Å , comparable to the average of 62.4 Å in the whole quasar sample of (Forster et al. 2001). Therefore we do not seem to see a decrease of the line width due to the dilution by the blazar component. Therefore, the blazar contribution at H wavelength should be low.
The relation between the INV and the broad band spectral shape depends on the spectral shape of the blazar component. The results for the three specific cases of our choice are shown in Fig. 12 where we show the INV probability as a function of the disk contribution translated to the observed parameter . In all cases the predicted variability level was still significant if the approached 1.5 for the black hole mass . The range of slopes for each of the specific shapes was too narrow to reproduce the whole sample given in Table LABEL:tab:xrays but we cannot expect a single universal blazar spectral shape to work if even the same source vary in its spectral shape significantly. If the blazar spectral shape is allowed to vary from source to source, as it is the case in true blazars, the blazar component model has the flexibility enough to reproduce the sample properties. 10 - 20 % variability was obtained with the blazar component contribution of 10 - 8.5 % which is consistent with no significant influence on the h equivalent width.
5 Discussion
In the present paper we collected a sample of radio-quiet objects with confirmed microvariability in the optical band (i.e. intra-night variability) for which also X-ray data were available. As radio-quiet, we treated sources with the standard loudness parameter R 10. There were only 10 of such objects but even such a small sample allowed for an interesting analysis.
The broad band spectra of variable objects did not differ significantly from objects with no detection of variability: the median value of parameter was 1.47 in variable objects, and 1.52 in non-variable objects. Also derived values of equivalent width of H line did not differ significantly from the typical values in non-variable objects. However, it was measured only for four objects in our sample so at present we cannot claim this effect to be proven.
The main goal of our paper was to test three possible scenarios of the optical microvariability: (i) reprocessing of the variable X-ray emission (ii) accretion disk instability (iii) weak blazar component in radio-quiet sources. For these three scenarios we formulated specific models which allowed to obtain the lightcurves and to analyse the probability of the detection of microvariability in a single observation lasting 5 h.
The first scenario has difficulties to account for the variability which is rapid enough to show up in a form of intra-night erratic variations, without being in conflict with a broad band spectral shape. The result seems to be generic, as the typical rms value of the X-ray variability in 1 d timescale is 3% (Markowitz & Edelson 2004) for black hole masses of order of , and if X-ray flux is by a factor 10 lower than the optical disk emission, as typical in quasars, the optical amplitude of variations is below the detection threshold. A larger ratio of the X-ray flux to the optical disk emission is in turn inconsistent with broad band quasar spectra. However, for objects closer in their nature to Narrow Line Seyfert 1 this variability may be enhanced, and the lightcurves obtained assuming FWHM of H line 2000 km s-1 show INV pattern.
There is also another possibility of the variability enhancement, namely extremely bright single coronal flares, containing significant fraction of the bolometric luminosity but located at large disk radii also lead to large variability in the visual band. Such a flare heats up the previously cold disk surface to high temperatures and the extra flux appears right in the visual band. From the theoretical point of view, such flares are hardly expected, as the amount of energy available at large radii is small. On the other hand, such flares were occasionally reported and modeled in the context of X-ray reprocessing (e.g. Goosmann et al. 2004). In this case the smearing effect due to the light travel time must be considered, with the net effect depending additionally on the inclination of an observer.
The disk instabilities were studied taking into account two mechanisms. First we studied the radiation pressure instability. We used the viscosity prescription advocated as the most promising by Merloni & Nayakshin (2006) in comparison to the observed properties of the accreting black holes. This model, however, gives only long-lasting outbursts not suitable for microvariability since no short timescale thermal pulsations accompany this instability, if the X-ray coronal emission is neglected. If the coronal emission is modeled, the situation practically reduces to the previous scenario of variable X-ray irradiation. Therefore we next deviced a crude model of much faster, magneto-rotational instability. However, even in this case the variations are not fast enough to account for a rapid flux changes. Since the optical emission comes from the radius of or more, this is not surprising. More advanced simulations are consistent with our results. Local magneto-rotational instability coupled with radiation pressure instability is likely to lead to thermal erratic oscillations (Turner 2004) accompanied by a change in the local disk luminosity by a factor of a few but on the timescales of order of a few months for a object at 100 .
The third scenario is easily acceptable. Although we tested our blazar component model for a fixed values of parameters (i.e. viewing angle, number of events, Lorentz factor, emission radius, etc.), this set of parameters represents well the observed blazar emission. In case of the radio quiet versus radio loud objects, the modeled pulse profiles depend mainly on whether the viewing angle is smaller or larger than the jet opening angle, and not that much on its particular value. Therefore we conclude that our calculations are representative for a sample of objects, which of course may have various inclinations.
The blazar contribution required to explain the INV was about 20%, and it was not in conflict with the broad band spectra. The broad range of the within the sample can be reproduced only with a range of the shapes of the blazar component but the blazars themselves also show a broad range of spectra. Our result thus comes in line with the conclusion of Carini et al. (2007) that the probability of microvariability is a smoothly decreasing function of the radio loudness indicating that the same mechanism operates in blazars and in the radio-quiet sources.
Our result may support the view that even radio-quiet sources produce a beamed blazar-like emission but in radio-quiet objects this emission is weaker. On the other hand, longer timescale variations of the radio-quiet sources in the optical band are apparently of a different nature, mostly reprocessing (see e.g. Enya et al. 2002), and possibly also disk instabilities (e.g. Czerny et al. 1999).
Acknowledgments
We are grateful to the anonymous refreree who pressed us to have a better insight into the studied phenomenon. This research has made use of data obtained through the HEASARC Online Service, provided by NASA/Goddard Space Flight Center and of the data from the Sloan Digital Sky Survey (http://www.sdss.org). This work was supported in part by grant 1P03D00829 of the Polish State Committee for Scientific Research and the Polish Astroparticle Network 621/E-78/SN-0068/2007. Partial support for this work was provided by the National Aeronautics and Space Administration through Chandra Award Number GO5-6113X and under the contract NAS8-39073.
References
- (1) Balbus, S.A., Hawley, J.F., 1991, ApJ, 376, 214
- (2) Balbus, S.A., Hawley, J.F., 1998, RvMP, 70, 1
- (3) Barvainis, R., Lehar, J., Birkinshaw, M., Falcke, H., Blundell, K. M., 2005, ApJ, 618, 108
- (4) Bechtold J. et al., 2003, ApJ, 588, 119
- (5) Becker J.K., 2007, astro-ph/0710.1557
- (6) Blundell, K. M. & Beasley, A. J. 1998, MNRAS, 299, 165
- (7) Blundell, K. M., Beasley, A. J. & Bicknell, G. V. 2003, ApJ, 591, L103
- (8) Blundell, K. M., Rawlings S., 2001, ApJ, 562, L5
- (9) Brunthaler, A., Falcke, H., Bower, G. C. et al. 2005, A&A, 435, 497
- (10) Carini M.T., Noble J.C., Taylor R., Culler R., 2007, AJ, 133, 303
- (11) Cellone, S. A., Romero, G. E., Araudo, A. T., 2007, MNRAS, 374, 357
- (12) Coroniti F.V., 1981, ApJ, 244, 587
- (13) Czerny B., Nikołajuk M., Piasecki M., Kuraszkiewicz J., 2001, MNRAS, 325, 865
- (14) Czerny B., Schwarzenberg-Czerny A., Loska Z., 1999, MNRAS, 303, 148
- (15) Doi A. et al., 2007, arXiv:0704.3836
- (16) Enya, K. et al., 2002, ApJS, 141, 45
- (17) Falcke, H., Sherwood, W. & Patnaik, A. R. 1996a, ApJ, 471, 106
- (18) Falcke, H., Patnaik, A. R. & Sherwood, W. 1996b, ApJ, 473, L13
- (19) Falcke, H., Wilson, A. S., Simpson, C., 1998, ApJ, 508, 199
- (20) Fender R. P., Belloni T., 2004, ARA&A 42, 317
- (21) Forster K., Green P.J., Aldcroft T.L., Vestergaard M., Foltz C.B., Hewett P.C., 2001, ApJS, 134, 35
- (22) Gallagher, S. C., Brandt, W. N., Sambruna, R. M., Mathur, S., & Yamasaki, N. 1999, ApJ, 519, 549
- (23) Gaskell, C. M., 2006, in AGN Variability from X-Rays to Radio Waves ASP Conference Series, Vol. 360, Proceedings of the conference held 14-16 June, 2004 at the Crimean Astrophysical Observatory in Crimea, Ukraine. Edited by C. Martin Gaskell, Ian M. McHardy, Bradley M. Peterson and Sergey G. Sergeev. San Francisco: Astronomical Society of the Pacific, 2007., p.111
- (24) Gierliński M., Nikołajuk M., Czerny B., 2008, MNRAS, 383, 741
- (25) Goosmann, R.W., Czerny, B., Karas, V., Ponti, G., 2007, A&A, 466, 865
- (26) Gopal-Krishna et al. 2000, MNRAS, 314, 815
- (27) Gopal-Krishna, Stalin C.S., Sagar R., Wiita P.J., 2003, ApJ, 586, L25
- (28) Gupta, A. C., Joshi, U. C., 2005, A&A, 440, 855
- (29) Gupta, A. C., Fan, J. H., Bai, J. M., Wagner, S. J., 2008, AJ (accepted), arXiv:0108.1217
- (30) Hartman R.C. et al., 2001, ApJ, 558, 583
- (31) Hayashida N. et al., 1998, ApJ, 500, 642
- (32) Heeschen, D. S., Krichbaum, T. P., Schalinski, C. J., & Witzel, A. 1987, AJ, 94, 1493
- (33) Heidt, J., Wagner, S. J., 1996, A&A, 305, 42
- (34) Janiuk, A., Czerny, B., 2007, A&A, 466, 793
- (35) Janiuk, A., Czerny, B., 2005, MNRAS, 356, 205
- (36) Janiuk, A., Czerny, B., Moderski, R., Cline, D. B., Matthey, C., Otwinowski, S., 2006, MNRAS, 365, 874
- (37) Janiuk, A., Czerny, B., & Siemiginowska, A. 2002, ApJ, 576, 908
- (38) Kartaltepe, J.S., Balonek, T.J., 2007, AJ, 133, 2866
- (39) Kataoka J. et al., 2007, astro-ph/0709.1528
- (40) Kedziora-Chudczer, L., 2006, MNRAS, 369, 449
- (41) Kedziora-Chudczer L., Jauncey D., Wieringa M., Reynolds J., Tzioumis A., Nicholson G., 1996, Inst. Astron. Union Circ., 6418, 2
- (42) Kellermann, K. I., Sramek, R. A., Schmidt, M., et al. 1994, AJ, 108, 1163
- (43) King, A.R., Pringle, J.E., West, R.G., Livio, M., 2004, MN- RAS, 348, 111
- (44) Kraus, A. et al., 2003, A&A, 401, 161
- (45) Kylafis, N.D., Papadakis, I.E., Reig, P., 2007, astro-ph/0702710
- (46) Lal, D. V., Shastri, P., Gabuzda, D. C., 2004, A&A, 425, 99
- (47) Laor A., Fiore F., Elvis M., Wilkes B.J., McDowell J.C., 1997, ApJ, 477, 93
- (48) Lawrence A., Watson M.G., Pounds K.A., Elvis M., 1987, Nat., 325, 694
- (49) Leipski, C., Falcke, H., Bennert, N., H ttemeister, S., 2006, A&A, 455, 161
- (50) Li S.-L., Xue L., Lu J.-F., 2007, ApJ, 666, 368
- (51) Lightman A.P., Eardley D.M. 1974, ApJ, 187, L1
- (52) Liu Y., Zhang S.N., 2008, astro-ph/0801.2598
- (53) Loska, Z., Czerny, B., Szczerba, R., 2004, MNRAS, 355, 1080
- (54) Lovell, J. E. J., Jauncey, D. L., Bignall, H. E., et al. 2003, AJ, 26, 1699
- (55) Mangalam, A. V. & Wiita, P. J., 1993, ApJ, 406, 420
- (56) Markowitz A. et al. 2003, ApJ, 593, 96
- (57) Markowitz A., Edelson R., 2004, ApJ, 617, 939
- (58) Mayer, M., Pringle, J.E., 2006, MNRAS, 368, 379
- (59) McHardy, I.M., Czerny, B., 1987, Nat., 325, 696
- (60) McHardy, I.M., Koerding, E., Knigge, C., Uttley, P., Fender, R. P., 2006, Nature, 444, 730
- (61) McHardy, I.M., Papadakis, I.E., Uttley, P., Page, M., Ma son, K.O., 2004, MNRAS, 348, 783
- (62) McHardy, I.M., Ar valo, P., Uttley, P., Papadakis, I.E., Summons, D.P., Brinkmann, W., Page, M.J., 2007, MNRAS, 382, 985
- (63) Miller, H. R., Carini, M. T. & Goodrich, B. D., 1989, Nature, 337, 627
- (64) Miller, P., Rawlings, S. & Saunders, R. 1993, MNRAS, 263, 425
- (65) Merloni A., Nayakshin S., 2006, MNRAS, 372, 728
- (66) Mukai, K. 1993, Legacy 3, 21-31.
- (67) Mushotzky, R. F., Done, C., Pounds, K. A., 1993, ARA&A, 31, 717
- (68) Mushotzky, R. F., Holt S.S., Serlemitsos P.J., 1978, ApJ, 225, L115
- (69) Pedlar, A. et al., 1989, MNRAS, 23, 863
- (70) Pringle J.E., Rees M.J., Pacholczyk A.G. 1973, A.&A., 29, 17
- (71) Raiteri, C.M. et al., 2006, A&A, 459, 731
- (72) Richards G.T. et al., 2006, ApJS, 166, 470
- (73) Risaliti, G., Elvis, M., Gilli, R., & Salvati, M. 2003, ApJL, 587, L9
- (74) Rokaki, E., Collin-Souffrin, S., Magnan, C., 1993, A&A, 272, 8
- (75) Shakura N.I., Sunyaev R.A., 1973, A&A, 24, 337
- (76) Shakura N.I., Sunyaev R.A., 1976, MNRAS, 175, 613
- (77) Shemmer, O. et al., 2005, ApJ, 630, 729
- (78) Shen S., White S.D.M., Voges W., Kauffmann G., Tremonti C., Anderson S.F., 2006, MNRAS, 369, 1639
- (79) Siemiginowska, A., & Czerny, B. 1989, MNRAS, 239, 289
- (80) Sikora M., Stawarz Ł., Lasota J.-P., 2007, ApJ, 658, 815
- (81) Stalin C.S. et al., 2004, MNRAS, 350, 175
- (82) Stalin C.S. et al., 2005, MNRAS, 356, 607
- (83) Starling, R. L. C., Siemiginowska, A., Uttley, P., & Soria, R. 2004, MNRAS, 347, 67
- (84) Szuszkiewicz, E., 1990, MNRAS, 244, 377
- (85) Szuszkiewicz E., Miller J., 1998, MNRAS, 298, 888
- (86) Taam R. E., Lin D. N. C., 1984, ApJ, 287, 761
- (87) Timmer J., Koenig, M., 1995, A&A, 300, 707
- (88) Turner N.J., 2004, ApJ, 605, L45
- (89) Ulvestad, J. S., Wilson, A. S., 1989, ApJ, 343, 659
- (90) Ulvestad, J. S., Antonucci, R. R. J. & Barvainis, R. 2005, ApJ, 621, 123
- (91) Uttley, P., 2007, ASP Conference Series, 373, 149
- (92) Uttley, P., McHardy, I.M., Papadakis, I.E., 2002, MNRAS, 332, 231
- (93) Vasudevan R.V., Fabian A.C., 2007, MNRAS, 381, 1235
- (94) Vaughan S., Fabian A.C., Ballantyne D.R., De Rosa A., Piro L., Matt G., 2004, MNRAS, 351, 193
- (95) Vestergaard M., Peterson B.M., 2006, ApJ, 641, 689
- (96) Vestergaard, M., Fan, X., Tremonti, C. A., Osmer, P. S., Richards, G. T., 2008, astro-ph/0801.0243
- (97) Wagner, S. J., Witzel, A., 1995, ARA&A, 33, 163
- (98) Watarai, K., Mineshige, S., 2003, ApJ, 596, 421
- (99) Witzel, A., Heeschen, D. S., Schalinski, C. J., & Krich baum, T. P. 1986, Mitt. Astron. Ges., 65, 239
- (100) Xue, Y., Cui, W., 2007, A&A, 466, 1053
- (101) Yuan W., Brinkman W., Siebert J., Voges W., 1998, A&A, 330, 108
- (102) Zhou, H., et al., 2007, ApJ, 658, L13
5.1 Appendix: Archival X-ray data
PG0043+039
A broad absorption line (BAL) quasar PG0043+039 (z=0.385) was not detected in the ASCA pointed observation on Dec.21 1996. Gallagher et al. (1999) give a 3 upper limit of erg s-1 cm-2 for 2-20 keV flux obtained for the adopted photon index . BAL quasars are known to have a weak X-ray emission due to an intrinsic absorption and the ASCA non-detection gives a typical lower limit to the absorber’s column density of cm-2.
The quasar was also undetected in the 30 ksec XMM-Newton observation on June 15, 2005. We extracted the data from the XMM-Newton archive and processed using the SAS version 7.0.0. We determined an upper limit for the count rate at the position of the source to be 0.001 cts/sec in 0.3-8 keV energy band. This corresponds to the 3 upper limit for the flux density at 1 keV of erg s-1 cm-2 keV-1, for the assumed photon index and Galactic absorption cm-2. Non-detection in XMM-Newton observation at this flux level indicate a column density large than .
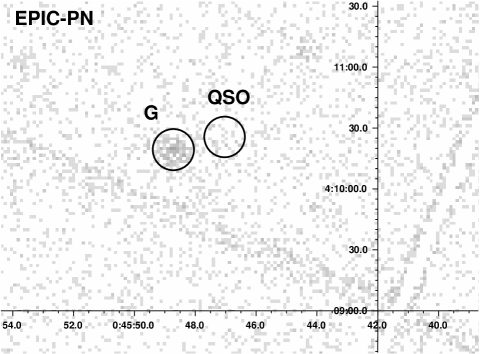
Figure 13 shows the XMM-Newton field of view of EPIC/PN with the location of the quasar and a nearby galaxy marked on the image. The quasar was not detected.
PG0832+251
The quasar PG0832+251 (z=0.331) was in the field of view during one of the ROSAT PSPC observations in May 1992. The exposure time was 2792 sec. We obtained the 3 upper limit to the count rate, cts/sec, and we converted this limit to 0.5 -2 keV flux of erg s-1 cm-2 using PIMMS222http://heasarc.gsfc.nasa.gov/Tools/w3pimms.html(Mukai 1993) and assuming the Galactic column density of cm-2, and a photon index .
1422+424
The source 1422+424 was observed with Chandra X-ray Observatory on Sep.25, 2002 for about 6 ksec (Risaliti et al. 2003). The source is relatively X-ray weak, but not significantly reddened, with the photon index equal to . The X-ray flux is erg s-1 cm-2 in 0.5-2 keV band,and erg s-1 cm-2 in 2 - 10 keV band (Risaliti et al. 2003, Risaliti et al, in preparation private communication).