Avoiding the uncertainty from correlation
between
and CP phase
in
long baseline experiments
Keiichi Kimura1,
Akira Takamura1,2
and Tadashi
Yoshikawa1 1Department of Physics, Nagoya University, Nagoya, 464-8602,
Japan
2Department of Mathematics,
Toyota National College of Technology
Eisei-cho 2-1, Toyota-shi, 471-8525, JapanE-mail: kimukei@eken.phys.nagoya-u.ac.jpE-mail: takamura@eken.phys.nagoya-u.ac.jpE-mail: tadashi@eken.phys.nagoya-u.ac.jp
Abstract
We introduce a new index to find where is the
better setup of the baseline length and energy to avoid as well as possible
the uncertainty from the correlation between and in long baseline
experiments.
Detection of the CP effect in lepton sector (MNS matrix[1])
is one of the remaining most important subjects in not only
elementary particle physics but also particle cosmology.
To confirm the existence of the CP phase, many long baseline
experiments[2, 3, 4, 5]
by using oscillation mode are proposing.
After finding the CP effects in , as the
next step, it will be
an important subject to check whether they are consistent with the
standard model(SM). To do so, we need to measure the CP effects(phase)
independently by using the other oscillation mode.
Measuring CP phase by mode is going to be more
important to confirm the SM and to investigate the existing possibility
of new physics. We have to confirm the consistency and the unitarity
in lepton sector[6] by comparing the observables extracted from the
different oscillation modes.
We are investigating the CP effect in
mode in our work[7]. The dependence of the probability on the
CP phase with the maximal 2-3 mixing is written
as follows[7, 8, 9]:
(1)
where as a coefficient of is negligible
because the magnitude should be proportional to the quite small parameter
. and
are the quantities determined by the parameters except for the CP
phase .
The effect from depends on the magnitude of so that it is an index to know the CP dependence.
We discussed where is better set of the baseline length and the neutrino
energy to extract the CP effect from
experiment and pointed out it favors
, . At once, we showed it seems to be
difficult to determine the CP phase because there is
a correlation between and in small
[7, 10].
In this letter, we introduce a new index to
look for the better region in plane and to avoid the uncertainty
from - correlation. Here we are using
the following input parameters:
, and for an unknown parameter ,
the upper bound[11] is used.
In the estimation of the probability , we are using
the exact solution for the neutrino oscillation in matter
[8, 12].
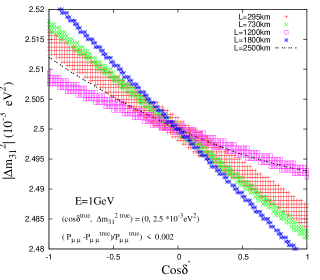
The - correlation is plotted in Fig.1,
where we assume as the true values
and the plotted points show where the probability
at the fake values are almost same
with at true value.
The figure shows the linear relation between the fake parameters
and .
As we discussed in our previous work[7], there is a relation
between the true value and fake one which are producing same
probability approximately within the as follows:
(2)
(3)
where .
If the relation are satisfied, it means
one can not determine the magnitude of CP phase
without uncertainty. Namely, for the error of
, all range of is
satisfied as the solution. Indeed, even if the error is level,
,
we have to consider the uncertainty.
Figure 1: The region shows where
is smaller than (Left)
and ,(Right) for
and at .
The left is that for at several
baseline length L and the right is for with
From the left of Fig.1, one can find the linear relation between
and for several baseline
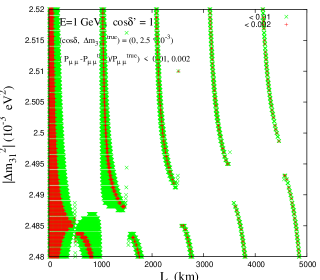
lengths. The right figure shows the dependence of
fake region of on the baseline length
at the case of
which leads to same probability
with true (input) value . From this, we find that
the dependence may not be so trivial.
One can find that the fake region breaks at several s
in the right of Fig.1.
Hence we investigate around where the fake region disappears.
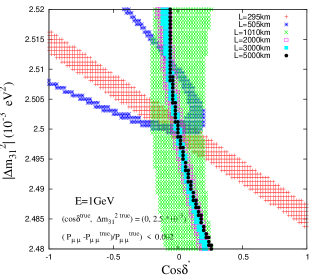
Figure 2: The region satisfing on
is shown in the left
figure. The region shows almost same probability with it at
and for several s.
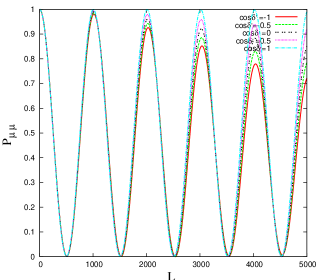
The probability as a function of at
in
the right.
At ,
the correlation of and are
plotted in Fig.2(left).
The dependence seems to be different with the case in Fig.1
and the almost plotted points are around
the true value at the where the fake regions
disappear in Fig.1. It may show that at the several suitable L
one can investigate the CP phase without depending on the error of so strong. Where is the region on () ?
Comparing the right one of Fig.1 with the Fig.2(right) which shows
the dependence of the probability on the baseline length L,
where the probability shows maximal or minimal.
The fake regions also break around but the probability
is almost so that we can not extract the CP effect around the .
On the other hand, at , shows
maximal and the CP effects will also be maximal so that it may be
possible to determine the CP phase without depending on
so hard. They correspond to
the region with large . From the left of Fig.2, one can find
the extracted solutions of is around the true
value for the error of at the special .
There is the uncertainty in determination of CP phase in
oscillation experiments
because of - correlation.
So we introduce a new index
to search for where is more suitable energy and distance
to avoid the uncertainty. It is defined by the difference of
maximum and minimum probabilities ( and
) within the error of
()111We expect that the experimental error
of will be reduced up to level
in the future experiments..
(4)
This is the index to indicate how affecting the probability from
the error of . The regions which the new index is
as small as possible are favored to avoid the effects from . On the other hands, to determine the CP phase, the regions
the dependence on becomes larger are favored.
Using one can find the regions. is a
coefficient of in eq.(1) and it can be also defined as
the difference between the maximum and minimum of s within all
range of .
(5)
This corresponds to the numerator of [13].
The region with large will be useful to extract the CP phase.
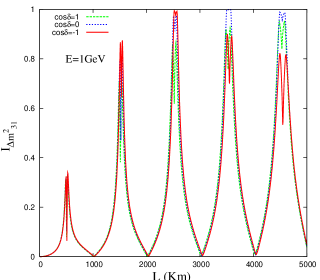
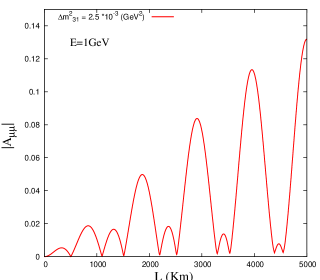
The dependence of and on at
are plotted in Fig.3.
Figure 3: for CP phase (left) and (right)
as the function of baseline length at .
From Fig.3, around km,
become minimum and then are showing nonzero values and
not so small value. It means that around them, it may be possible to
detect the CP phase without depending on so strong.
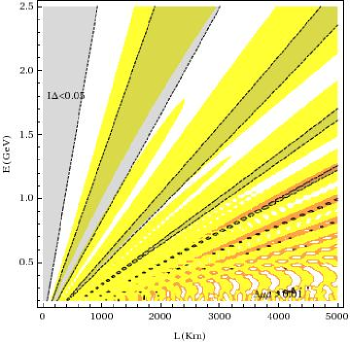
The same discussion on the plane leads to the better
setup to extract CP angle. In Fig. 4, the region are shown as yellow(red)
area shows and gray is .
Figure 4: The better region to extract CP effect without depending
on the experimental error of are shown
as the overlapping area. The yellow region show ,
the red region is
and the gray one is .
From Fig.4, one can roughly estimate the better experimental setup
to detect CP phase without depending on the error of so strong. Around which means
T2KK[4], around or
is better energy region. Indeed, longer is favored for
but the minimal values of will
depart from zero so that we must more carefully choose the best
place222We are investigating the T2KK case by using numerical
analysis, which will be reported in the other paper[14]..
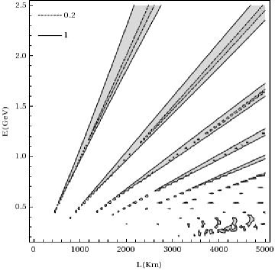
In addition, we define
as the ratio between and as following,
(6)
Around the where the ratio is smaller than 1
the dependence of on should be smaller
than the effect by CP phase. In Fig.5, the region of small are
plotted. It may show that we can constrain by using
the setup of ().
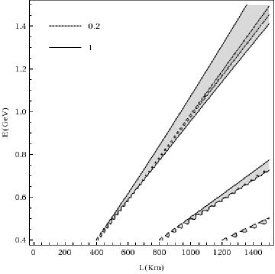
Figure 5: The better region to extract CP effect without depending
on the experimental error of are shown
as the area with (dashed lines), and (solid line).
If the experiments are fixed, taking the small and suitable energy
bin size, we can avoid the uncertainty from - correlation.
To estimate where is the better setup of ,
the new index may be a powerful tool.
As you find from Fig.1, even if the error of is
reduced, the uncertainty of will remain in almost cases
which are not chosen as so good . We expect that the new index
is going to be such powerful tool to improve the determination of CP
phase in oscillation and it will
be possible to confirm
the consistency with the CP effects in .
Acknowledgment
The work of T.Y. was supported by 21st Century COE Program of Nagoya
University.
References
[1]
Z. Maki, M. Nakagawa and S. Sakata,
Prog. Theor. Phys. 28, 870 (1962).
[2]
Y. Itow et al. [The T2K Collaboration],
arXiv:hep-ex/0106019.
[3]
D. S. Ayres et al. [NOvA Collaboration],
arXiv:hep-ex/0503053.
[4]
M. Ishitsuka, T. Kajita, H. Minakata and H. Nunokawa,
Phys. Rev. D 72, 033003 (2005);
K. Hagiwara, N. Okamura and K. i. Senda,
Phys. Lett. B 637, 266 (2006)
[Erratum-ibid. B 641, 486 (2006)].
[5]
O. Mena Requejo, S. Palomares-Ruiz and S. Pascoli,
Phys. Rev. D 72, 053002 (2005) .
[6]
J. Sato,
Nucl. Instrum. Meth. A 472, 434 (2001);
Y. Farzan and A. Y. Smirnov,
Phys. Rev. D 65, 113001 (2002);
H. Zhang and Z. z. Xing,
Eur. Phys. J. C 41, 143 (2005).
[7]
K. Kimura, A. Takamura and T. Yoshikawa,
arXiv:0711.1567 [hep-ph].
[8]
K. Kimura, A. Takamura and H. Yokomakura,
Phys. Lett. B 537, 86 (2002) ;
K. Kimura, A. Takamura and H. Yokomakura,
Phys. Rev. D 66, 073005 (2002) ;
K. Kimura, A. Takamura and H. Yokomakura,
J. Phys. G 29, 1839 (2003).
[9]
K. Kimura, A. Takamura and T. Yoshikawa,
Phys. Lett. B 642, 372 (2006).
[10]
A. Donini, E. Fernandez-Martinez, D. Meloni and S. Rigolin,
Nucl. Phys. B 743, 41 (2006).
[11]
M. Apollonio et al. [CHOOZ Collaboration],
Phys. Lett. B 466, 415 (1999).
[12]
H. Yokomakura, K. Kimura and A. Takamura,
Phys. Lett. B 544, 286 (2002) .
[13]
K. Kimura, A. Takamura and T. Yoshikawa,
Phys. Lett. B 640, 32 (2006).
[14]
K. Kimura, A. Takamura and T. Yoshikawa, work in progress.